R E S E A R C H A R T I C L E
Open Access
Comparison of two Bayesian methods to detect
mode effects between paper-based and
computerized adaptive assessments: a
preliminary Monte Carlo study
Barth B Riley
1*†and Adam C Carle
2†Abstract
Background:Computerized adaptive testing (CAT) is being applied to health outcome measures developed as paper-and-pencil (P&P) instruments. Differences in how respondents answer items administered by CAT vs. P&P can increase error in CAT-estimated measures if not identified and corrected.
Method:Two methods for detecting item-level mode effects are proposed using Bayesian estimation of posterior distributions of item parameters: (1) a modified robustZ(RZ) test, and (2) 95% credible intervals (CrI) for the CAT-P&P difference in item difficulty. A simulation study was conducted under the following conditions: (1) data-generating model (one- vs. two-parameter IRT model); (2) moderate vs. large DIF sizes; (3) percentage of DIF items (10% vs. 30%), and (4) mean difference inθestimates across modes of 0 vs. 1 logits. This resulted in a total of 16 conditions with 10 generated datasets per condition.
Results:Both methods evidenced good to excellent false positive control, withRZproviding better control of false positives and with slightly higher power forCrI, irrespective of measurement model. False positives increased when items were very easy to endorse and when there with mode differences in mean trait level. True positives were predicted by CAT item usage, absolute item difficulty and item discrimination.RZoutperformedCrI, due to better control of false positive DIF.
Conclusions:Whereas false positives were well controlled, particularly forRZ, power to detect DIF was suboptimal. Research is needed to examine the robustness of these methods under varying prior assumptions concerning the distribution of item and person parameters and when data fail to conform to prior assumptions. False identification of DIF when items were very easy to endorse is a problem warranting additional investigation.
Background
Computerized adaptive testing (CAT) is widely used in education and has gained acceptance as a mode for administering health outcomes measures [1,2]. CAT offers several potential advantages over conventional (e.g., paper-and-pencil) administration, including auto-mated scoring and storage of questionnaire data, and reduction of respondent burden. Instruments devel-oped for paper-and-pencil administration frequently
form the basis for CAT. In these situations, the transi-tion to computerized adaptive testing requires
estab-lishing the equivalence between CAT-administered
measures and their original paper-and-pencil version [3,4]. A meta-analytic review of 65 studies comparing computerized an paper-and-pencil administration of
patient-reported outcome measures suggests that
scores obtained by computer are comparable to those obtained by conventional modes of administration [4]. This study, however, did not focus on CAT. Unlike computer-based assessment, CAT selects items for ad-ministration based on item parameters that, if not ac-curate for CAT mode of administration, may diminish the reliability or efficiency of CAT [5,6]. Item-level
* Correspondence:[email protected]
†Equal contributors
1
Department of Health Systems Science, M/C 802, College of Nursing, University of Illinois at Chicago, 845 S. Damen Ave., Chicago, IL 60612, USA Full list of author information is available at the end of the article
mode effects, in other words, may have a greater effect on CAT compared to other assessment modalities. The shift in item parameters resulting from changes in ad-ministration mode reflects the presence of differential item functioning (DIF), which can be defined as differ-ential performance (e.g., differences in level of endorse-ment) of an item between two or more groups matched on the total score or measure [7,8]. This paper will focus on the detection of DIF between CAT and paper-and-pencil administrations of a measure.
Methods used for assessing DIF by mode of adminis-tration fall into two general categories: (1) approaches based on classical test theory (CTT), such as compari-sons of item p values, representing percentage of en-dorsement; and (2) methods based on item response theory (IRT) [9-12], including comparisons of item diffi-culty parameters. Confidence intervals of item endorse-ment probabilities (i.e., p-values) have been found to vary significantly by mode [13,14]. Pommerich [13] also presented the proportion of items statistically favoring each mode. In another study [15], itemp-values and IRT item difficulty parameters were compared and scatter-plots of item parameters across mode were constructed. Johnson and Green [16] compared p-values of items as well as conducted a qualitative examination of error types (e.g., transcription error, place value error, partial answer, computation error, misunderstanding) made by students in each mode. Keng, McClarty, and Davis [17] examined differences in mode at the item level by com-paring p-values and differences in chosen response cat-egory and by computing IRT-based DIF tests. Finally, Kim and Huynh [18] employed a robust-Z statistic to determine whether differences in item parameters across mode were statistically significant.
Though these studies often employed multiple meth-ods of assessing item comparability, systematic compari-sons across methods were not conducted. Nevertheless, there is reason to believe that some methods, such as item p-values may not be appropriate when detecting mode effects involving CAT-administered items. That is, differences in itemp-values may not be valid indicators of DIF if the samples completing each mode of assess-ment differ in mean level on the measure. Moreover, itemp-values can be influenced by the selective adminis-tration of items that takes place during CAT. For in-stance, CAT typically selects items that have an approximate probability of endorsement of 50% (i.e., items tailored to the individual to provide maximum in-formation). Therefore, comparing CAT vs. P&P item p -values would likely result in items erroneously flagged as exhibiting DIF.
Several methods have been developed that attempt to overcome the limitations of classical procedures for detecting mode effects. Most of these methods are based
on item response theory and involve comparisons of item parameters after matching of respondents accord-ing to trait level. Achievaccord-ing accurate identification of DIF based on an IRT framework requires precise esti-mates of item parameters and person measures and the use of an appropriate measurement model [6]. However, a limitation of IRT-based methods is that missing data (e.g., resulting from CAT administration) can reduce ac-curacy in parameter estimates and in DIF detection [19,20]. In their simulation study, Robitzsch and Rupp [19] observed that when the missing data rate was 30% and data were missing at random, mean bias (difference between true and observed differences in item difficulty between groups) was 0.60, nearly two standard devia-tions above average bias across all condidevia-tions. CAT can reduce the number of items administered by as much as 90%, depending upon the size and quality of the item bank and criteria for stopping the test [21-23]. Therefore, higher rates of bias would likely occur when examining DIF in CAT-administered items with these methods.
Given the uncertainty in trait and item parameters, some investigators have recommended methods to iden-tify DIF based on Bayesian probability theory. Bayesian approaches use probability distributions to model uncer-tainty in model parameters. These probability distribu-tions represent prior beliefs or assumpdistribu-tions concerning the nature of the data and the level of uncertainty regarding various parameters. For instance, an investiga-tor may specify that item discrimination parameters ad-here to a lognormal distribution with log mean of 0 and variance of 0.5. The prior (particularly the prior vari-ance) reflects uncertainty about the values before ob-serving the data. Conversely, the posterior distribution reflects updated knowledge about parameter values after observing the data. Bayesian approaches make inferences using the posterior distribution. Unlike frequentist sta-tistics, Bayesian methods do not rely on asymptotic (large-sample) theory in order to obtain standard errors, making Bayesian methods particularly attractive when small samples or missing data are involved.
resulted in a higher Type I error rate (ranging from 10% to 20%) compared to conventional MH.
A second approach involves estimation of the poster-ior distribution of model parameters, which can be used in subsequent DIF analyses [28-31]. Wang, Bradlow, Wainer and Muller [31] examined DIF for a given item by producing separate item difficulty estimates for each group. Posterior distributions of the item difficulty par-ameter (biG1 and biG2 for groups 1 and 2, respectively) are computed, and from this a Bayesian p value repre-senting the number of times (biF-biR) >0 can be used as an indicator of DIF. This procedure provided more ac-curate results compared to standard MH DIF analysis, especially when items were very easy to endorse [31]. In a similar application [29] posterior distributions of profi-ciency measures were used in two nonparametric
regres-sion models (one with and one without group
membership as a covariate) to compute posterior mean pvalues for the likelihood ratio based on the two mod-els. Using Bonferroni-adjusted pvalues and a total sam-ple size of 900 simulees, the investigators were able to obtain power of .90 to 1.00 and false-positive rates well below the set alpha level of .05.
Despite these promising results, none of the studies employing posterior distributions of item parameter esti-mates assessed DIF in CAT-administered items. More-over, to our knowledge there has been no application of Bayesian methods to the assessment of DIF between non-CAT and CAT-administered assessments. Standard methods of assessing DIF can be problematic when com-paring CAT- and P&P-administered data because of the confounding of CAT item selection, sample differences in trait level, and actual mode effects.
Rationale of the Study
It is common practice to employ paper-based forms when validating and scaling an item bank for use in CAT. Thus, it is important to determine that the result-ing item parameters are not influenced by mode DIF. As suggested earlier, current methods of assessing DIF may not be appropriate when comparing adaptively and non-adaptively administered items. One solution would be to administer the entire item bank via computer and con-ventional modes of administration and then employ standard methods of DIF assessment. Whereas this ap-proach could be used with small item banks, it would be quite burdensome to respondents and likely require col-lecting data apart from standard assessment practice with very large item banks.
Other researchers have already faced this issue. For ex-ample, to reduce respondent burden, the Patient Reported Outcomes Information System (PROMIS) only administered the entire set of initially developed PRO-MIS item to a small set of individuals from the total
PROMIS calibration sample. This has limited the PRO-MIS collective’s ability to address some key issues, simi-lar to what we raise here. Thus, while the less technical approach is possible, we suspect the common problem of needing to reduce respondent burden will generally limit the application of the less technical approach, indi-cating the need for alternative approaches. One alterna-tive approach, which we present in this paper, is to develop procedures appropriate for detecting mode DIF in CAT vs. non-CAT-administered items, enabling as-sessment of DIF using data collected as part of standard assessment.
The purpose of the present study was to develop and evaluate two approaches to assessing item-level mode effects employing a Bayesian framework. In the following sections we outline this framework and describe the de-sign and results from a preliminary Monte Carlo simula-tion study. The procedures are described and evaluated with respect to false-positive (i.e., DIF is detected when not simulated) and true-positive (i.e., DIF is detected when simulated) detection rates under several study conditions. We then examine factors associated with true and false DIF identification.
Research Questions:
1. How well does each method detect item-level mode effects as indicated by ROC analysis, true positive and false positive rates? In the present study, true positives are defined as identification of items as exhibiting mode DIF when mode DIF is simulated, which is also referred to as correct DIF detection. Conversely, false positives refer to flagging of items as exhibiting DIF when DIF was not simulated, which is also referred to as incorrect DIF detection. 2. What factors influence correct (true positive) and
incorrect (false positive) detection of item-level mode DIF using each procedure?
Methods
The methods employed in this study will be presented in three main sections. First, we describe the development and underlying assumptions of two Bayesian methods for detecting item-level mode effects. Second, we de-scribe the simulation study, including its design and data generation procedures. The third section outlines the analysis of the simulated data.
A Bayesian procedure for detecting item-level mode effects
In the proposed model, analysis of mode effects involved a three-step process:
That is,θis obtained using item parameters based on the combined CAT and P&P response data. This is to ensure that item parameters estimated in subsequent steps are on a common metric.
Step 2. Usingθiobtained in Step 1, estimate the posterior distributions of mode-specific item parameters for subsequent comparison in step 3.
Step 3. Estimate DIF for each item common across modes by assessing the difference in the posterior distributions of the item parameters (i.e., betweenβjCATandβjP&P). In the present study we examined two approaches to making this comparison. The first approach involved calculating a variation of the robust Z statistic [32] as shown in equation 1:
Robust Zj¼
Med βCATj βP&Pj
0:74 IQR βCATj βP&Pj
h i
ð1Þ
whereMedis the median and IQR is the interquartile range. The standard robust Z is asymptotically con-sistent with a standard normal distribution while min-imizing the effect of extreme values. It has been used as a screening method for identifying stable items for IRT linking and DIF procedures [18,32]. Unlike previ-ous application of the robust Z in which the median and interquartile range are based on point estimates of parameters for all items in the instrument, here these values are based on the posterior distribution of the parameters for item j in each administration mode.
The second approach involved constructing the 95% credible interval (CrI) of the CAT vs. P&P difference for item j’s difficulty parameter. This interval is computed by obtaining the 2.5 and 97.5 percentiles of item j’s pos-terior distribution of βjCAT – βjP&P. In order to obtain a single value reflecting the level of mode DIF, we also computed the minimum difference of each bound of the CrIfrom zero (referred to as ΔCrI). Note thatΔCrI = 0 if the credible interval includes zero. The following priors were used in the model:
θi~Normal(0,1)
αj~Lognormal(0,0.5)
βj~ Normal(0,2)
Yij~Bernouli(P[Yij= 1|θ,α,β])
where the first value in parentheses for priors of θi, αj,
and βj is the prior mean and the second is the prior
variance. These priors may be regarded as “ semi-informative.” They are similar to priors employed in
earlier IRT studies, with the exception that we selected a lognormal rather than a truncated normal prior for the discrimination parameters [33-35].
The Markov chain Monte Carlo estimation consisted of three parallel chains each with a separate and ran-domly generated set of starting values for model para-meters. For each chain, the first 1,000 MCMC iterations were discarded (burn-in phase), followed by 500 itera-tions per chain retained for subsequent analysis. The total number of iterations and the length of the burn-in phase were chosen on the basis of preliminary examin-ation of trace plots of item and person parameters which revealed good convergence of the three chains of param-eter estimates (analysis results are available upon re-quest). Using additional iterations or a longer burn-in did not change DIF analysis results.
Simulation study
A preliminary Monte Carlo simulation study was per-formed to assess the accuracy of the proposed method for detecting item-level mode effects. Two interests guided the design and implementation of this simula-tion: First, in this preliminary study we decided to re-strict our focus to uniform DIF instead of or in addition to non-uniform (i.e., discrimination) DIF. Second, we fo-cused on instruments fitting a one- (1PL) or two-parameter (2PL) IRT model [9-11], which are commonly applied to health outcome measures. . Under the two-parameter (2PL) model, let i index respondents (i = 1. . .N) and let j index items (j = 1. . .L). The probability of respondentiendorsing itemjcan be expressed as
P
Yij¼1αj;βj;θi
¼ exp Dαj θiβj
h i
1þ exp Dαj θiβj
h i
ð2Þ
whereYijis the response to itemjby respondent i,αjis
the discrimination parameter andβjis the difficulty par-ameter for itemj,θiis respondenti’s measure on the
la-tent trait, and D is a scaling constant. In our
simulations, D = 1.702 which makes the estimated re-sponse probabilities consistent with the normal ogive model and is used by the IRT estimation software employed in the study. In the one-parameter (1PL) case, allaiare equal across items.
Study Design
difference in θ estimates across modes of 0 vs. 1 logits. We employed a fully crossed research design that resulted in a total of 16 conditions, with 10 replications (datasets) per condition.
Data Generation
Data were generated for the present study in three steps: (1) generation of validation (paper-and-pencil) data, (2) generation of CAT item response data, and (3) CAT simulation, which produced item response datasets con-taining only those items selected by the CAT. Each of these steps is outlined in the following sections.
Generation of the Validation (Paper-and-Pencil) Item Parameters and Response Data
For each IRT model, a set of item parameters and corre-sponding item response datasets were generated. Both item banks consisted of 100 items. In the 1PL model, discrimination (αj) parameters for all items were set to 1.0; in the 2PL item bank,αjparameters were randomly generated from a lognormal distribution with log mean = 0 and SD = 0.5, with values restricted to a range of 0.5 to 2.5. Discrimination parameters were limited to this range because items with very low discrimination (i.e., less than 0.5) are rarely used in item banks, whereas highly discriminating items (i.e., true discrimination parameters greater than 2.5) tend to be poorly estimated (i.e., positively biased) parameters [36]. For both item banks, item difficulty (βj) parameters were generated
from a uniform distribution ranging from −3.0 to 3.0 logits, in increments of 0.25 logits. Person measures (θi)
for 500 simulees were generated using anN(0, 1) stand-ard normal distribution.
Parameter Estimation
The generated item-response data were then used to es-timate IRT item parameters (see Additional file 1). For both datasets, the standard deviation of the theta esti-mates was set to 1.0 in order to identify the model. In the 1PL case, discrimination parameters were also con-strained to be equal across items. Maximum likelihood estimation was employed rather than a Bayesian proced-ure in order to avoid potential confounds between Bayesian priors used in item calibration and subsequent DIF analysis. Correlations between true and estimate βj
parameters were 0.99 and 1.00 and root mean squared error (RMSE) values were 0.11 and 0.15 for 1PL and 2PL-generated datasets, respectively. For the 2PL data, correlation between true and estimated αj parameters
was .9 and RMSE was 0.14. As previously observed [36], RMSEs for the discrimination parameters increased with higher values ofαj. The estimated item parameters were
used in subsequent CAT simulations. RMSEs and corre-lations between item parameters and their estimates
were consistent parameter recovery results presented elsewhere [37-39].
Generation of CAT Item Response Data
Prior to performing CAT simulations, response data for all 100 items in the simulated item banks described above were generated for a total of 3000 simulees in each iteration. This sample size permitted examination of the effect of CAT item usage on DIF detection rates. Employing the study variables described above, a total of 160 item-response datasets were created and used for CAT simulation. For each dataset, person measures were generated from an N(μCAT, 1.0) distribution, where
μCAT= 0.0 or 1.0. Non-DIF-item response data were gen-erated using the estimated parameters in Additional file 1. Items simulated to exhibit mode effects (DIF) were randomly selected according to the percentage of DIF items (10% or 30%) for the specified simulation condi-tion. The direction of DIF (i.e., easier vs. more difficult to endorse in the CAT sample) was also randomized. Specifically, a value of 1 (harder to endorse) or−1 (easier to endorse) was generated from a uniform discrete distri-bution. This value was then multiplied by the appropriate DIF magnitude (0.42 or 0.63 logits), with the resulting value added to the correspondingβjparameter (see
Add-itional file 1 for table of generated and estimated item parameters and Additional file 2, Additional file 3, Add-itional file 4 for data files containing these parameters and item response data used in the simulation) The αj
parameters for the generated CAT item responses were the same as those used to generate the initial P&P data.
CAT Simulation
Each generated dataset was then used in a series of CAT simulations. In order to ensure comparability across conditions, a fixed-length CAT consisting of 30 adminis-tered items for each simulee was conducted. This stop-ping rule is similar to that used in a previous investigation of CAT and DIF [40]. All CAT simulations employed maximum-likelihood estimation and item se-lection based on Fisher’s information criterion, a stand-ard CAT algorithm. Each CAT simulation produced the following data: (1) item responses of items selected dur-ing the simulated CAT session, (2) index numbers iden-tifying the items selected by CAT, and (3) estimated theta and standard error of theta for each CAT simulee. The originally simulated P&P response data and simu-lated CAT item-response data were employed in the DIF analysis procedures described earlier (see “A Bayesian Procedure for Detecting Item-Level Mode Effects”).
Analysis
simulation results and theRZandCrIstatistics. Descrip-tive statistics for the CAT simulations included CAT-to-full-scale correlations and mean standard errors (MSE), Distributional properties of theRZ andCrIstatistics, in-cluding mean, standard deviation, skewness, kurtosis, and values corresponding to the 2.5 and 97.5 percentiles were calculated.
Detection of Mode Effects (Research Question 1)
The overall performance of the robust Z (RZ) and Bayesian credible interval (CrI,as measured by the mini-mum difference of CrI to 0 or ΔCrI) was assessed first by examining the sensitivity, specificity, and correct clas-sification rates using cutoff values forα = .05 (i.e., |RZ| > 1.96 and 95%ΔCrI6¼0).
Logistic regression and ROC analyses were also per-formed to examine the predictive accuracy of each stat-istic without reference to specific cutoff values. Since bothRZ andΔCrIcan have negative and positive values that are indicative of mode DIF, we first fit a logistic re-gression model with a quadratic term (i.e.,RZ+RZ2and
ΔCrI+ΔCrI2for robustZand credible interval models, respectively) to predict simulated mode DIF. ROC ana-lyses were then conducted based on predicted probabil-ities from each logistic regression model. The difference in the area under the ROC curves (AUCs) was also assessed for statistical significance using a chi-square procedure [41]. Descriptive statistics (percentages) were used to summarize the true positive and false positive mode-of-administration DIF results in the simulation study.
Factors Related to True and False Positive Mode Effects (Research Question 2)
A series of multilevel random-intercept logistic regres-sion analyses were performed at both univariate (single predictor) and multivariate levels. At the multivariate level, four models were developed, one for each statis-tical test (RZ and ΔCrI) and each DIF decision (correct and incorrect). In each model, the main predictors are: (a) size of DIF, (b) percentage of DIF items in the data-set, (c) IRT model used to generate the response data, (d) difference in mean performance between the P&P and CAT samples (0 vs. 1 logit), (e) number of times a given item was administered by CAT (item usage), (f ) item difficulty, and (g) item discrimination, the latter two predictors based on the estimated parameters using the simulated P&P dataset. Preliminary analyses revealed that absolute values of item difficulty better predicted correct DIF detection, whereas signed item difficulty values more accurately predicted incorrect DIF deci-sions. With the exception of binary variables (i.e., IRT model, difference in CAT vs. P&P mean trait level), pre-dictors were normalized by dividing each variable by two
standard deviations prior to analysis [42]. AUC values derived from ROC analyses based on each model and each individual were also reported to indicate predictive efficacy. Random intercepts were estimated at both item and dataset levels.
Relationship of Item Difficulty to Power and Type I Error
In order to provide a clearer picture of the relationship of item difficulty with power and Type I error, a plot of mean power and Type I error by P&P item difficulty was created. This plot was based on a series of linear regres-sion analyses to predict mean power and Type I error for bothRZandCrIusing the paper-and-pencil item dif-ficulties and their higher level (i.e., quadratic, cubic, quartic, and quintic) terms as predictors. Predicted values from these regression analyses were used to cre-ate the plot.
Software
Generation of item and person parameters and item re-sponse data was performed in the R statistical package [43]. Estimation of P&P item parameters was performed using MPlus version 6.0 [44]. CAT simulations were per-formed with Firestar version 1.33 [45]. For the DIF pro-cedures, estimation in Steps 1 and 2 of the DIF analyses outlined above was performed using WinBUGS version 1.4.3 [46]; see Additional file 5], which has been used in previous IRT applications [28,30,39]. Specifically, we called WinBUGS from R using the R2WinBUGS package [47], the latter used to retrieve the posterior estimates generated by WinBUGS for subsequent analysis. De-scriptive analyses and analyses of the simulation results were performed in Stata version 11.0 (Stata Corp., Col-lege Station, Texas).
Results
Descriptive analyses
CAT Simulation
The CAT simulations are summarized in Table 1. As seen in Table 1, CAT to full-instrument correlations were .97 across all conditions. MSEs were 0.26 for the 1PL and 0.23-0.24 for the 2PL conditions. Comparable results were observed as a function of DIF magnitude and percentage and meanθCAT.
for the 1PL and 2PL conditions, respectively. For CrI, 80 percent power was associated with CAT item usage of 305 and 341 for 1PL and 2PL conditions, respect-ively. In the 2PL condition, item usage was positively correlated with item discrimination (r = .46, p < .01), reflecting the fact that CAT-bases item selection on item discrimination.
Robust Z and 95% Credible Interval Indices
Among non-DIF items, RZ had a mean of −0.10 and a
standard deviation of 0.82. Mean ΔCrI was 0.01
(SD=.06). Though both indices were positively skewed and leptokurtotic, this was particularly true forΔCrI(RZ skewness = 0.26, ΔCrI skewness = 14.94; RZ kurtosis = 1.46; ΔCrI kurtosis = 253.70). RZ values of −1.60 and 1.53 corresponded to the 2.5 and 97.5 percentiles for items not simulated with mode DIF, respectively. Both 2.5th and 97.5th percentiles corresponded to a ΔCrI of 0.00 for non-DIF items.
Detection of mode effects (Research question 1)
Correct classification, sensitivity, and specificity were examined using expected cutoff values atα= .05 level, i.e., |RZ| > 1.96 and ΔCrI 6¼ 0. Employing these criteria resulted in correct classification, sensitivity, and specifi-city of 92.4%, 69.1%, and 98.1% forRZand 92.3%, 71.8%, and 97.2% for ΔCrI, respectively. Since our descriptive results presented above suggest that both indices are non-normal, these cutoff values may not be appropriate. We therefore performed logistic regression and ROC analyses to examine the relative performance of the two indices without reference to specific cutoff values. ROC analyses revealed an area under the curve (AUC) of .91 and .82 for RZ and ΔCrI, respectively. This dif-ference in AUCs was statistically significant [X2(1) =
545.06,p< .0001]. This indicates that RZ values are sig-nificantly stronger predictor of the presence of mode DIF compared to ΔCrI values. Further analyses revealed that empirically derived cutoff values for both RZ and
ΔCrI may help to improve sensitivity or specificity. However, since these results are preliminary and for convenience purposes, results presented in subsequent sections of the paper will use the original cutoff values of |RZ| > 1.96 andΔCrI 6¼0.
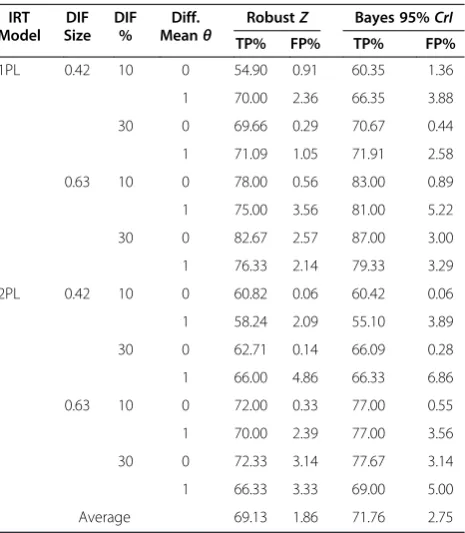
Table 2 summarizes mean true positive and false posi-tive percentages for each of the simulation conditions. Overall, the false positive rate was well controlled, par-ticularly with RZ, with an average false positive rate of 1.9% and ranging from 0.1% to 4.9%. False positive rate was somewhat higher forΔCrI, averaging 2.8% and ran-ging from 0.1% to 6.9%. The false positive rate for RZ was higher under the large (0.63) DIF effect size condi-tion (RZ: 2.3%;ΔCrI: 3.1%) relative to the medium (0.42) DIF effect size (RZ: 1.5%;ΔCrI: 2.4%), and when 30% of the items exhibited DIF (RZ: 2.2%; ΔCrI: 3.1%) relative to the 10% condition (RZ: 1.5%;ΔCrI: 2.4%). False posi-tive rates also increased as the difference in mean trait levels between the CAT and P&P modes increased from 0 (RZ: 2.8%; ΔCrI: 3.0%) to 1.0 logits (RZ: 4.4%; ΔCrI:
Table 1 Summary of CAT simulations by underlying measurement model, DIF size, mean CAT measures and percentage of DIF items
IRT Model
CAT to Full-Scaleθ Correlation
Mean Standard Error
1PL 2PL 1PL 2PL
DIF Size 0.42 0.63 0.42 0.63 0.42 0.63 0.42 0.63
Diff. Meanθ= 0
DIF % = 10 0.97 0.97 0.97 0.97 0.26 0.26 0.23 0.24
DIF % = 30 0.97 0.96 0.97 0.97 0.26 0.26 0.24 0.24
Diff. Meanθ= 1
DIF % = 10 0.97 0.97 0.97 0.97 0.26 0.26 0.24 0.24
DIF % = 30 0.97 0.96 0.97 0.97 0.26 0.26 0.24 0.24
Average 0.97 0.97 0.97 0.97 0.26 0.26 0.24 0.24
1PL = one-parameter item response model; 2PL = two-parameter item response model; CAT = computerized adaptive testing; DIF = differential item functioning; IRT = item response theory;θ=person measure.
Table 2 True positive and false positive rates as a function of generating IRT model, DIF size, number of DIF items, and mean difference between modes
IRT Model
DIF Size
DIF %
Diff. Meanθ
RobustZ Bayes 95%CrI
TP% FP% TP% FP%
1PL 0.42 10 0 54.90 0.91 60.35 1.36
1 70.00 2.36 66.35 3.88
30 0 69.66 0.29 70.67 0.44
1 71.09 1.05 71.91 2.58
0.63 10 0 78.00 0.56 83.00 0.89
1 75.00 3.56 81.00 5.22
30 0 82.67 2.57 87.00 3.00
1 76.33 2.14 79.33 3.29
2PL 0.42 10 0 60.82 0.06 60.42 0.06
1 58.24 2.09 55.10 3.89
30 0 62.71 0.14 66.09 0.28
1 66.00 4.86 66.33 6.86
0.63 10 0 72.00 0.33 77.00 0.55
1 70.00 2.39 77.00 3.56
30 0 72.33 3.14 77.67 3.14
1 66.33 3.33 69.00 5.00
Average 69.13 1.86 71.76 2.75
5.8%). The false positive rate increased slightly when data were generated and CAT conducted using the two-parameter IRT model (RZ: 2.0%; ΔCrI: 2.9%) relative to the 1PL condition (RZ: 1.7%;ΔCrI: 2.69%). Though these results are promising, it should be noted that 10.2% of datasets evidenced false positive rates above the nominal .05 rate usingRZ and 15.1% exceeded the 5% false posi-tive threshold whenΔCrIwas employed.
The present findings revealed power (true positive) rates of 69.1% and 71.8% for RZ and ΔCrI, respectively. Power was highest in the 1PL condition when DIF was large (0.63 logits) and the percentage of items with DIF was high (30%) and the mean difference in trait level be-tween CAT and P&P modes was 0 (RZ: 82.7%; ΔCrI: 87.0%). Power was lowest for RZ in the 1PL, medium DIF effect size (0.42) 10% DIF items and mean θCAT
-θP&P
= 0 condition (54.9%) whereas forΔCrIit was low-est under the 2PL, medium DIF effect size, 10% DIF items, and mean θCAT-θP&P = 1.0 (55.1%). For RZ, the average true positive rate was 64.2% when DIF size = 0.42 and 74.1% when DIF size = 0.63 logits. Similarly, true positive rates of 64.7 and 78.9 were observed using
ΔCrIfor medium and large DIF effect sizes, respectively.
Factors related to true and false positive mode effects (Research question 2)
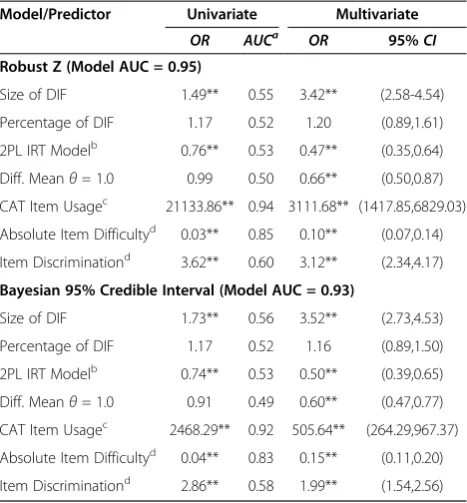
We examined the relationship of study independent vari-ables, CAT item usage and item parameters on correct (true positive) and incorrect (false positive) DIF deci-sions by conducting a series of random-intercept multi-level logistic regression analyses, with separate models to predict correct and incorrect DIF decisions based onRZ and ΔCrI. IRT model used to generate the data and in CAT, DIF size, percentage of DIF, mean difference in trait level, item difficulty, and discrimination (based on values estimated from the simulated P&P data) were used to predict correct and incorrect identification of mode effects and are presented in Tables 3 and 4, re-spectively. At the univariate level, correct DIF detection was significantly and positively predicted by DIF size, CAT item usage, and item discrimination and signifi-cantly and inversely related to the 2PL model and abso-lute values of P&P item difficulty parameters for both RZ and ΔCrI statistics. ROC analyses at the univariate level revealed that CAT item usage was most predictive of correct DIF decisions (AUCs=0.94 and 0.92 for RZ and ΔCrI, respectively) followed by absolute item diffi-culty (AUCs=0.85 and 0.83 for RZ and ΔCrI, respect-ively). All significant predictors at the univariate level were also significant in the multivariate model. Though not significant at the univariate level, mean difference in mean trait level by mode of 1 logit was significantly and inversely related to true mode DIF detection in the multivariate model. It is noteworthy that both CAT item
usage and absolute item difficulty were significant pre-dictors in the multivariate models given that these vari-ables are strongly and negatively correlated (r=−.67), indicating that items of high and low difficulty are admi-nistered less frequently by CAT.
For the RZ procedure, univariate logistic regression analyses revealed that the following were significantly and positively associated with increased false-positive DIF results: size of DIF, mean difference in mean trait level by mode, CAT item usage, and item discrimination (see Table 4). Conversely, item difficulty was inversely associated with false positive results, indicating that items of higher difficulty were less likely to be incor-rectly flagged as exhibiting mode effects. These predic-tors were also significant at the multivariate level with the exception of item discrimination. For the CrI pro-cedure, size of DIF and difference in mean trait level by mode significantly and positively predicted false-positive DIF results, whereas item difficulty was significantly and inversely associated with false positive mode DIF. These factors were also statistically significant in the multivari-ate model. CAT item usage was also significantly and positively predictive of false positive DIF results in the multivariate model. Based on AUCs, item difficulty was
Table 3 Univariate and multivariate multilevel logistic regression to predict correct detection of mode effects defined by Robust Z and Bayesian 95% credible interval as a function of study variables
Model/Predictor Univariate Multivariate
OR AUCa OR 95%CI
Robust Z (Model AUC = 0.95)
Size of DIF 1.49** 0.55 3.42** (2.58-4.54)
Percentage of DIF 1.17 0.52 1.20 (0.89,1.61)
2PL IRT Modelb 0.76** 0.53 0.47** (0.35,0.64)
Diff. Meanθ= 1.0 0.99 0.50 0.66** (0.50,0.87)
CAT Item Usagec 21133.86** 0.94 3111.68** (1417.85,6829.03)
Absolute Item Difficultyd 0.03** 0.85 0.10** (0.07,0.14)
Item Discriminationd 3.62** 0.60 3.12** (2.34,4.17)
Bayesian 95% Credible Interval (Model AUC = 0.93)
Size of DIF 1.73** 0.56 3.52** (2.73,4.53)
Percentage of DIF 1.17 0.52 1.16 (0.89,1.50)
2PL IRT Modelb 0.74** 0.53 0.50** (0.39,0.65)
Diff. Meanθ= 1.0 0.91 0.49 0.60** (0.47,0.77)
CAT Item Usagec 2468.29** 0.92 505.64** (264.29,967.37)
Absolute Item Difficultyd 0.04** 0.83 0.15** (0.11,0.20)
Item Discriminationd 2.86** 0.58 1.99** (1.54,2.56)
the single best predictor of false positives in DIF identifi-cation for both RZ and CrI, followed by difference in mean trait level between modes. The overall model AUCs were 0.77 and 0.74 forRZ and ΔCrI DIF indices, respectively.
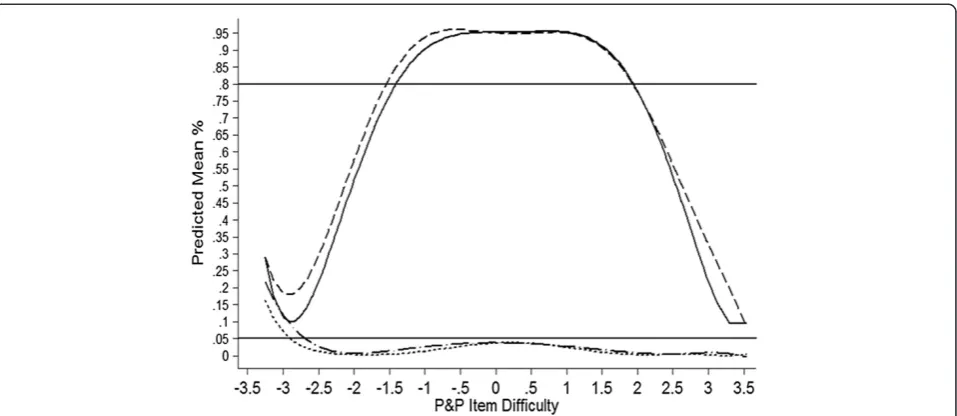
Relationship of Item Difficulty to Power and Type I Error
In order to better understand the performance of RZ and CrI at varying levels of item difficulty, we plotted mean true and false positive rates for both RZ and CrI as a function of the P&P item difficulty parameters (see Figure 1). This plot reveals that mean false positive rates were well controlled (under the 5% nominal rate) except when item difficulty fell below−2.5 logits. Form−2.5 to −3.5 logits, false positive rate increased from 2% to 15% and from 3% to 20% forRZ and CrI, respectively. Con-versely, true positive rate was≥.80 between−1.5 and 2.0 logits for both procedures, though power for CrI was slightly higher.
Discussion
Bayesian methods have been widely used in IRT and have received considerable attention in DIF analysis. However, their application to detecting DIF between
CAT and conventional modes of administration has received relatively little attention. Thus, this study sought to develop and test methods for assessing CAT vs. P&P mode DIF employing a Bayesian framework. The present study revealed that the robust Z (RZ) and Bayesian credible interval (CrI) methods generally showed good control of false positive DIF results. Power as measured by the true-positive rate varied considerably for both methods but was consistent with previous reports [25-27]. The CrI method resulted in slightly higher power, but this was offset by a higher false posi-tive rate relaposi-tive to RZ. ROC analysis revealed that RZ significantly outperformedCrI, which appears mainly at-tributable to improved control of false positives. The results of the study indicate that neither RZ nor ΔCrI conform to a standard normal or similar distribution. In fact, RZ and particularly ΔCrI evidenced positive skew-ness and kurtosis. Thus, empirically derived cutoff values for each statistic may yield improved results. Neverthe-less, the use of conventional cutoff values (e.g., 1.96 for RZatα= .05) is not likely to increase Type I error.
CAT item usage was found to be the single best pre-dictor of detecting simulated mode effects, followed by absolute item difficulty. In fact, the multivariate model performed only slightly better than when CAT item usage was the only predictor. For items with DIF, those items administered most often by CAT were more likely to be detected than items administered less frequently. This is not surprising given the wide variability in the frequency that various items were administered during the CAT simulations. The frequency an item is adminis-tered by CAT could therefore form the basis of power analysis conducted prior to DIF analysis for a given item. This would be particularly useful in the context of on-going data collection, potentially improving power and minimizing analysis time.
There are two likely explanations for the observed re-lationship between absolute item difficulty and power in DIF detection. First, items with difficulty parameters closest to the mean theta values will be more likely to be administered by CAT. Since measures with mean trait levels of 0 or 1 logit were simulated, items in this range of difficulty would be most frequently administered. Sec-ond, items towards the extremes of the measurement continuum are less precisely estimated (i.e., have larger standard errors). Thus, power to detect DIF in items that are very easy or difficult to endorse is lower than that for items of average difficulty. This would likely explain why absolute item difficulty was a significant predictor of power even after controlling for CAT item usage. These findings may in part reflect the use of a fixed-length CAT during the simulation. In the case of a variable-length CAT, more items would likely be admi-nistered to simulees at the extremes of the trait
Table 4 Univariate and multivariate multilevel logistic regression to predict incorrect detection of mode effects defined by Robust Z and Bayesian 95% credible interval as a function of study variables
Model/Predictor Univariate Multivariate
OR AUCa OR 95%CI
Robust Z (Model AUC = 0.77)
Size of DIF 1.93** 0.55 2.01** (1.36,2.97)
Percentage of DIF 1.44 0.55 1.48 (0.99,2.20)
2PL IRT Model 1.14 0.52 0.96 (0.63,1.46)
Diff. Meanθ= 1.0 3.31** 0.59 3.95** (2.56,6.08)
CAT Item Usage 1.91** 0.54 4.17** (3.11,5.60)
Item Difficulty 0.28** 0.62 0.12** (0.08,0.19)
Item Discrimination 1.64** 0.56 1.23 (0.96,1.58)
Bayesian 95% Credible Interval (Model AUC = 0.74)
Size of DIF 1.62* 0.55 1.61** (1.20,2.15)
Percentage of DIF 1.33 0.53 1.30 (0.97,1.75)
2PL IRT Model 1.14 0.52 1.08 (0.80,1.47)
Diff. Meanθ= 1.0 1.28E+08** 0.62 4.01** (2.90,5.55)
CAT Item Usage 0.96 0.44 2.36** (1.82,3.06)
Item Difficulty 0.30** 0.65 0.16** (0.11,0.22)
Item Discrimination 1.19 0.51 1.02 (0.82,1.26)
continuum in order to achieve sufficient measurement precision, including items that are very easy or difficult to endorse. Conversely, we would expect fewer items to be administered to simulees who are in the center of the trait distribution under a variable-length CAT.
With respect to incorrect DIF decisions, easier-to-endorse items were more likely to be erroneously flagged than more difficult items. This finding is in contrast to Wang, Bradlow, Wainer and Muller [31] who found that unlike the standard Mantel-Haenszel test , a Bayesian approach did not result in elevated false positive errors for easy items. There are a number of differences be-tween the Wang, Bradlow, Wainer and Muller study and the present investigation that may account for the differ-ential findings. The former study did not examine DIF in CAT-administered items, employed a testlet model, and analyzed DIF using posterior p values. Further, in Wang, Bradlow, Wainer and Muller, Type I error was examined in the absence of DIF items. Conversely, the present study assessed Type I error (false positive DIF results) in which some DIF items were present, thus contaminating the estimated measures used in group matching. Research is clearly needed to determine the causes of elevated false positive rate for easy-to-endorse items. Two possible avenues of research in this area in-clude: (1) further examination of different priors for item parameters and their effect on DIF detection for easy-to-endorse items, and (2) an iterative process of identifying DIF items and then removing or appropriately weighting them in the estimation of person measures.
As might be expected, DIF magnitude (i.e., the differ-ence between CAT and P&P item parameters for a given
item) was significantly and positively related to power. The same was not true for the percentage of items with DIF in the item bank. The latter result suggests that the power to detect a single DIF item is not significantly affected by the presence of other DIF items in the bank which may "contaminate" the person measures.
The results of this study revealed a positive relation-ship between item discrimination and power to identify items with mode DIF. One possible explanation for this finding is that CAT using a 2PL model and maximum information item selection will tend to select items with higher discrimination parameters for administration. In other words, DIF in high discriminating items may be easier to detect because these items are administered more frequently in CAT. Yet the results of the multivari-ate logistic regression analysis failed to support this con-clusion. Item discrimination remained statistically significant even when controlling for CAT item usage. High item discrimination therefore appears to enhance power in mode-effect detection. This finding is corrobo-rated by previous DIF research examining the relation-ship of item discrimination to power using several analytic procedures [48,49]. Using the RZ procedure, item discrimination was positively associated with false DIF results at the univariate level, though this effect was no longer significant at the multivariate level. The latter findings partially confirmed previous studies that reported a positive relationship between item discrimin-ation and Type I error rate for uniform DIF [50,51].
For both RZ and CrI, power to detect DIF was lower in the 2PL condition. This appears to be related to some extent to CAT item usage. Though the number of items
administered to each simulee was the same across the two conditions, median CAT item usage was lower (Med=504) in the 2PL than in the 1PL (Med=586) con-dition. However, the logistic regression results indicate that IRT model remained significant even when CAT item usage was included in the model. Thus, CAT item usage may not completely explain why power was lower in the 2PL condition. Though these findings are based on a small number of replications per condition and need to be interpreted cautiously, the observed relation-ship between measurement model and power to detect mode effects warrants further exploration.
In addition to the effect of item parameters, false posi-tive DIF results were significantly associated with DIF size and mean difference in trait level between CAT and P&P administration modes. These effects likely reflect problems with the trait estimate used as the matching variable in the DIF analysis. Items with large DIF effects and mean differences in trait level between groups limit the effectiveness of matching, as has been observed in previous DIF studies [50-53]. These results highlight the need for careful sampling of respondents who complete each form of the instrument and assessment of trait-level differences prior to assessment of mode effects. The percentage of DIF items in the item bank was not associated with false DIF results. Though false positive rates were smaller in the 10% compared to the 30% DIF conditions, DIF percentage was not found to be signifi-cantly predictive of false positive DIF in either the uni-variate or multiuni-variate logistic regression models for either RZ or CrI. Note that due to the computational demands involved in estimating posterior distributions of parameters, we decided not to perform item purifica-tion in this simulapurifica-tion.
The strength of Monte Carlo simulation lies in its abil-ity to systematically vary several factors thought to affect identification of simulated effects. In this study, several factors were directly examined with respect to detection of mode-of-administration DIF, including DIF size, per-centage of DIF items, and mean difference in trait level between modes, item response model, and analytic pro-cedure. We also examined the effects of variables not part of the research design, including CAT item usage, item discrimination, and item difficulty parameters. A particular strength of the study is the examination of CAT item usage rather than sample size as a factor related to identification of DIF.
Nevertheless, our study has several limits. For ex-ample, several other factors were not considered in the simulation. Of particular importance is the degree to which the mean, variance, and shape of distributions of parameters are consistent with specified priors in the Bayesian estimation model. Though differences in mean trait levels were examined, deviations from prior
assumptions concerning parameter variances or distribu-tion types were not examined. For instance, there is a need to conduct further studies examining the potential effect of skewed theta and item parameter distributions on the performance of DIF procedures [24]. Methods of CAT item selection and stopping rules also deserve fur-ther attention. There is also a need to assess theRZand CrI procedures in identifying items exhibiting non-uniform mode DIF. Additional limitations of the present study include the small number of replications per ex-perimental condition, the use of a fixed-length CAT and fixed item bank size.
Also, we intentionally did not address non-uniform DIF. Thus limits our study to conclusions about uniform DIF only. Importantly, though, no theoretical reasons exist to preclude conducting similar analyses on non-uniform DIF. However, given the nascent status of re-search in this field, we choose to focus on a single type of DIF. Our future research will hopefully address non-uniform DIF in one study and both simultaneously in a final study. By addressing each in a stepwise and piece-meal fashion, we hope to avoid spurious conclusions that could arise by addressing all simultaneously in the initial study. For example, we did not want to the pres-ence of non-uniform to influpres-ence the detection of uni-form DIF using these methods we developed here. Final, we only used simulated data. Future studies employing these procedures with real data are also needed.
Conclusions
This study yielded mixed results concerning the meth-ods for assessing mode effects. Whereas Type I error was well controlled, power to detect DIF was subopti-mal, though the present findings were consistent with those reported in similar studies [25-27]. The modified robust Z test provided better control of the Type I error rate compared toCrI. True positive rates were primarily predicted by CAT item usage, absolute item difficulty and item discrimination. Further research is needed to examine the robustness of the method under varying prior assumptions concerning the distribution of item and person parameters and when data fail to conform to these prior assumptions. False identification of DIF when items were very easy to endorse is a problem requiring additional investigation.
Additional files
Additional file 1:Appendix A.Generating and Estimated Item Parameters for the Two Simulated Item Banks (Validation data) Based on the One-and Two-Parameter IRT Models, Respectively.
Additional file 2:Sample File of Simulee Measures Used to Generate CAT Item Responses.A 1 column x 3000 row of generatedθ values used to generate item responses for subsequent use in CAT simulation.
Additional file 3:Sample P&P and CAT Item Parameters.This file contains 4 columns of item parameters for 100 items. Columns 1 and 2 are the estimated discrimination and difficulty parameters for the P&P version of the instrument, respectively. Columns 3 and 4 are the discrimination and difficulty parameters used to generate the item responses for subsequent use in the CAT simulation.
Additional file 4:Sample Item Response File Used in CAT Simulation.A 100 column by 3000 row spreadsheet containing generated item responses according to the CAT person and item parameters described above. A 1 indicates a "no" response and 2 a "yes" response.
Additional file 5:Appendix B.WinBUGS Code.
Abbreviation
1PL: One-parameter logistic item response theory model; 2PL: Two-parameter logistic item response theory model; AUC: Area under the curve; CAT: Computerized adaptive testing;CrI: Credible interval; DIF: Differential item functioning; EB: Empirical Bayes; IQR: Interquartile range; IRT: Item response theory; MH: Mantel-Haenszel test; P&P: Paper-and-pencil (administration);RZ: Robust z test.
Competing interests
The authors declare that they have no competing interests.
Authors’contributions
BR conceived of the study, developed the procedures tested in the study, wrote the code for the simulation and performed the statistical analyses. BR and AC participated in the writing of the manuscript. BR wrote the background and methods sections, BR and AC wrote the results, discussion and conclusions sections. Both BR and AC reviewed drafts of the manuscript and gave final approval of the submitted version.
Acknowledgements
The development of this paper was supported by the National Institute on Drug Abuse (NIDA) under grant R21 DA 025371. NIDA had no direct role in the design of the study, analyses or interpretation of the study findings. The authors would like to thank Leanne Welch and Tim Feeney for their help proofreading the manuscript. Finally, the authors wish to thank the Research Open Access Publishing (ROAAP) Fund of the University of Illinois at Chicago for financial support toward the open access publishing fee for this article.
Author details
1Department of Health Systems Science, M/C 802, College of Nursing, University of Illinois at Chicago, 845 S. Damen Ave., Chicago, IL 60612, USA. 2University of Cincinnati School of Medicine, Cincinnati Children's Hospital Medical Center, 3333 Burnet Avenue, MLC 7014, Cincinnati, OH 45229, USA.
Received: 20 October 2011 Accepted: 31 July 2012 Published: 17 August 2012
References
1. Reeve BB:Special issues for building computerized-adaptive tests for measuring patient-reported outcomes: The National Institute of Health’s investment in new technology.Medical Care2006,
44(11 Supp 3):S198–S204.
2. Reeve BB, Hays RD, Bjorner JB, Cook KF, Crane PK, Teresi JA, Thissen D, Revicki DA, Weiss DJ, Hambleton RK,et al:Psychometric evaluation and calibration of health-related quality of life item banks: plans for the Patient-Reported Outcomes Measurement Information System (PROMIS). Medical Care2007,45(5 Suppl 1):S22–S31.
3. Schulenberg SE, Yutrzenka BA:The equivalence of computerized and paper-and-pencil psychological instruments: Implications for measures of negative affect.Behavioral Research Methods Instruments and Computers 1999,31:315–321.
4. Gwaltney CJ, Shields AL, Shiffman S:Equivalence of electronic and paper-and-pencil administration of patient-reported outcome measures: A meta-analytic review.Value Health2008,11(2):322–333.
5. Pommerich M:The effect of using item parameters calibrated from paper administrations in computer adaptive test administrations.Journal of Technology, Learning, and Assessment2007,5:1–29.
6. Zwick R, Thayer DT, Wingersky M:Effect of Rasch calibration on ability and DIF estimation in computer-adaptive tests.J Educ Meas1995,
32(4):341–363.
7. Holland PW, Thayer DT:Differential item functioning and the Mantel-Haenszel procedure. Evanston, IL: Educational Testing Service; 1986.
8. Dorans NJ, Kulick E:Demonstrating the utility of the standardization approach to assessing unexpected differential item performance on the Scholastic Apptitude Test.J Educ Meas1986,23(4):355–368.
9. Birnbaum A:Some latent trait models and their use in inferring an examinee's ability. InStatistical theories of mental tests scores. Edited by Lord FM, Novick MR, Reading MA.: Addison-Wesley; 1968:397–472. 10. Lord FM:Estimating true-score distributions in psychological testing (An
empirical Bayes estimation problem).Psychometrika1969,34(3):259–299. 11. Lord FM, Novick MR:Statistical theories of mental test scores. Reading, MA:
Addison-Wesley; 1968.
12. Rasch G:Probabilistic models for some intelligence and attainment tests. Copenhagen: Danmarks Paedogogiske Institut; 1960.
13. Pommerich M:Developing computerized versions of paper-and-pencil tests: Mode effects for passage-based tests.Journal of Technology, Learning, and Assessment2004,2(6):1–44.
14. Higgins J, Russell M, Hoffmann T:Examining the effect of computer-based passage presentation on reading test performance.Journal of Technology, Learning, and, Assessment2005,3(4):1–34.
15. Sandene B, Horkay N, Bennett R, Allen N, Braswell J, Kaplan B, Oranje A: Online assessment in mathematics and writing. InNAEP technology-based assessment project, research and development series (National Center for Education Statistics Publication No NCES 2005–457). Washington DC: U.S. Government Printing Office; 2005.
16. Johnson M, Green S:On-line mathematics assessment: The impact of mode on performance and question answering strategies.The Journal of Technology, Learning, and Assessment2006,4(5):1–35.
17. Keng L, McClarty KL, Davis LL:Item-level comparative analysis of online and paper administrations of the Texas Assessment of Knowledge and Skills.Appl Meas Educ2008,21(3):207–226.
18. Kim D, Huynh H:Comparability of computer and paper-and-pencil versions of algebra and biology assessments.Journal of Technology, Learning and Assessment2007,6(4):1–31.
19. Robitzsch A, Rupp AA:Impact of missing data on the detection of differential item functioning: The case of Mantel-Haenszel and logistic regression analysis.Educ Psychol Meas2008,69(1):18–34.
20. Zhang B, Walker CM:Impact of missing data on person model fit and person trait estimation.Appl Psychol Meas2008,32(6):466–479. 21. Gershon RC:Computer adaptive testing.J Appl Meas2005,6(1):109–127. 22. Jenkinson C, Fitzpatrick R, Garratt A, Peto V, Stewart-Brown S:Can item response theory reduce patient burden when measuring health status in neurological disorders? Results from Rasch analysis of the SF-36 physical functioning scale (PF-10).J Neurol Neurosurg Psychiatry2001, 71(2):220–224.
23. Riley BB, Conrad KJ, Bezruczko N, Dennis ML:Relative precision, efficiency and construct validity of different starting and stopping rules for a computerized adaptive test: The GAIN Substance Problem Scale.J Appl Meas2007,8(1):48–65.
24. Mantel N, Haenszel W:Statistical aspects of the analysis of data from retrospective studies.J Natl Cancer Inst1959,22(4):719–748.
25. Zwick R, Thayer DT:An empirical Bayes approach to Mantel-Haenszel DIF analysis.J Educ Meas1999,36(1):1–28.
26. Zwick R, Thayer DT:Application of an empirical Bayes enhancement of Mantel-Haenszel differential item functioning analysis to a computerized adaptive test.Appl Psychol Meas2002,26(1):57–76.
27. Zwick R, Thayer DT:An empirical Bayes enhancement of Mantel-Haenszel DIF analysis for computer-adaptive tests. Newton, PA USA: Law School Admission Council; 2003.
29. Glickman ME, Seal P, Eisen SV:A non-parametric Bayesian diagnostic for detecting differential item functioning in IRT models.Health Services and Outcomes Research Methodology2009,9(3):145–161.
30. Soares TM, Goncalves FB, Gamerman D:An integrated Bayesian model for DIF analysis.J Educ Behav Stat2009,34(3):348–377.
31. Wang X, Bradlow E, Wainer H, Muller E:A Bayesian method for studying DIF: A cautionary tale filled with surprises and delights.J Educ Behav Stat 2008,33(3):363–384.
32. Huynh H, Meyer P:Use of robust z in detecting unstable items in item response theory models.Practical Assessment Research & Evaluation2010, 15(2):1–8.
33. Patz RJ, Junker BW:Applications and extensions of MCMC in IRT: Multiple item types, missing data, and rated responses.J Educ Behav Stat1999, 24(4):342–366.
34. Patz RJ, Junker BW:A straightforward approach to Markov chain Monte Carlo methods for item response models.J Educ Behav Stat1999, 24(2):146–178.
35. Sahu SK:Bayesian estimation and model choice in item response models.J Stat Comput Simul2002,72:217–232.
36. Hambleton RK, Jones RW, Rogers HJ:Influence of item parameter estimation errors in test development.J Educ Meas1993,30(2):143–155. 37. Hulin CL, Lissak RI, Drasgow F:Recovery of two- and three-parameter
logistic item characteristic curves: A monte carlo study.Appl Psychol Meas 1982,6(3):249–260.
38. Kang T, Cohen AS:IRT model selection methods for dichotomous items. Appl Psychol Meas2007,31(4):331–358.
39. Stone CA:Recovery of marginal maximum likelihood estimates in the two-parameter logistic response model: An evaluation of MULTILOG. Appl Psychol Meas1992,16(1):1–16.
40. Zwick R, Thayer DT, Wingersky M:A simulation study of methods for assessing differential item functioning in computerized adaptive tests. Appl Psychol Meas1994,18(1):121–140.
41. DeLong ER, DeLong DM, Clarke-Pearson DL:Comparing the areas under two or more correlated receiver operating characteristic curves: A nonparametric approach.Biometrics1988,44(3):837–845. 42. Gelman A:Scaling regression inputs by dividing by two standard
deviations.Stat Med2008,27(15):2865–2873.
43. R Development Core Team: R:R Development Core Team. InStatistical programming language. 212th edition. 2011.
44. Muthén LK:Mplus. 60th edition. Los Angeles, CA: Muthén & Muthén; 2010. 45. Choi SW:Firestar: Computerized adaptive testing simulation program for
polytomous IRT models.Appl Psychol Meas2009,33(8):644–645. 46. Spiegelhalter D, Thomas A, Best N, Lunn D:WinBUGS version 1.4. 3 user
manual. Cambridge, United Kingdom: MRC Biostatistics Unit; 2007. 47. Gelman A, Sturtz S, Ligges U, Gorjanc G, Kerman J:The R2WinBUGS Package
Manual Version 2.0-4. New York: Statistic Department Faculty; 2006. 48. Kristjansson E, Aylesworth R, Mcdowell I, Zumbo BD:A comparison of four
methods for detecting differential item functioning in ordered response items.Educ Psychol Meas2005,65:935–953.
49. Zwick R, Donoghue JR, Grima A:Assessment of differential item functioning for performance tasks.J Educ Meas1993,30:233–251. 50. Ankenmann RD, Witt EA, Dunbar SB:An investigation of the power of the
likelihood ratio goodness-of-fit statistic in detecting differential item functioning.J Educ Meas1999,36(4):277–300.
51. Roussos LA, Stout WF:Simulation studies of the effects of small sample size and studied item parameters on SIBTEST and Mantel-Haenszel Type I error performance.J Educ Meas1996,33(2):215–230.
52. Zwick R, Thayer DT, Mazzeo J:Descriptive and inferrential procedures for assessing differential item functioning in polytomous items.Appl Meas Educ1997,10(4):321–344.
53. Jodoin MG, Gierl MJ:Evaluating type I error and power rates using an effect size measure with the logistic regression procedure for DIF detection.Appl Meas Educ2001,14:329–349.
doi:10.1186/1471-2288-12-124
Cite this article as:Riley and Carle:Comparison of two Bayesian methods to detect mode effects between paper-based and computerized adaptive assessments: a preliminary Monte Carlo study.
BMC Medical Research Methodology201212:124.
Submit your next manuscript to BioMed Central and take full advantage of:
• Convenient online submission
• Thorough peer review
• No space constraints or color figure charges
• Immediate publication on acceptance
• Inclusion in PubMed, CAS, Scopus and Google Scholar
• Research which is freely available for redistribution