Open Access
Research article
The ChromaTest, a digital color contrast sensitivity analyzer, for
diabetic maculopathy: a pilot study
Roger Wong*, Jaheed Khan, Temi Adewoyin, Sobha Sivaprasad,
Geoffrey B Arden and Victor Chong
Address: Retinal Research Unit, Ophthalmology Department, King's College Hospital NHS Trust, Denmark Hill, London SE5 9RS, UK Email: Roger Wong* - drrogerwong@gmail.com; Jaheed Khan - jaheedkhan@yahoo.co.uk; Temi Adewoyin - telade@yahoo.co.uk; Sobha Sivaprasad - sobhasiva@hotmail.com; Geoffrey B Arden - g.arden@city.org.uk; Victor Chong - victor.chong@kingsch.uk * Corresponding author
Abstract
Background: To assess the ability of the Chromatest in investigating diabetic maculopathy.
Method: Patients with Type 2 diabetes and no concurrent ocular pathology or previous laser photocoagulation were recruited. Visual acuities were assessed followed by colour contrast sensitivity testing of each eye using Chromatest. Dilated fundoscopy with slit lamp biomicroscopy with 78 D lens was then performed to confirm the stage of diabetic retinopathy according to the Early Treatment Diabetic Retinopathy Study.
Results: 150 eyes in 150 patients were recruited into this study. 35 eyes with no previous laser photocoagulation were shown to have clinically significant macular oedema (CSMO) and 115 eyes with untreated non-proliferative diabetic retinopathy (NPDR) on fundus biomicroscopy. Statistical significant difference was found between CSMO and NPDR eyes for protan colour contrast threshold (p = 0.01). Statistical significance was found between CSMO and NPDR eyes for tritan colour contrast threshold (p = 0.0002). Sensitivity and specificity for screening of CSMO using pass-fail criterion for age matched TCCT results achieved 71% (95% confidence interval: 53–85%) and 70% (95% confidence interval: 60–78%), respectively. However, threshold levels were derived using the same data set for both training and testing the effectiveness since this was the first study of NPDR using the Chromatest
Conclusion: The ChromaTest is a simple, cheap, easy to use, and quick test for colour contrast sensitivity. This study did not achieve results to justify use of the Chromatest for screening, but it reinforced the changes seen in tritan colour vision in diabetic retinopathy.
Background
The debilitating nature of untreated diabetic retinopathy promotes the need for cost-effective screening methods. Various studies have shown that cost effective screening can reduce blind registration due to diabetes [1-3]. Although seven field 30 degree stereo colour fundus
pho-tographs are the gold standard for diabetic screening, both remain relatively expensive and difficult to obtain [4,5]. In the UK, the National Screening Program for Diabetic Retinopathy utilises non-stereo digital photography as this meets the Diabetes UK standards for sensitivity and specificity.
Published: 17 August 2008
BMC Ophthalmology 2008, 8:15 doi:10.1186/1471-2415-8-15
Received: 30 June 2007 Accepted: 17 August 2008
This article is available from: http://www.biomedcentral.com/1471-2415/8/15
© 2008 Wong et al; licensee BioMed Central Ltd.
Non-stereo fundus imaging is easier to obtain but has lim-itations in establishing macular oedema [6]. There is evi-dence that tritan colour vision is diminished in patients with diabetic maculopathy, but testing with the FM100 hue and Farnsworth-Lanthony D-15 test are labour inten-sive and time consuming [7]. Colour vision testing with a computer graphics system is an effective alternative [8]. This study assesses the ability of an automated, digital col-our contrast sensitivity program in investigating diabetic maculopathy.
Methods
Patients from either the Diabetic Eye Screening Service or patients returning for their follow-up appointment in the Medical Retina Service were recruited for this study. Inclu-sion criteria included Type 2 diabetic patients with untreated non-proliferative diabetic retinopathy (NPDR) and untreated clinically significant macular oedema (CSMO). Exclusion criteria included Type 1 diabetes, pro-liferative diabetic retinopathy, previous laser photocoagu-lation, and concurrent ocular pathology including infection, trauma, amblyopia, glaucoma, and/or vascular occlusion.
Medical history including duration of diabetes, hyperten-sion, renal disease, recent HbA1c, and smoking were recorded. Concurrent eye disease and previous treatment were also recorded. Examination of best corrected logMar visual acuities (BCVA) was followed by colour contrast sensitivity testing of each eye by occluding the fellow eye and using the diabetic module of ChromaTest, a software program analyzing the age-corrected tritan (TCCT) and protan color contrast thresholds (PCCT). A brief explana-tion of what the patient is expected to see and their expected response was made prior to the test. The right eye was tested first followed by the left.
For the Chromatest, the subject is seated at a fixed distance from the monitor so the alphabetical letter displayed on the computer screen subtends a constant angle on the ret-ina. The letter size creates an image that tests the central 6.5 degrees of the retina. The letters are displayed on a background of equiluminance. The operator has no influ-ence on the contrast of the test letter given. The computer finds the endpoint of the test by a Modified Binary Search method; if response is correct, on the next presentation the colour difference between letter and background is halved. If response is incorrect, the colour -contrast is dou-bled. Incorrect responses prolong the test, but do not influence the final threshold. This method of determining thresholds leads to finite steps which reach a plateau at the colour contrast sensitivity threshold. The reproduci-bility of this measurement is 1%, which is the sensitivity of the test. The Chromatest has been further described in various articles [8-10]. Control data was obtained from
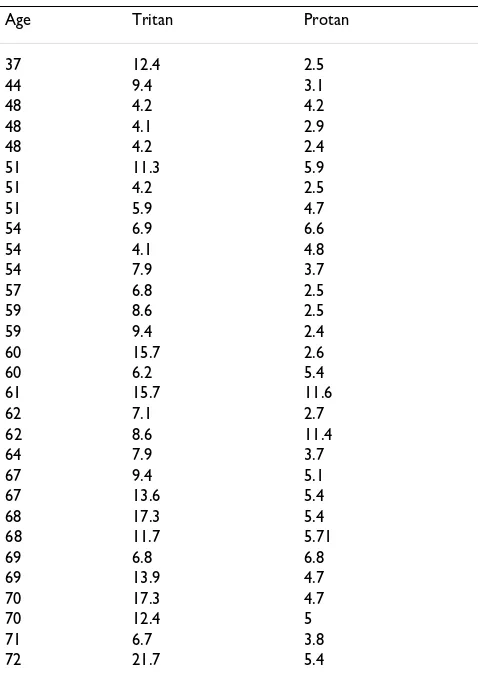
unpublished data collected by G.B. Arden from diabetic patients without any diabetic retinopathy prior to this study (Table 1). Test and training sets are both from the group studied in this report.
Dilated fundoscopy with slit lamp biomicroscopy and 78 D lens was performed by a specialist registrar (RW) to con-firm the grading of CSMO according to the Early Treat-ment Diabetic Retinopathy Study extension of the modified Airlie House classification [11]. CSMO is defined as any retinal thickening within 500 microns of the centre of the fovea; hard, yellow exudates within 500 microns of the centre of the fovea with adjacent retinal thickening; or at least 1 disc area of retinal thickening, any part of which is within 1 disc are of the centre of the fovea.
Each age group (eg. 30–49 years old, 50–69, 70–89) sep-arated by 2 decades was assigned pass-fail criterion for TCCT as previous data suggests age related change in threshold for tritan colour. Since this is the first study of NPDR using the Chromatest, threshold levels were derived using the same data set for both training and
test-Table 1: Colour Contrast Sensitivity in Patients with Diabetes and No Clinical Retinopathy (N = 30)
Age Tritan Protan
37 12.4 2.5
44 9.4 3.1
48 4.2 4.2
48 4.1 2.9
48 4.2 2.4
51 11.3 5.9
51 4.2 2.5
51 5.9 4.7
54 6.9 6.6
54 4.1 4.8
54 7.9 3.7
57 6.8 2.5
59 8.6 2.5
59 9.4 2.4
60 15.7 2.6
60 6.2 5.4
61 15.7 11.6
62 7.1 2.7
62 8.6 11.4
64 7.9 3.7
67 9.4 5.1
67 13.6 5.4
68 17.3 5.4
68 11.7 5.71
69 6.8 6.8
69 13.9 4.7
70 17.3 4.7
70 12.4 5
71 6.7 3.8
72 21.7 5.4
ing the effectiveness. Pass-fail criterion for each age group was chosen piecewise and sensitivity/specificity calcula-tions were made according to these arbitrarily assigned levels.
Sensitivity, specificity, confidence intervals, and χ2 test were
calculated by web-based statistical calculator made availa-ble by Professor Lowry at Vassar College, New York http:// faculty.vassar.edu/lowry/VassarStats.html. Wilcoxon Rank Sum Test for non-parametric statistical analysis was per-formed using web software http://www.fon.hum.uva.nl/ Service/Statistics/Wilcoxon_Test.html.
Results
150 eyes of 150 patients were included in this study. Of the 150 eyes, 115 eyes had untreated NPDR (Table 2) and 35 eyes had untreated CSMO (Table 3). Median age was 60 years. Median duration of diabetes was 16.0 years.
Median LogMar BCVA for NPDR patients was 0.20 and for CSMO patients was 0.20. Interquartile range for VA NPDR and CSMO was 0.20 and 0.30, respectively. Median PCCT for NPDR was 3.9% and for CSMO patients was 5.6%. Wilcoxon Rank Sum Test analysis revealed statistical sig-nificant difference between CSMO and NPDR eyes for PCCT (p = 0.01). When compared to controls with sample size N = 30 (Table 1), PCCT for NPDR had no statistical significance (p = 0.15) whereas PCCT for CSMO was sig-nificant (p = 0.002). Median TCCT for NPDR was 15.4% and for CSME patients was 29.6%. Statistical significance was found between CSMO and NPDR eyes for TCCT (p = 0.0002). Both were also statistically significant when com-pared to controls (p < 0.001)
The piecewise pass/fail criterion for TCCT for each age group was as follows: 11.0 (30–49 year old); 23.0 (50–69 year old); 32.0 (70–89 year old). Sensitivity and specifi-city for screening of CSMO using the above pass-fail crite-rion for age matched TCCT results achieved 71% (95% confidence interval: 53–85%) and 70% (95% confidence interval: 60–78%), respectively (Table 4).
When repeating the analysis in Table 4 for only subjects with logMar BCVA > = 0.1, sensitivity to detect CSMO improves to 75% (CI: 47–91%) and specificity to 85% (CI: 67–89%) p = 0.0002. Similarly, when repeating the analysis in Table 4 for only subjects with CSMO with cen-tral macular thickening, sensitivity to detect CSMO improves to 83.3% (CI: 58–96%) p < 0.0001.
Discussion
Cost effective screening for chronic and debilitating disor-ders such as diabetic retinopathy is not only important to the well being of the patient, but these healthy adults con-tribute to the economy of a nation. With the rise in type 2
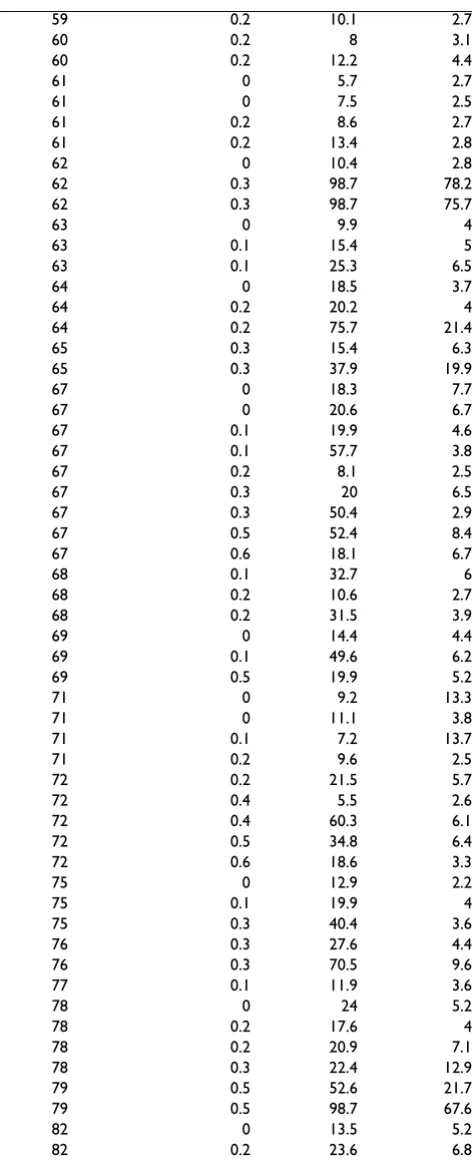
Table 2: Colour Contrast Sensitivity in Patients with NPDR (N = 115)
Age Log Mar VA Tritan Protan
31 0 13.6 3.4
32 0 5.2 3.2
32 0 6.7 2
32 0.2 15.4 3.2
41 0 16.1 15.4
41 0 6.1 2.1
41 0 6.2 2.1
41 0 6 1.7
41 0 8.4 3.9
42 0 11.4 3
44 0.2 9.6 4.8
44 0.2 13.3 8.1
45 0.2 16.1 4.2
45 0.2 22.1 5.5
45 0.4 19.9 5.8
48 0 5.6 2.9
48 0.5 20.6 3.8
48 0.6 29.5 5
49 0 7.4 3.4
49 0 6.3 2.2
49 0 8.4 3.9
49 0 8.4 2.6
49 0 9.4 3.1
49 0 9.9 3.4
49 0 10.3 2.9
49 0 30.5 6.1
49 0 34.5 4
49 0.1 33.6 6
49 0.7 9.2 2.6
49 0.7 12.2 3.6
51 0 13.6 4.4
51 0.1 18 5.8
51 0.2 19.1 7
52 0 10.8 2.6
52 0.2 82.4 9.3
54 0 9 3.1
54 0 22.1 4.6
54 0.2 23.6 4.3
55 0 14.4 3.1
55 0 20.2 5.4
55 0.2 18.4 3.5
55 0.2 17.6 2.1
55 0.3 19.6 4.4
55 0.3 85.9 7.7
55 0.4 22.1 7.7
56 0 8.1 2.7
56 0 11.1 2.5
56 0.1 6.6 2.6
57 0 10.3 3.6
57 0.1 6.7 2.9
57 0.1 7.2 2.1
57 0.2 14.9 2.9
58 0.1 13.9 3.8
58 0.2 11 3.3
58 0.2 21.4 2.8
58 0.2 38 3.8
59 0.2 6.8 2.1
diabetes in obese adolescents due to dietary and lifestyle changes, the need for an optimal method of screening for sight threatening diabetic retinopathy becomes a critical essential [12].
Abnormal protan and especially tritan colour vision is associated with diabetic retinopathy [13]. Blue-yellow defect has also been described in both diabetic retinopa-thy and glaucoma [14]. In contrast to the optotype used for testing macular function, the Chromatest has a sepa-rate glaucoma module for which it is designed to measure peripheral colour sensitivity changes in an arcuate man-ner using a central fixation point. This study did not cross examine patients with glaucoma and diabetic retinopathy using both glaucoma and macular modules, but it is fea-sible that further testing may reveal an overlap in colour defect for these patients. Although the mechanism of altered colour vision is unknown, there is evidence that reduced retinal oxygen saturation is associated with impaired colour vision in diabetics [15]. Error scores in colour vision have been found to be directly correlated to severity of macular oedema [16]. This may be similar to the effects of retinal detachment where photoreceptors are shifted obliquely [16]. Correlation between selective loss of short wavelength pathway sensitivity and the severity of diabetic macular oedema has been demonstrated [17,18]. Therefore, we have concentrated on the study of untreated CSMO to ascertain the viability of such a screening method. The use of smaller letters (1.5 degree; Chromat-est module for age related macular degeneration) might give better results for CSMO as it may test macular func-tion better than the larger 6.5 degree optotype.
This study included only patients with type 2 diabetes to reduce the possible variability in pathogenesis. Although the mechanism of diabetic retinopathy is likely to be iden-tical in both type 1 and type 2 diabetes, previous studies such as the Early Treatment Diabetic Retinopathy Study and Diabetic Retinopathy Study have investigated each type of diabetes separately. Laser photocoagulation was an exclusion criterion as it affects tritan colour vision [19]. Cataract and pseudophakia were not excluded as both are more common in diabetics and exclusion would have limited the usefulness of the Chromatest in screening. It is understood that lens-yellowing effects due to cataract may cause pre-retinal absorption of short-wavelength light resulting in tritan deficits. This may have influenced the overall sensitivity and specificity of the study, but it was a representation of the realistic setting clinicians experience in their practice.
In colour contrast testing, the higher the TCCT or PCCT score, the more abnormal the result compared to age-matched normal levels. 30% (35 of 115) patients with NPDR had TCCT above normal levels. 12 male patients
were suspected to have congenital colour blindness as their PCCT were considerably worse than normal and not
59 0.2 10.1 2.7
60 0.2 8 3.1
60 0.2 12.2 4.4
61 0 5.7 2.7
61 0 7.5 2.5
61 0.2 8.6 2.7
61 0.2 13.4 2.8
62 0 10.4 2.8
62 0.3 98.7 78.2
62 0.3 98.7 75.7
63 0 9.9 4
63 0.1 15.4 5
63 0.1 25.3 6.5
64 0 18.5 3.7
64 0.2 20.2 4
64 0.2 75.7 21.4
65 0.3 15.4 6.3
65 0.3 37.9 19.9
67 0 18.3 7.7
67 0 20.6 6.7
67 0.1 19.9 4.6
67 0.1 57.7 3.8
67 0.2 8.1 2.5
67 0.3 20 6.5
67 0.3 50.4 2.9
67 0.5 52.4 8.4
67 0.6 18.1 6.7
68 0.1 32.7 6
68 0.2 10.6 2.7
68 0.2 31.5 3.9
69 0 14.4 4.4
69 0.1 49.6 6.2
69 0.5 19.9 5.2
71 0 9.2 13.3
71 0 11.1 3.8
71 0.1 7.2 13.7
71 0.2 9.6 2.5
72 0.2 21.5 5.7
72 0.4 5.5 2.6
72 0.4 60.3 6.1
72 0.5 34.8 6.4
72 0.6 18.6 3.3
75 0 12.9 2.2
75 0.1 19.9 4
75 0.3 40.4 3.6
76 0.3 27.6 4.4
76 0.3 70.5 9.6
77 0.1 11.9 3.6
78 0 24 5.2
78 0.2 17.6 4
78 0.2 20.9 7.1
78 0.3 22.4 12.9
79 0.5 52.6 21.7
79 0.5 98.7 67.6
82 0 13.5 5.2
82 0.2 23.6 6.8
NPDR patients: Age, VA, TCCT, PCCT
corresponding to their visual acuity or their fundus appearance. This was not confirmed with any other mode of investigation as the study was aimed at mimicking real-istic clinical setting where high volume testing can be con-ducted without further time consuming tests. 16 cases had severe NPDR and may have contributed to the poor results whereas the remaining 7 had results not
corre-sponding to their fundus appearance. We postulate that these 7 eyes may have had concurrent disease indistin-guishable by indirect biomicroscopy such as more advanced ischaemia. Ultimately, fluorescein angiography may have further elucidated the true pathology.
29% (10 of 35) CSMO patients had TCCT better than nor-mal levels. 8 eyes had CSMO qualified as 1 disc area of ret-inal thickening within 1 disc area of the fovea. 2 eyes had exudates with associated retinal thickening within 500 microns of the fovea, but both were left eyes and it is pos-sible that the patients were able to perform educated guesses because they had been conditioned following test-ing with their right eye.
Unfortunately, we were forced to obtain normal threshold levels through the same dataset. These levels were obtained through analysis of cases without CSMO. There-fore, the results may be biased. However, because this device is relatively new and the limited availability of fur-ther data from diabetics, we are limited to using this data-set to obtain "normal" threshold values. Further data will strengthen our case of the power of this diagnostic tool.
The Chromatest is unable to successfully screen those patients with congenital blindness and performs less well for patients without foveal pathology. Conditioning fol-lowing testing with the right eye may also allow patients to perform better on their left eye. From anecdotal evi-dence, time for testing of the second eye was observed by the investigators to be shorter than the first eye. Repeated testing which was not done in our study may alleviate this problem. This study has studied more untreated CSMO eyes with colour vision than any other that have been published, but it requires more data to solidify our find-ings. Colour contrast analysis may become a useful tool for defining the need for laser treatment, but so far our experience fails the Exeter Standards of the British Dia-betic Association (Diabetes UK), which established screening levels of at least 80% sensitivity and 95% specif-icity [20].
Despite the limitations of the results, there was no dis-crimination for age and visual acuity due to the ease of the test. All patients were able to perform this test unlike the 1.5% of patients failing to perform another automated TCCT test [21]. Average test time was fast at 5 minutes and requires no mydriasis unlike fluorescein angiography and fundus photography. Conditioning after repeated testing is an issue for reliability, but this study was aimed at mim-icking realistic clinical settings where patients have no experience of colour contrast testing. Further studies to distinguish repeatability and data for classifying normal results from abnormals are planned. The equipment required is relatively cheap and readily available
com-Table 3: Colour Contrast Sensitivity in Patients with CSMO (N = 35)
Age LogMar VA Tritan Protan
31 0 8.5 3.6
31 0 11.1 4
42 0.2 14.1 4.5
44 0 7 1.9
44 0 18.8 2.6
51 0.2 8.8 2.6
52 0 29.6 3.5
52 0.3 72.3 10.7
55 0.2 18.4 3.5
56 0.3 18.4 2.9
56 0.5 36 5.6
58 0.1 7.7 2.7
58 0.3 78.2 13.7
59 0.2 23.6 3
62 0 70.5 7.7
62 0.1 49.9 11.4
63 0.4 27.3 6.7
65 0.1 85.9 14.4
65 0.3 98.7 16.9
67 0.1 16.1 3.2
67 0.2 11.8 3
67 0.3 80.8 12.4
68 0.2 13.3 3.2
69 0.1 23.3 5.3
69 0.5 30.3 16.1
70 0 21.5 6.8
70 0 35.4 5.6
70 0 32.7 5.5
70 0 62.8 9
70 0.5 98.7 20.8
71 0 98.7 14.7
71 0.2 64.8 20
71 0.3 98.7 42.3
72 0.7 68 18.4
72 0.9 57.7 16.9
CSMO patients: Age, VA, TCCT, PCCT
Table 4: χ2 test for TCCT detection of CSMO
True Positive True Negative Total
Test Positive 25 35 60
Test Negative 10 80 90
Total 35 115 150
pared to those required for optical coherence tomography or stereomacular photographs. It is also a non-invasive procedure and less labour intensive compared to fluores-cein angiography.
Conclusion
Non-ophthalmic doctors can have a retinopathy detection rate of 49% compared to 96% for ophthalmologists [22]. Therefore, a cost effective method for screening is essential for diabetic retinopathy. Screening by digital photography proposed under the National Service Framework is offered to all patients with diabetes in the United King-dom. It is supplemented by biomicroscopy by the oph-thalmologists in monitoring and treating sight threatening disease. Furthermore, optical coherence tom-ography has become a powerful tool in screening and monitoring CSMO with sensitivity and specificity rates of near 80% and 90%, respectively [23]. Perhaps with fur-ther investigation, TCCT testing may become a supple-ment for detecting and monitoring sight threatening pathology without much equipment or trained techni-cians. However, with current data, all forms of TCCT test-ing includtest-ing the Chromatest do not qualify for use in screening for CSMO.
Competing interests
The authors declare that they have no competing interests.
Authors' contributions
RW examined patients, conducted investigation, con-ceived, drafted the manuscript. TA performed the statisti-cal analysis. JK compiled patient list and conducted investigation. SS compiled patient list and conducted investigation. GA performed the statistical analysis. VC conceived of the study, and participated in its design and coordination. All authors read and approved the final manuscript.
Acknowledgements
No funding was obtained for this study.
References
1. Rohan TE, Frost CD, Wald J: Prevention of blindness by screen-ing for diabetic retinopathy; a quantitative assessment. Brit Med J 1989, 299:1198-201.
2. Olafsdóttir E, Stefánsson E: Biennial eye screening in patients with diabetes without retinopathy: 10-year experience. Br J Ophthalmol 2007, 91:1599-601.
3. Whited JD, Datta SK, Aiello LM, et al.: A modeled economic anal-ysis of a digital tele-ophthalmology system as used by three federal health care agencies for detecting proliferative dia-betic retinopathy. Telemed J E Health 2005, 11:641-51.
4. Singer DE, Nathan DM, Fogel HA, et al.: Screening for diabetic retinopathy. Ann Intern Med 1991, 116:660-71.
5. Moss S, Meuer SM, Klen R, et al.: Are seven standard photo-graphic fields necessary for classification of diabetic retinop-athy? Invest Ophthalmol Vis Sci 1989, 30:823-8.
6. Harding SP, Broadbent DM, Neoh C, et al.: Sensitivity and specifi-city of photography and direct ophthalmoscopy in screening for sight threatening eye disease: the Liverpool diabetic eye study. Brit Med J 1995, 311:1131-5.
7. Bresnick GH, Condit R, Palta M, et al.: Association of hue-discrim-ination loss and diabetic retinopathy. Arch Ophthalmol 1985,
103:1317-24.
8. Arden GB, Gunduz K, Perry S: Colour vision testing with a com-puter graphics system. Clin Vis Sci 1988, 2:303-20.
9. Arden GB: Testing contrast sensitivity in clinical practice. Clin Vis Sci 1987, 2:213-24.
10. Arden GB, Gunduz K, Perry S: Colour vision testing with a com-puter graphics system; preliminary results. Doc Ophthalmol
1988, 69(2):167-174.
11. ETDRS Research Group: Grading diabetic retinopathy from stereoscopic color fundus photographs-an extension of the modified Airlie house classification: ETDRS reprot number 10. Ophthalmology 1991, 98:786-806.
12. Caprio S, Tamborlane WV: Metabolic impact of obesity in child-hood. Endocrinology & Metabolism Clinics of North America 1999,
28(4):731-47.
13. Treager SD, Knowles PI, De Alwys DV, Reffin JP, Ripley LG, Casswell AG: Colour vision deficits predict the development of sight-threatening disease with background retinopathy. Invest Oph-thalmol Vis Sci 1993, 34:719. (ARVO Abstracts no 81)
14. Nitta K, Saito Y, Kobayashi A, Sugiyama K: Influence of clinical fac-tors on blue-on-yellow perimetry for diabetic patients with-out retinopathy: comparison with white-on-white perimetry. Retina 2006, 26:797-802.
15. Dean FM, Arden GB, Dornhorst A: Partial reversal of protan and tritan colour vision defects with inhaled oxygen in insulin dependent diabetic patients. Br J Ophthalmol 1997, 81:27-30. 16. Verriest G, van Laethem J, Uvijls A: A new assessment of the
nor-mal ranges of Farnsworth-Munsell 100-Hue Test scores. Am J Ophthalmol 1982, 93:635-42.
17. Ueda M, Adachi-Usami E: Assessment of central visual function after successful retinal detachment surgery by pattern visual evoked cortical potential. Br J Ophthalmol 1992, 76:482-485. 18. Greenstein VC, Sarter B, Hood D, et al.: Hue discrimination and
S cone pathway sensitivity in early diabetic retinopathy. Invest Ophthalmol Vis Sci 1990, 31:1008-1014.
19. Ulbig MR, Arden GB, Hamilton AM: Color contrast sensitivity and pattern electroretinographic findings after diode and argon laser photocoagulation in diabetic retinopathy. Am J Ophthalmol 1994, 117:583-588.
20. British Diabetic Association: Retinal photography screening for diabetic eye disease. London: British Diabetic Association Report; 1997.
21. Ong GL, Ripley LG, Newsom RSB, Casswell AG: Assessment of colour vision as a screening test for sight threatening dia-betic retinopathy before loss of vision. Br J Ophthalmol 2003,
87:747-752.
22. Sussman Ej, Tsiaras WG, Soper KA: Diagnosis of diabetic eye dis-ease. JAMA 1982, 247:3231-3234.
23. Virgili G, Menchini F, Dimastrogiovanni AF, Rapizzi E, Menchini U, Bandello F, Chiodini RG: Optical coherence tomography versus stereoscopic fundus photography or biomicroscopy for diag-nosing diabetic macular edema: a systematic review. Invest Ophthalmol Vis Sci 2007, 48:4963-73.
Pre-publication history
The pre-publication history for this paper can be accessed here: