R E S E A R C H A R T I C L E
Open Access
Potential diagnostic biomarkers for chronic
kidney disease of unknown etiology (CKDu)
in Sri Lanka: a pilot study
Saravanabavan Sayanthooran
1, Dhammika N. Magana-Arachchi
1*, Lishanthe Gunerathne
2and Tilak Abeysekera
3Abstract
Background:In Sri Lanka, there exists chronic kidney disease of both known (CKD) and unknown etiologies (CKDu). Identification of novel biomarkers that are customized to the specific causative factors would lead to early diagnosis and clearer prognosis of the diseases. This study aimed to find genetic biomarkers in blood to distinguish and identify CKDu from CKD as well as healthy populations from CKDu endemic and non-endemic areas of Sri Lanka. Methods:The expression patterns of a selected panel of 12 potential genetic biomarkers were analyzed in blood using RT-qPCR. Fold changes of gene expressions in early and late stages of CKD and CKDu patients, and an apparently healthy population of a CKDu endemic area, Girandurukotte (GH) were calculated relative to apparently healthy volunteers from a CKDu non-endemic area, Kandy (KH) of Sri Lanka, using the comparative CT method. Results:Significant differences were observed between KH and early stage CKDu for both the insulin-like growth factor binding protein 1 (IGFBP1;p= 0.012) and kidney injury molecule-1 (KIM1;p= 0.003) genes, and KH and late stage CKD and CKDu for the glutathione-S-transferase mu 1 (GSTM1;p< 0.05) gene. IGFBP1 and KIM1 genes showed significant difference between the early and late stage CKDu (p< 0.01). The glutamate cysteine ligase catalytic subunit (GCLC) gene had significantly different expression between KH and all the other study groups (p< 0.01). The GH group was significantly different from the KH group for the oxidative stress related genes, G6PD, GCLC and GSTM1 (p< 0.01), and also the KIM1 gene (p= 0.003). IGFBP1, insulin-like growth factor binding protein 3 (IGFBP3), fibronectin 1 (FN1) and KIM1 showed significant correlations with serum creatinine, and IGFBP1, KIM1 and kallikrein 1 (KLK1) with eGFR (p< 0.05).
Conclusion:A panel consisting of IGFBP1, KIM1, GCLC and GSTM1 genes could be used in combination for early screening of CKDu, whereas these genes in addition with FN1, IGFBP3 and KLK1 could be used to monitor progression of CKDu. The regulation of these genes has to be studied on larger populations to validate their efficiency for further clinical use.
Keywords:Gene expression analysis, Kidney injury, Oxidative stress, RT-qPCR
Background
Chronic kidney disease (CKD) is increasing rapidly worldwide and is gaining much attention in both the developed as well as developing countries. CKD is char-acterized by a reduced glomerular filtration rate (GFR) that is accompanied with structural or functional
abnormalities of the kidneys on urinalysis, biopsy and imaging [1].
The concept of biomarker discovery in medicine is be-coming increasingly important due to its potential for early screening, more effective treatment and a more personalized approach to medical care [2].“A biological marker (biomarker) is a characteristic that is objectively measured and evaluated as an indicator of normal bio-logical processes, pathogenic processes, or pharmaco-logic responses to a therapeutic intervention.”[3] The biomarkers could be identified at any level along the * Correspondence:dmaganaarachchi@gmail.com
1Cell Biology Group, National Institute of Fundamental Studies, Kandy, Sri
Lanka
Full list of author information is available at the end of the article
genome – phenome continuum, and could be genomic biomarkers (DNA or RNA), proteomic biomarkers (pro-teins) or metabolic biomarker (metabolites) [3].
Biomarkers in both acute kidney injury (AKI) and CKD look for similar effects of the diseases; decrease in nephron number, vascular insufficiency, and cell cycle disruption [1]. The biomarkers of kidney disease should however be complemented with clinical assessments of patients with CKD and AKI and not be used in isolation [1]. The intended biomarkers should provide rapid, non-invasive and specific measurements that correlate well with kidney tissue pathology [1].
The most sensitive marker of CKD progression in clin-ical practice is proteinuria, especially when combined with the estimated glomerular filtration rate (eGFR) [2]; however, the process of kidney injury starts with the in-duction of molecular level changes, which therefore gives promise for identification of molecular markers for early diagnosis of disease process. Biomarkers are needed in CKD to help estimate GFR, assess cardiovas-cular disease, determine metabolic abnormalities associ-ated with CKD and differentiate inflammatory and fibrotic conditions of the kidney [1]. The etiologies for CKD differ and therefore comorbidities exist in most CKD patients, hence a single biomarker would be incap-able of satisfying all these needs [1, 2].
In Sri Lanka, there exists CKD of known etiologies (with the majority being diabetes and cardiovascular dis-eases) and unknown etiology (CKDu). This CKDu is confined to certain geographical locations of the coun-try, notably the dry zones, in the North Central Province and Uva Province where the majority of the population are involved in farming as the main occupation. The ma-jority of the hypotheses for the cause of the disease re-volve around environmental stimuli based on the environmental location and occupation of the affected individuals [4–9]. The main biomarkers for screening and identification of CKDu include dipstick proteinuria, serum creatinine and eGFR measurements, while ex-cluding known etiologies of CKD such as diabetes, hypertension, and systemic lupus erythematosus [10]. The presence of small, echogenic kidneys, and tubuloin-terstitial damage on renal biopsy further confirm diagno-sis [11]. As with CKD, the identification of diseased individuals takes place only in the later stages of the dis-ease where the symptoms become apparent.
Although analyzing renal tissue samples would be most ideal as it is the affected tissue, the obtaining of biopsies is invasive, more expensive and not suitable for initial screening purposes [12]. This brings about a need for other suitable tissues for the safe, reliable and inexpensive monitoring of biomarkers. Body fluids like serum and urine are mainly targeted for the identification of biomarkers as they are the least
invasive methods and replace the usage of tissue biopsies [13].
In this pilot study, genes that have potential as screen-ing and prognostic biomarkers of CKD, both known and unknown etiology, were selected from literature to cover more than one particular characteristic/function related to the disease. The expression pattern of selected genes, namely kidney injury molecule-1 (KIM1), fibronectin 1 (FN1), insulin like growth factor binding protein 1 (IGFBP1), insulin like growth factor binding protein 3 (IGFBP3), kallikrein 1 (KLK1), glutathione S transferase mu 1 (GSTM1), glutamate cysteine ligase catalytic sub-unit (GCLC), glucose-6-phosphate dehydrogenase (G6PD), cytochrome P450 enzyme 2D6 (CYP2D6) and 2C19 (CYP2C19) were analyzed in both chronic kidney disease patients of known and unknown etiology resid-ing in Girandurukotte, a CKDu endemic area belongresid-ing to the dry zone of Sri Lanka. The majority of cases in this region belong to the CKDu category. Healthy indi-viduals from the same area who are considered at risk and have been previously screened for CKDu and found negative, and healthy individuals from an area not en-demic for CKDu, Kandy, located in the Central Province, wet zone of the country were selected as controls.
Among the genes selected, two were related to kidney injury and repair, KIM1 and FN1. KIM1 is a novel bio-marker of kidney injury that is upregulated in dediffer-entiated proximal tubule epithelial cells in kidney after ischemic or toxic injury [14]. FN1 is a glycoprotein in-volved in cell adhesion and migration process including wound healing, blood coagulation and host defense. It has also been linked to tissue scarring and fibrosis [15].
Metabolic disorders such as diabetes and cardiovascu-lar diseases are either causative factors or complications of chronic kidney diseases. Therefore three genes related to cardiovascular complications and diabetes were se-lected to observe their use as possible prognostic bio-markers. IGFBP1and IGFBP3 belong to a family of IGFBPs which has six proteins that specifically bind in-sulin like growth factors I (IGF-I) and II (IGF-II). The IGF system has been increasingly implicated in the de-velopment of cardiovascular diseases [16]. They are multifunctional as they not only passively circulate transporters, but also play a variety of roles in the circu-lation, extracellular environment, and inside the cell [17]. IGFBP3 has the major IGF transport function and is the most abundant circulating IGFBP. It has been sug-gested to have a role of wound healing by binding to the IGF-1 and releasing them at the wound sites [17].
There have been hypotheses suggesting the possible role of metal toxicity and environmental toxins as etio-logical factors of CKDu in Sri Lanka [19]. We therefore selected genes related to metal toxicity and oxidative stress (GSTM1, GCLC and G6PD), and xenobiotic me-tabolism (CYP2D6 and CYP2C19) which could be pos-sibly influenced by the environmental toxins, in turn acting as biomarkers of toxicity.
Glutathione (GSH) plays a crucial role in the antioxi-dant defense system and has a predominant role in the regulation of the intracellular redox state and protects cells from oxidative injury [20]. Two genes related to GSH were selected to be studied; GCLC, the rate limit-ing enzyme in the production of GSH, and GSTM1, the enzyme that facilitates the detoxification action of GSH by providing a hydrophilic binding site for glutathione and a hydrophobic binding site for electrophilic sub-strates [21]. The G6PD enzyme is another protein that enables cells to counterbalance the oxidative stress via the activation of the glutathione system by the produc-tion of nicotinamide adenine dinucleotide phosphate (NADPH) [22].
Two genes belonging to the cytochrome P450 mono-xygenase enzyme family, CYP2D6 and CYP2C19 were selected to study any differential expression influenced by drugs or xenobiotics. CYP2D6 metabolizes 20–25% of the clinically used drugs [23], whereas CYP2C19 me-tabolizes 8% of all drugs [24]. Such drug metabolizing enzymes are not only expressed in liver tissue, but also extra hepatic tissues like blood lymphocytes, kidney and intestine [25]. Studies have shown that substrate metab-olism and toxicity can be influenced by the xenobiotic modulation of the CYP genes and that they could hence be sensitive markers of chemical exposure [26, 27].
The expression patterns of the genes were tested in the CKD, CKDu and apparently healthy, risk groups of the CKDu endemic area in comparison to apparently healthy individuals of a non-endemic area in order to identify possible early screening and prognostic markers.
Methods
Patients
The patients to be studied were recruited from June 2013 to November 2015 from the Renal Care & Research Centre, District Hospital, Girandurukotte, a re-gion endemic for CKDu, located in the Uva Province, belonging to the dry zone of Sri Lanka. The diagnosis of patients was carried out by the nephrologist attending the Renal Clinic of the hospital.
CKDu was labeled as having unknown etiology based on criteria set by the Ministry of Health, Sri Lanka with no past history of diabetes mellitus, chronic or severe hypertension, snake bite, glomerulonephritis or uro-logical diseases being causes for the disease. A normal
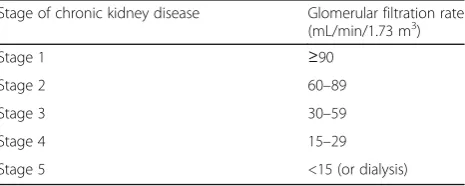
HBA1C (<6.5%), blood pressure <160/100 mmHg un-treated or <140/90 mmHg on up to two antihypertensive medications were additional features. The stages of CKD/CKDu are classified according to the GFR levels (Table 1) [28]. The serum creatinine is also used to esti-mate the GFR (eGFR) levels [29] and therefore is an im-portant biomarker of kidney injury. The equation used was that proposed by Levey et al. [30] (Eq. 1).
eGFR ¼ 186
½serum creatinine mgð =dLÞ−1:154
ðageÞ−0:203 ð0:742 if femaleÞ ð1Þ
The patient population was categorized into four cat-egories; early stage CKDu (n= 11), late stage CKDu (n= 23), early stage CKD(n= 5) and late stage CKD (n= 9), where the early stages consisted of stage 1 to stage 3 pa-tients and late stages consisted of stage 4 and stage 5 patients.
Healthy volunteers
Two apparently healthy groups were selected for the study, consisting of volunteers from both the CKDu en-demic region, Girandurukotte (GH;n= 5), located in the Uva Province, dry zone of the country, as well as a re-gion not endemic to CKDu, Kandy (KH; n= 7), located in the Central Province, wet zone of the country. The residents of Girandurukotte undergo routine screening for CKD/u and the selected individuals were not identi-fied as being diseased. However, the individuals of the Girandurukotte healthy population, being of the same environmental area, are considered to be under risk, due to causative factors of CKDu being hypothesized as en-vironmental related and therefore their expression pat-terns were also analyzed with respect to the healthy group from Kandy.
Sample collection and storage
Blood samples were collected during routine blood col-lection from patients. Whole blood (1 mL) was collected into 3 mL TRIzol LS reagent (Invitrogen), shaken vigor-ously to ensure lysis and transported in ice from the Dis-trict Hospital, Girandurukotte to the National Institute
Table 1Different stages of chronic kidney disease classified by glomerular filtration rates
Stage of chronic kidney disease Glomerular filtration rate (mL/min/1.73 m3)
Stage 1 ≥90
Stage 2 60–89
Stage 3 30–59
Stage 4 15–29
of Fundamental Studies, Kandy, where it was stored under−20 °C. RNA extractions were carried out the day following arrival at the facility.
RNA extraction and RT-qPCR
RNA was extracted according to the TRIzol LS (Invitro-gen) manufacturer’s protocol followed by purification using PAXgene spin columns (PreAnalytix). All ex-tracted RNA samples were checked for integrity by using Agarose gel electrophoresis, and looking for 28 s:18 s rRNA intensity of approximately 2:1. The absorbance values, A280/A260 and A230/A260 were measured using UV spectrophotometry (Shimadzu) to interpret protein and salt impurities and values had to be greater than 1.7 and 1.0 respectively for inclusion in study. A total of 1 μg of RNA as measured by the QuantiFluor-ST RNA system (Promega) was used in the preparation of cDNA (Quantitect Reverse Transcription Kit, Qiagen). Equal amount of cDNA (total RNA = 50 ng) was used in each PCR reaction.
PCR Mastermix was prepared using the Quantitect Probe PCR Kit (Qiagen) and reaction components
included 10μL QuantiTect Probe PCR mastermix (Qia-gen), 4μL RNase free H2O, 0.8μM forward and reverse primers, 0.2 μM probe and 50 ng of cDNA template. The cycler was programmed for initial activation of Hot-StartTaq polymerase at 95 °C for 15 mins, and 50 cycles of denaturation at 95 °C, 30s and combined annealing and extension at 60 °C, 60s. Hydrolysis probes were used for the fluorescent detection and quantification of PCR amplification. Self designed as well as pre designed primers were used for the PCR amplification [31–35]. Details of primers and probes used have been presented in Table 2. The fluorescence for probe detection was ac-quired in the extension steps using the green channel of the RotorGene Q cycler (Qiagen).
Quantification of fold changes
Fold changes were calculated using the comparative Ct method [36] with two reference genes, B2M and GAPDH. The KH group was used for calibration. The individual fold changes were calculated and geometric means obtained of the respective groups.
Table 2Details of primer and probe sequences
Name Accession Number Sequences 5’–3’
(F- forward, R- reverse, P- probe)
GCLC NM_001498.3 F: ACAAGGACGTTCTCAAGTG
R: AGGATGGTTTGGGTTTGTC
P: CCTGTCTGGGGAGAAAGTTCTTGAAACTCT
KIM1 NM_012206.2 F: AACCAGTAGCCACTTCAC
R: CTGTCACGGTGTCATTCC P: TCAGCCAGCAGAAACCCACCC
GSTM1 NM_000561.3 F: GCATGATCTGCTACAATCCA
R: TTGTTTCCTGCAAACCAT
P: CCTGAAAAGCTAAAGCTCTACTCAGAG
KLK1 NM_002257.3 F: GGACTACAGCCACGACCTCATGCTGC
R: GTCCACACACTGGAGATCATCTGG P: TGGAGTTGCCCACCGAGGAACCCGAA
CYP2D6 NM_000106.5 F: TAGTGGTGGCTGACCTGTTCTCT R: TCGTCGATCTCCTGTTGGACA
P: CTCCTGCTCATGATCCTACATCCGGA
CYP2C19 NM_000769.1 F: GAACACCAAGAATCGATGGACA
R: TCAGCAGGAGAAGGAGAGCATA
P: TAATCACTGCAGCTGACTTACTTGGAGCTGGG
IGFBP1 NM_000596.2 F: GGGACGCCATCAGTACC R: CCATTTTTTGATGTTGGTGAC
P: ATGATGGCTCGAAGGCTCTCCA
IGFBP3 NM_000598.4 F: CAGAGCACAGATACCCAGAACTTC R: TTCTCTACGGCAGGGACCAT
P: ATTCTGTCTCCCGCTTGGACTCGGA
FN1 NM_212482.1 F: GAAGAGCGAGCCCCTGAT R: GGGGTCTTTTGAACTGTGGA
P: AGACGAGCTTCCCCAACTGGTAACCCCTT
G6PD NM_000402.4 F: TGCCCCCGACCGTCTAC R: ATGCGGTTCCAGCCTATCTG
P: ACTCGTGAATGTTCTTGGTGACGGCC
B2M NM_004048.2 F: TGCCGTGTGAACCATGTGA R: CCAAATGCGGCATCTTCAA
P: TGATGCTGCTTACATGTCTCGATCCCACT
GAPDH NM_001289745.1 F: TGACCTCAACTACATGGTTTA
Statistical analysis
Log 2 normalized values of the fold changes were used for further statistical analysis. One way ANOVA and post hoc Games-Howell analysis were carried out to identify significant results. Outliers, extreme of 1.5 times of inter-quartile range (IQR), calculated separately for each study group were excluded in ANOVA calculations. The log 2 normalized fold changes were also analyzed for correlation with the currently used marker of CKD, serum creatinine, using the Pearson correlation coeffi-cient and two tailed significance values. Missing values were replaced with means for the correlation calcula-tions. The correlations were carried out separately for the CKD and CKDu groups.
Gender-wise difference in expression of the genes was analyzed using two-tailed ttest in between the groups.
Results
Study population
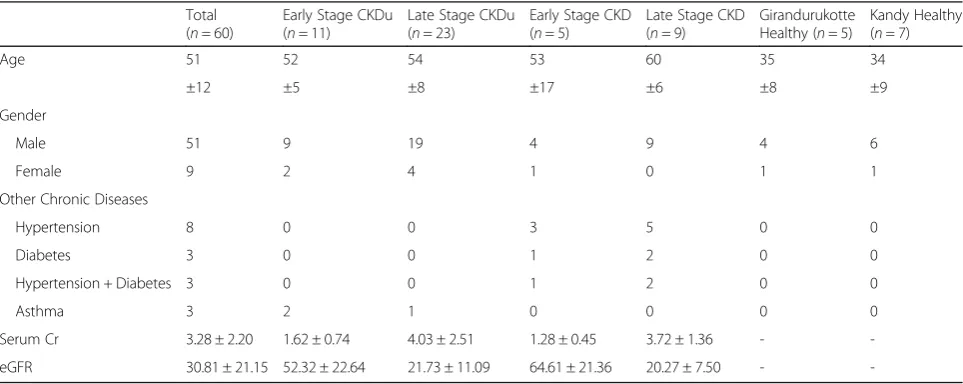
The characteristics of the study population are summa-rized in Table 3. A total of 60 subjects were included in the study; 51 males and 9 females. The mean age of the study population was 51 ± 12. The serum creatinine and eGFR levels of the early stage CKDu were 1.62 ± 0.74 and 52.03 ± 22.52, and the late stage CKDu were 4.03 ± 2.52 and 21.61 ± 11.03 respectively. The serum creatinine and eGFR levels of the early stage CKD were 1.28 ± 0.45 and 64.26 ± 21.25, and the late stage CKD were 3.72 ± 1.36 and 20.16 ± 7.46 respectively. The healthy popula-tions from both the Girandurukotte as well as Kandy areas were selected based on no current illnesses and no previous records of chronic illnesses; their serum cre-atinine and eGFR levels were not measured. There were eight patients with hypertension, three patients with
diabetes, and three patients with both diabetes and hypertension as causes for CKD. Three of the CKDu pa-tients had asthma as a chronic illness. Majority of the patient population (87.5%) were involved in farming ei-ther directly or assisting. None of the healthy individuals from both the endemic as well as non-endemic areas who volunteered for the study were involved directly in or assisted with farming.
Gene expression analysis
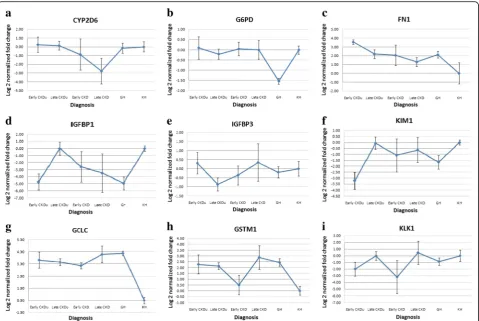
The expressions of the selected genes were analyzed in the patient groups and the GH group using the KH group as calibrators. Group means with standard errors of log normalized values have been graphically presented (Fig. 1).
Significant differences were seen on one-way ANOVA, for four of the studied genes, IGFBP1 (F5,52 = 3.705, p= 0.007), KIM1 (F5,56= 3.701, p= 0.006), GCLC (F5,52= 5.535, p= 0.000), GSTM1 (F5, 36= 3.143, p= 0.021) and KLK1 (F5, 55= 2.925, p= 0.022). Post hoc Games-Howell test, equal variances not assumed, revealed significant difference between the KH group and early stage CKDu for both the IGFBP1 gene (p= 0.012) and the KIM1 gene (p= 0.003), and KH group and late stage CKDu and late stage CKD for the GSTM1 gene (p= 0.021 and p= 0.030). Significant dif-ference was seen between the early and late stage CKDu for the IGFBP1 and the KIM1 genes (p= 0.010 and p= 0.006 respectively). The GCLC gene showed significant differences in expression between the KH group and all the other study groups (p< 0.05). The GH population was significantly different from the KH population for the three oxidative stress related genes G6PD (p= 0.004), GCLC (p= 0.004) and
Table 3Characteristics of study population
Total (n= 60)
Early Stage CKDu (n= 11)
Late Stage CKDu (n= 23)
Early Stage CKD (n= 5)
Late Stage CKD (n= 9)
Girandurukotte Healthy (n= 5)
Kandy Healthy (n= 7)
Age 51 52 54 53 60 35 34
±12 ±5 ±8 ±17 ±6 ±8 ±9
Gender
Male 51 9 19 4 9 4 6
Female 9 2 4 1 0 1 1
Other Chronic Diseases
Hypertension 8 0 0 3 5 0 0
Diabetes 3 0 0 1 2 0 0
Hypertension + Diabetes 3 0 0 1 2 0 0
Asthma 3 2 1 0 0 0 0
Serum Cr 3.28 ± 2.20 1.62 ± 0.74 4.03 ± 2.51 1.28 ± 0.45 3.72 ± 1.36 -
-GSTM1 (p= 0.015), and also the KIM1 gene (p= 0.003). Significant difference between GH and late stage CKDu was seen in the G6PD (p= 0.007) and IGFBP1 (p= 0.013) genes.
Other significant results include absence of the GSTM1 gene expression in 11/34 CKDu patients (32.35%), 6/14 CKD patients (42.86%), 0/5 GH popula-tion and 3/7 KH individuals (42.86%).
Correlation with currently used biomarkers
The log normalized gene expression was correlated with two currently used markers of CKD; serum cre-atinine and eGFR, separately in the CKD and CKDu groups. Pearson correlation coefficients and two-tailed significance values were calculated (Table 4; Table 5), and correlation graphs plotted (Figs. 2, 3) respectively for CKD and CKDu. No significant correlations were
Fig. 1Group means with standard errors of log normalized gene expressions ofaCYP2D6;bG6PD;cFN1;dIGFBP1;eIGFBP3;fKIM1;gGCLC;h GSTM1;iKLK1
Table 4Correlation of log normalized gene fold changes with established biomarkers, serum creatinine and estimated GFR in the CKD group
CYP2D6 G6PD FN1 IGFBP1 IGFBP3 KIM1 GCLC GSTM1 KLK SrCr eGFR
SrCr Pearson Correlation 0.156 −0.491 −0.354 0.233 0.438 0.369 −0.383 0.280 0.515 1.000 −0.858a
Sig. (2-tailed) 0.594 0.075 0.215 0.424 0.118 0.194 0.176 0.333 0.059 - 0.000
N 14 14 14 14 14 14 14 14 14 14 14
eGFR Pearson Correlation −0.028 0.179 0.405 0.109 −0.472 −0.062 0.235 −0.386 −0.280 −0.858a 1.000
Sig. (2-tailed) 0.925 0.540 0.151 0.711 0.088 0.833 0.419 0.173 0.333 0.000
-N 14 14 14 14 14 14 14 14 14 14 14
a
seen in the CKD group in between the study genes and serum creatinine. In the CKDu group, FN1 and IGFBP3 had negative correlations with serum creatin-ine (r=−0.445, p= 0.008 and r=−0.389, p= 0.023
re-spectively) whereas KIM1 and IGFBP1 showed
positive correlations (r= 0.369, p= 0.032 and r= 0.373, p= 0.030 respectively) with serum creatinine. IGFBP1, KIM1 and KLK1 showed negative correlations with eGFR (r=−0.513, p= 0.002; r=−0.443, p= 0.009; r= −0.340, p= 0.049 respectively). The other genes did not show any correlation of significance. In the CKD
group, none of the genes showed any significant cor-relation with serum creatinine or eGFR.
There was no statistical difference seen in the two-tailed ttest between the male and female populations within each study group.
Discussion
We analyzed the expression patterns of a selected panel of genes in CKDu patients to test their possible use as early screening and prognostic biomarkers. In an era where personalized medicine is taking precedence over Table 5Correlation of log normalized gene fold changes with established biomarkers, serum creatinine and estimated GFR in the CKDu group
CYP2D6 G6PD FN1 IGFBP1 IGFBP3 KIM1 GCLC GSTM1 KLK SrCr eGFR
SrCr Pearson Correlation 0.077 0.041 −0.445a 0.373b −0.389b .0369b 0.105 −0.024 0.190 1.000 −0.743a
Sig. (2-tailed) 0.666 0.820 0.008 0.030 0.023 0.032 0.554 0.891 0.282 - 0.000
N 34 34 34 34 34 34 34 34 34 34 34
eGFR Pearson Correlation −0.141 −0.055 0.320 −0.513a 0.408* −0.443a −0.110 −0.150 −0.340b −0.743a 1.000
Sig. (2-tailed) 0.426 0.758 0.065 0.002 0.017 0.009 0.536 0.396 0.049 0.000
-N 34 34 34 34 34 34 34 34 34 34 34
a
Correlation is significant at the 0.01 level (2-tailed) b
Correlation is significant at the 0.05 level (2-tailed) All entries in boldface are significant at least at the 0.05 level
generalized diagnosis and treatment, the use of personal-ized biomarkers to identify specific molecular changes occurring in an individual is becoming more important [37, 38]. Although personalization to the individual level would not be financially feasible for developing coun-tries, it is necessary to at least get specific to the disease level. For a disease like CKD, although there are some common pathways that lead to the progression of the disease, there are various primary causes having different pathophysiological mechanisms [2] and it would be ad-vantageous to have biomarkers personalized to identify, monitor and treat them specifically.
This need is further realized in CKDu, a disease which is limited only to specific populations in certain geo-graphic locations of the world. Although biomarkers of general CKD such as proteinuria, serum creatinine and GFR are currently being used in the diagnosis and prog-nosis of CKDu [10], this disease is believed to have a dif-ferent, unidentified etiology, and therefore should give rise to different molecular level changes in the individual leading to the disease. In a geographical location en-demic to CKDu, where individuals are exposed to similar environments as well as may be having diagnoses of other metabolic diseases, it can be easy to misdiagnose
patients using common biomarkers and this brings a ne-cessity to identify biomarkers to differentiate the groups from each other while also separating them from healthy individuals.
The symptoms of CKD usually do not become appar-ent till significant reduction of the kidney function has occurred. Stages 1 to 3 of the disease have been classi-fied as early stage because of their asymptomatic pro-gression and due to the fact that propro-gression of the disease can be altered and complications reduced if identified during these stages [39]. Stages 4 and 5 have extensive kidney damage and usually lead to end-stage renal failure and therefore were considered as late stages of the disease.
In this study, analysis of gene expression was made using healthy population from Kandy, Sri Lanka; an area not endemic to the disease, as calibrators. These individ-uals belong to the same ethnicity and race, however were not residing in the same environment and were not involved in farming as an occupation. The study popula-tion had more males than females. The increased risk and incidence of CKDu in males has also been docu-mented by other epidemiological studies [10, 11]. Any potential biomarker identified was expected to be
significantly differentially expressed in the diseased groups. A healthy group from the CKDu endemic area, Girandurukotte, was also included in the study. As the etiology for the disease is believed to be environmental related, this population is also possibly exposed to the same disease causing factor/s and have to be considered a population at risk of developing disease. The gene ex-pression patterns of this group were also thus compared to the healthy group from Kandy.
The fold changes observed in the CKD groups, both early and late stages, had high variation and therefore high standard errors as seen in Fig. 1. This could be due to the limited size of the CKD study population (n= 14) and the different etiologies for CKD within our study group, including hypertension (n= 8), diabetes (n= 3), and both (n= 3). The gene expression patterns of the CKD group also did not show any correlation with the currently used markers of the disease, serum creatinine and eGFR.
The CKDu group however showed lower standard er-rors and had fold changes of significant difference to the Kandy healthy group for some of the genes. Significant difference was observed between the KH group and early stage CKDu for the gene IGFBP1 (p= 0.012). IGFBP1 levels in human plasma has shown dynamic metabolic regulation [40]. Of the IGF binding proteins, IGFBP1 has been found to be the most regulated due to its acute down regulation by insulin and up regulation by glucor-egulatory hormones and cytokines [16]. This gene is the main regulator of IGF-1 bioactivity and it has been found to play a major role in the development of dia-betes and associated complications [41]. Low circulating serum levels of this enzyme has been associated with type 2 diabetes (T2D) in studies conducted in Swedish population [42–44] as well as in an Indian population [45]. Although our CKDu population was not diagnosed with diabetes, the IGFBP1 was most down regulated in the early stage CKDu, more so even than the CKD groups.
A similar difference was also observed between the KH group and early stage CKDu for the KIM1 gene (p= 0.003). The KIM1 gene was seen down regulated in the early stage CKDu patients when compared to the KH group. The KIM1 protein has been extensively studied and has been identified as a new specific marker for proximal tubule injury [46]. The protein and the gene have however been studied mainly in urine and kidney tissue biopsies, where it has always been up regulated with kidney disease [46–48].
Our finding in blood tissue is contrasting where it was seen down regulated in most of the diseased patients, with a highly significant decrease seen in the early stage CKDu patients. The role of KIM1 gene in blood is differ-ent to that of the kidney. The gene shares differdiffer-ent
names including Hepatitis A virus cellular receptor 1 (HAVCRI) and T-cell immunoglobulin and mucin do-main (TIM1) [49, 50], owing to their different functions. Their functions mainly include coding for membrane ceptors and associated with inflammatory healing re-sponse and infection [50]. Although it is difficult to assume the importance or the physiological response of this gene in blood of these diseased patients, the signifi-cant decrease seen in the early stage of CKDu indicates its potential as an early marker of the disease which needs to be further tested.
Significant differences in between the healthy popula-tions from the two areas were seen for the G6PD, GCLC, GSTM1 and KIM1 genes, where the GH popula-tion showed similar expression patterns to that of the disease groups for the GCLC, GSTM1 and KIM1 genes. The healthy individuals of the GH group were those not diagnosed with CKDu on routine screening of popula-tion. However, as the initial stages of disease do not show any symptoms and there is a lack of sensitive early markers, the individuals from the GH group could be in the very early stages of disease formation, being resi-dents of the high risk area. Follow up of these individ-uals and clinical testing could help answer these questions. If these individuals do indeed progress to dis-ease formation, these genes would hold high potential as early diagnostic biomarkers.
Up regulation of the GCLC and GSTM1 genes in the Girandurukotte healthy population compared to Kandy healthy population has been documented in a separate cohort [51] and has been hypothesized to be due to the environmental oxidative stressors that the population may be exposed to. These genes therefore hold potential as early screening markers, but needs further follow-up and testing.
When correlating gene expressions with the existing markers of CKD/CKDu, FN1 and IGFBP3 had negative correlations with serum creatinine whereas KIM1 and IGFBP1 showed positive correlations. IGFBP1, KIM1 and KLK1 showed negative correlations with eGFR. FN1 gene showed a significant negative correlation with serum creatinine in the CKDu patients. This gene was up regulated in all the disease patients but was seen to be more highly expressed in the early stage CKDu than late stage CKDu, and early stage CKD than late stage CKD. The correlation of the gene expressions with the current biomarkers of kidney diseases further strengthens their potential use as biomarkers of CKDu.
disease with levels rising back to near Kandy healthy with later stages. Girandurukotte healthy individuals were also seen to have decreased expression of these genes similar to the early stages of disease (Fig. 1). It could be therefore postulated that the reduced baseline expression of these genes relates to disease susceptibility in this endemic population. The KIM1 and IGFBP1 gene also showed statistically significant difference in expres-sion between the early and late stages of CKDu in the one-way ANOVA test further strengthening their possi-bility as prognostic biomarkers of CKDu.
The serum creatinine values were not obtained from the healthy individuals and therefore the correlation was based on values obtained only from disease patients. The expressions of the genes did not seem to have a steady progression with increasing severity of the disease as is seen with the established biomarkers. Drastic differ-ential regulation was seen in the early stage CKDu com-pared to the KH group and the fold changes were near normal in the later stages of CKDu as seen in FN1, IGFBP1 and KIM1 genes. The expression of these genes from healthy through the increasing stages may not therefore be linear as in the case of serum creatinine, and the correlations seen may not indicate a relationship between the parameters, but individually regulatory mechanisms. For example, FN1 expression in blood has been associated with hypertension where increased ex-pression was seen in hypertensive patients, being in-volved in protective mechanisms that limit organ damage [52]. The increased expression in early stage CKDu could be an initial protective effect which again diminishes with disease progression.
As a single biomarker will not suffice for clear identifi-cation of this disease with multiple possible etiologies and comorbidities, a panel of markers will have to be used. IGFBP1 and KIM1 genes have potential as early screening markers of CKDu as they showed significant differences in expression with late stage CKDu and the KH group. Increased expression of GCLC could be an indicator of environmental oxidative stress and the lack of GSTM1 gene is an indicator of increased susceptibil-ity to oxidative stress. IGFBP1, IGFBP3, FN1 and KIM1 showed correlations with serum creatinine whereas IGFBP1, KIM1 and KLK1 showed correlations with eGFR therefore holding potential as progressive bio-markers of CKDu.
Limitations of study
The study was a preliminary one looking at the possibil-ity of selected genes as genetic biomarkers of CKDu. The study was carried out with a limited sample size for the identification of possible biomarkers with significant variances, which could then be validated in further stud-ies with larger study populations. The healthy and
disease groups belonged to different age categories which could be an influencing factor to the results.
Conclusion
A panel consisting of IGFBP1, KIM1, GCLC and GSTM1 genes could be used in combination for early screening of CKDu, whereas these genes in addition with FN1, IGFBP3 and KLK1 could be used to monitor pro-gression of CKDu. This is however a pilot study and the regulation of these genes have to be studied on larger scale populations to identify robust biomarkers that could be further tested for clinical use.
Abbreviations
AKI:Acute kidney injury; ANOVA: Analysis of variance; cDNA: Complementary DNA; CKD: Chronic kidney disease; CKDu: Chronic kidney disease of unknown etiology; Ct: Threshold cycle; CYP2C19: Cytochrome P450 2C19; CYP2D6: Cytochrome P450 2D6; eGFR: Estimated glomerular filtration rate; FN1: Fibronectin-1; G6PD: Glucose-6-phosphate dehydrogenase; GCLC: Glutamate cysteine ligase C subunit; GFR: Glomerular filtration rate; GH: Girandurukotte Healthy; GSH: Glutathione; GSTM1: Glutathione-S-transferase mu 1; HAVCR1: Hepatitis A virus cellular receptor 1; IGF I: Insulin like growth factor 1; IGF II: Insulin like growth factor II; IGFBP1: Insulin like growth factor binding protein-1; IGFBP3: Insulin like growth factor binding protein-3; IQR: Inter-quartile range; KH: Kandy Healthy; KIM1: Kidney injury molecule-1; KLK1: Kallikrein-1;
NADPH: Nicotinamide adenine dinucleotide phosphate; PCR: Polymerase chain reaction; SD: Standard deviation; T2D: Type 2 diabetes; TIM1: T-cell immunoglobulin and mucin domain
Acknowledgements
The studies were supported by the grant 11–059 received from the National Research Council, Sri Lanka.
Authors’contributions
DM concept, designed the study and corrected the manuscript. LG and TA screened patients. SS collected all clinical and laboratory data, performed laboratory experiments and statistical analyses, and wrote the manuscript. All authors read and approved the final manuscript.
Competing interests
The authors declare that they have no competing interests.
Ethics approval and consent to participate
Ethical clearance for the study was obtained from the relevant hospital authorities and the Postgraduate Institute of Science, University of Peradeniya, Sri Lanka. The investigation conformed to the principles outlined in the Declaration of Helsinki and written informed consent was obtained from each subject.
Author details 1
Cell Biology Group, National Institute of Fundamental Studies, Kandy, Sri Lanka.2Renal Care & Research Centre, District Hospital, Girandurukotte, Sri Lanka.3Department of Pharmacology, Faculty of Medicine, University of Peradeniya, Kandy, Sri Lanka.
Received: 25 January 2016 Accepted: 6 January 2017
References
1. Wasung ME, Chawla LS, Madero M. Biomarkers of renal function, which and when? Clin Chim Acta. 2015;438:350–7.
2. Fassett RG, Venuthurupalli SK, Gobe GC, Coombes JS, Cooper MA, Hoy WE. Biomarkers in chronic kidney disease: a review. Kidney Int. 2011; 80(8):806–21.
4. Bandara JM, Senevirathna DM, Dasanayake DM, Herath V, Bandara JM, Abeysekara T, Rajapaksha KH. Chronic renal failure among farm families in cascade irrigation systems in Sri Lanka associated with elevated dietary cadmium levels in rice and freshwater fish (Tilapia). Environ Geochem Health. 2008;30(5):465–78.
5. Wanigasuriya KP, Peiris-John RJ, Wickremasinghe R. Chronic kidney disease of unknown aetiology in Sri Lanka: is cadmium a likely cause? BMC Nephrol. 2011;12:32.
6. Chandrajith R, Nanayakkara S, Itai K, Aturaliya TN, Dissanayake CB, Abeysekera T, Harada K, Watanabe T, Koizumi A. Chronic kidney diseases of uncertain etiology (CKDue) in Sri Lanka: geographic distribution and environmental implications. Environ Geochem Health. 2011;33(3):267–78. 7. Jayasumana C, Gajanayake R, Siribaddana S. Importance of Arsenic and
pesticides in epidemic chronic kidney disease in Sri Lanka. BMC Nephrol. 2014;15:124.
8. Redmon JH, Elledge MF, Womack DS, Wickremashinghe R, Wanigasuriya KP, Peiris-John RJ, Lunyera J, Smith K, Raymer JH, Levine KE. Additional perspectives on chronic kidney disease of unknown aetiology (CKDu) in Sri Lanka–lessons learned from the WHO CKDu population prevalence study. BMC Nephrol. 2014;15:125.
9. Siriwardhana EA, Perera PA, Sivakanesan R, Abeysekara T, Nugegoda DB, Weerakoon KG. Is the staple diet eaten in Medawachchiya, Sri Lanka, a predisposing factor in the development of chronic kidney disease of unknown etiology? - A comparison based on urinary beta2-microglobulin measurements. BMC Nephrol. 2014;15:103.
10. Senevirathna L, Abeysekera T, Nanayakkara S, Chandrajith R, Ratnatunga N, Harada KH, Hitomi T, Komiya T, Muso E, Koizumi A. Risk factors associated with disease progression and mortality in chronic kidney disease of uncertain etiology: a cohort study in Medawachchiya, Sri Lanka. Environ Health Prev Med. 2012;17(3):191–8.
11. Athuraliya NT, Abeysekera TD, Amerasinghe PH, Kumarasiri R, Bandara P, Karunaratne U, Milton AH, Jones AL. Uncertain etiologies of proteinuric-chronic kidney disease in rural Sri Lanka. Kidney Int. 2011;80(11):1212–21. 12. Kumar M, Sarin SK: Biomarkers of Disease in Medicine. Current Trends Sci.
2009:403–417. http://www.mta.ca/pshl/docs/BiomarkersDiseaseMedicine.pdf. Accessed 13 Jan 2017.
13. Biomarker Discovery - The Challenges and Rewards Ahead [http://www. kellyservices.com/US/Careers/Kelly-Scientific-Resources/Bob-Chen-Essay— Future-Scientists/]. Accessed 13 Jan 2017.
14. Humphreys BD, Xu F, Sabbisetti V, Grgic I, Naini SM, Wang N, Chen G, Xiao S, Patel D, Henderson JM, et al. Chronic epithelial kidney injury molecule-1 expression causes murine kidney fibrosis. J Clin Invest. 2013;123(9):4023–35. 15. Waalkes S, Atschekzei F, Kramer MW, Hennenlotter J, Vetter G, Becker JU,
Stenzl A, Merseburger AS, Schrader AJ, Kuczyk MA, et al. Fibronectin 1 mRNA expression correlates with advanced disease in renal cancer. BMC Cancer. 2010;10:503.
16. Heald AH, Siddals KW, Fraser W, Taylor W, Kaushal K, Morris J, Young RJ, White A, Gibson JM. Low circulating levels of insulin-like growth factor binding protein-1 (IGFBP-1) are closely associated with the presence of macrovascular disease and hypertension in type 2 diabetes. Diabetes. 2002;51:2629–35. 17. Firth SM, Baxter RC. Cellular actions of the insulin-like growth factor binding
proteins. Endocr Rev. 2002;23(6):824–54.
18. Yu H, Song Q, Freedman BI, Chao J, Chao L, Rich SS, Bowden DW. Association of the tissue kallikrein gene promoter with ESRD and hypertension. Kidney Int. 2002;61:1030–9.
19. Jayatilake N, Mendis S, Maheepala P, Mehta FR. Chronic kidney disease of uncertain aetiology: prevalence and causative factors in a developing country. BMC Nephrol. 2013;14(1):180.
20. Koide S, Kugiyama K, Sugiyama S, Nakamura S, Fukushima H, Honda O, Yoshimura M, Ogawa H. Association of polymorphism in glutamate-cysteine ligase catalytic subunit gene with coronary vasomotor dysfunction and myocardial infarction. J Am Coll Cardiol. 2003;41(4):539–45.
21. Guilford FT, Hope J. Deficient glutathione in the pathophysiology of mycotoxin-related illness. Toxins. 2014;6(2):608–23.
22. Budak H, Ceylan H, Kocpinar EF, Gonul N, Erdogan O. Expression of glucose-6-phosphate dehydrogenase and 6-phosphogluconate dehydrogenase in oxidative stress induced by long-term iron toxicity in rat liver. J Biochem Mol Toxicol. 2014;28(5):217–23.
23. Ingelman-Sundberg M. Genetic polymorphisms of cytochrome P450 2D6 (CYP2D6): clinical consequences, evolutionary aspects and functional diversity. Pharmacogenomics J. 2005;5(1):6–13.
24. Lewis DF. Human cytochromes P450 associated with the phase 1 metabolism of drugs and other xenobiotics: a compilation of substrates and inhibitors of the CYP1, CYP2 and CYP3 families. Curr Med Chem. 2003; 10(19):1955–72.
25. Raucy JL, Ingelman-Sundberg M, Carpenter S, Rannug A, Rane A, Franklin M, Romkes M. Drug metabolizing enzymes in lymphocytes. J Biochem Mol Toxicol. 1999;13(3–4):223–6.
26. Sewall CH, Bell DA, Clark GC, Tritscher AM, Tully DB, Vanden Heuvel J, Lucier GW. Induced gene transcription: implications for biomarkers. Clin Chem. 1995;41(12 Pt 2):1829–34.
27. Walker CH. The use of biomarkers to measure the interactive effects of chemicals. Ecotoxicol Environ Saf. 1998;40(1–2):65–70.
28. Eckardt KU, Berns JS, Rocco MV, Kasiske BL. Definition and classification of CKD: the debate should be about patient prognosis–a position statement from KDOQI and KDIGO. Am J Kidney Dis. 2009;53(6):915–20.
29. Jafar TH, Schmid CH, Levey AS. Serum creatinine as marker of kidney function in South Asians: a study of reduced GFR in adults in Pakistan. J Am Soc Nephrol. 2005;16(5):1413–9.
30. Levey A, Greene T, Kusek J, Beck G: A simplified equation to predict glomerular filtration rate from serum creatinine [Abstract]. J Am Soc Nephrol. 2000;11:155A.
31. Imaoka S, Yoneda Y, Sugimoto T, Hiroi T, Yamamoto K, Nakatani T, Funae Y. CYP4B1 is a possible risk factor for bladder cancer in humans. Biochem Biophys Res Commun. 2000;277(3):776–80.
32. Koop K, Eikmans M, Baelde HJ, Kawachi H, De Heer E, Paul LC, Bruijn JA. Expression of podocyte-associated molecules in acquired human kidney diseases. J Am Soc Nephrol. 2003;14(8):2063–71.
33. Nabilsi NH, Broaddus RR, McCampbell AS, Lu KH, Lynch HT, Chen LM, Loose DS. Sex hormone regulation of survivin gene expression. J Endocrinol. 2010; 207(2):237–43.
34. Nishimura M, Yoshitsugu H, Naito S, Hiraoka I. Evaluation of gene induction of drug-metabolizing enzymes and transporters in primary culture of human hepatocytes using high-sensitivity real-time reverse transcription PCR. J Pharm Soc Jpn. 2002;122(5):339–61.
35. Takayasu H, Horie H, Hiyama E, Matsunaga T, Hayashi Y, Watanabe Y, Suita S, Kaneko M, Sasaki F, Hashizume K, et al. Frequent deletions and mutations of the beta-catenin gene are associated with overexpression of cyclin D1 and fibronectin and poorly differentiated histology in childhood hepatoblastoma. Clin Cancer Res. 2001;7(4):901–8.
36. Livak KJ, Schmittgen TD. Analysis of relative gene expression data using real-time quantitative PCR and the 2(−Delta Delta C(T)) Method. Methods. 2001;25(4):402–8.
37. Lambers Heerspink HJ, Oberbauer R, Perco P, Heinzel A, Heinze G, Mayer G, Mayer B. Drugs meeting the molecular basis of diabetic kidney disease: bridging from molecular mechanism to personalized medicine. Nephrol Dial Transplant. 2015;30 Suppl 4:iv105–12.
38. Mann JF, Rossing P, Wiecek A, Rosivall L, Mark P, Mayer G. Diagnosis and treatment of early renal disease in patients with type 2 diabetes mellitus: what are the clinical needs? Nephrol Dial Transplant. 2015;30 Suppl 4:iv1–5. 39. Fink HA, Ishani A, Taylor BC, Greer NL, MacDonald R, Rossini D, Sadiq S,
Lankireddy S, Kane RL, Wilt TJ. Chronic Kidney Disease Stages 1–3: Screening, Monitoring, and Treatment. Comparative Effectiveness Review No. 37. (Prepared by the Minnesota Evidence-based Practice Center under Contract No. HHSA 290-2007-10064-I.) AHRQ Publication No. 11(12)-EHC075-EF. Rockville, MD: Agency for Healthcare Research and Quality. 2012. www. effectivehealthcare.ahrq.gov/reports/final.cfm.
40. Ooi GT, Tseng LYH, Tran MQ, Rechler MM. Insulin rapidly decreases insulin-like growth factor-binding protein-1 gene transcription in streptozotocin-diabetic rats. Mol Endocrinol. 1992;6(12):2219–28.
41. Gu T, Falhammar H, Gu HF, Brismar K. Epigenetic analyses of the insulin-like growth factor binding protein 1 gene in type 1 diabetes and diabetic nephropathy. Clin Epigenetics. 2014;6(1):10.
42. Lewitt MS, Hilding A, Ostenson CG, Efendic S, Brismar K, Hall K. Insulin-like growth factor-binding protein-1 in the prediction and development of type 2 diabetes in middle-aged Swedish men. Diabetologia. 2008; 51(7):1135–45.
44. Gu T, Gu HF, Hilding A, Sjoholm LK, Ostenson CG, Ekstrom TJ, Brismar K. Increased DNA methylation levels of the insulin-like growth factor binding protein 1 gene are associated with type 2 diabetes in Swedish men. Clin Epigenetics. 2013;5(1):21.
45. Gokulakrishnan K, Velmurugan K, Ganesan S, Mohan V. Circulating levels of insulin-like growth factor binding protein-1 in relation to insulin resistance, type 2 diabetes mellitus, and metabolic syndrome (Chennai Urban Rural Epidemiology Study 118). Metab Clin Exp. 2012;61(1):43–6.
46. Sabbisetti VS, Waikar SS, Antoine DJ, Smiles A, Wang C, Ravisankar A, Ito K, Sharma S, Ramadesikan S, Lee M, et al. Blood kidney injury molecule-1 is a biomarker of acute and chronic kidney injury and predicts progression to ESRD in type I diabetes. J Am Soc Nephrol. 2014;25(10):2177–86.
47. Zhou Y, Vaidya VS, Brown RP, Zhang J, Rosenzweig BA, Thompson KL, Miller TJ, Bonventre JV, Goering PL. Comparison of kidney injury molecule-1 and other nephrotoxicity biomarkers in urine and kidney following acute exposure to gentamicin, mercury, and chromium. Toxicol Sci. 2008;101(1): 159–70.
48. Simic Ogrizovic S, Bojic S, Basta-Jovanovic G, Radojevic S, Pavlovic J, Kotur Stevuljevic J, Dopsaj V, Naumovic R. Tissue kidney injury molecule-1 expression in the prediction of renal function for several years after kidney biopsy. Dis Markers. 2013;35(5):567–72.
49. Xiao S, Brooks CR, Sobel RA, Kuchroo VK. Tim-1 is essential for induction and maintenance of IL-10 in regulatory B cells and their regulation of tissue inflammation. J Immunol. 2015;194(4):1602–8.
50. Angiari S, Donnarumma T, Rossi B, Dusi S, Pietronigro E, Zenaro E, Della Bianca V, Toffali L, Piacentino G, Budui S, et al. TIM-1 glycoprotein binds the adhesion receptor P-selectin and mediates T cell trafficking during inflammation and autoimmunity. Immunity. 2014;40(4):542–53. 51. Sayanthooran S, Magana-Arachchi DN, Gunerathne L, Abeysekera TDJ,
Sooriyapathirana SS. Upregulation of oxidative stress related genes in a chronic kidney disease attributed to specific geographical locations of Sri Lanka. Biomed Res Int. 2016;2016:7546265.
52. Stoynev N, Dimova I, Rukova B, Hadjidekova S, Nikolova D, Toncheva D, Tankova T. Gene expression in peripheral blood of patients with hypertension and patients with type 2 diabetes. J Cardiovasc Med (Hagerstown). 2014;15(9):702–9.
• We accept pre-submission inquiries
• Our selector tool helps you to find the most relevant journal
• We provide round the clock customer support
• Convenient online submission
• Thorough peer review
• Inclusion in PubMed and all major indexing services
• Maximum visibility for your research
Submit your manuscript at www.biomedcentral.com/submit