R E S E A R C H
Open Access
Utilization of combined remote sensing
techniques to detect environmental variables
influencing malaria vector densities in rural
West Africa
Peter Dambach
1*, Vanessa Machault
2, Jean-Pierre Lacaux
2, Cécile Vignolles
3, Ali Sié
4and Rainer Sauerborn
5,1Abstract
Introduction:The use of remote sensing has found its way into the field of epidemiology within the last decades. With the increased sensor resolution of recent and future satellites new possibilities emerge for high resolution risk modeling and risk mapping.
Methods:A SPOT 5 satellite image, taken during the rainy season 2009 was used for calculating indices by combining the image’s spectral bands. Besides the widely used Normalized Difference Vegetation Index (NDVI) other indices were tested for significant correlation against field observations. Multiple steps, including the detection of surface water, its breeding appropriateness forAnophelesand modeling of vector imagines
abundance, were performed. Data collection on larvae, adult vectors and geographic parameters in the field, was amended by using remote sensing techniques to gather data on altitude (Digital Elevation Model = DEM), precipitation (Tropical Rainfall Measurement Mission = TRMM), land surface temperatures (LST).
Results:The DEM derived altitude as well as indices calculations combining the satellite’s spectral bands (NDTI = Normalized Difference Turbidity Index, NDWI Mac Feeters = Normalized Difference Water Index) turned out to be reliable indicators for surface water in the local geographic setting. WhileAnopheleslarvae abundance in habitats is driven by multiple, interconnected factors - amongst which the NDVI - and precipitation events, the presence of vector imagines was found to be correlated negatively to remotely sensed LST and positively to the cumulated amount of rainfall in the preceding 15 days and to the Normalized Difference Pond Index (NDPI) within the 500 m buffer zone around capture points.
Conclusions:Remotely sensed geographical and meteorological factors, including precipitations, temperature, as well as vegetation, humidity and land cover indicators could be used as explanatory variables for surface water presence, larval development and imagines densities. This modeling approach based on remotely sensed
information is potentially useful for counter measures that are putting on at the environmental side, namely vector larvae control via larviciding and water body reforming.
Keywords:Remote sensing, High spatial resolution, SPOT 5 satellite, Malaria, Rural West Africa, Burkina Faso, Geo-graphic information system, Digital elevation model, MODIS, TRMM
* Correspondence: [email protected]
1Institute of Public Health, University of Heidelberg, Heidelberg, Germany
Full list of author information is available at the end of the article
Background
Malaria is still widespread in Western Africa and results in severe illness, death and hence in economic damage to households and national economy. The desirable overall use of countermeasures and strategies against malaria and its vector, such as use of bed nets, larvicid-ing, habitat reduction etc., is still below the needed amount for showing a remarkable impact.
During the past two decades, remotely sensed data has been used to describe and predict geographical and tem-poral patterns in vector-borne disease transmission and disease prevalence [1-3]. The basic idea behind the remotely sensed assessment of malaria determinants is to define environmental parameters that can be used to identify areas with increased risk. One of the main goals of this approach could be the detection of breeding habitats or the mapping of vector densities through remote sensing techniques, while some other studies linked climate and environmental parameters directly to malaria prevalence [2,4-6]. The suitability of habitats for mosquito larvae breeding is dependent on the presence and distribution of specific environmental variables (i.e., surface water, water related vegetation and distribution and amount of precipitation) [7]. Studies mapping Ano-phelesmosquito breeding habitats, transmission, or dis-ease have been made in Africa [4,8-10] South and Central America [11-14] and Asia [15,16]. Reliable infor-mation about vector density and malaria transmission risk is essential for understanding variations in disease epidemiology and targeting intervention programs,
which are useful tools at the continental and national scales, but are less appropriate in a context of local-scale variations in disease patterns that often vary within a few kilometers distance. Nevertheless, high local varia-tion in malaria epidemiology is particularly common in the Sahel region of Africa, where malaria is character-ized by very focal and seasonal transmission [10,17-19].
In this paper we argue that, for the understanding of local malaria ecology on a high resolution scale, an inte-grated view on multiple influencing factors is helpful, comprising the following objectives:
1. To detect surface water and water-related land cover within the survey region.
2. To assign appropriateness for vector larvae breed-ing to those land cover types.
3. To investigate the influence of environmental and meteorological variables on larvae and adult vector abundance.
4. To predict the adult Anopheles densities in vil-lages using those variables as well as the surrounding densities of larvae.
5. To validate the predicted vectorial risk using ground capturedAnophelesmosquitoes.
Methods
The study site is located in the North-Western part of Burkina Faso in the Kossi district (Figure 1). The study region shows altitudes around 200 m with increasing elevations towards the West. The mean precipitation for
Nouna has been 817 mm per year over a period of the last ten years, with about 90% of annual rainfall during the rainy season (June to September). The monthly maxima during the rainy season can reach up to 350 mm. The yearly average temperature of Nouna is 27.8° C. The North Western savannah regions of Burkina Faso are a malaria holo-endemic area with a marked seasonality. The study took place between July and Sep-tember 2009, in 12 villages of the region (amongst which 10 were covered by the SPOT-5 satellite scene).
Satellite images from the SPOT-5 (Satellite Pour l’ Ob-servation de la Terre) were programmed and acquired for October 12th 2009, during the rainy season. Data included three spectral bands at 2.5 m spatial resolution (green, red and near infrared - NIR). One band for the short wave infrared (SWIR) was also available at 10 m spatial resolution. The three first bands were upscaled to 10 m and stacked with the fourth 10 m band. All images were level 3 pre-processed (orthoimages), with map pro-jection UTM zone 30 N, and datum WGS 84. In the cen-ter of the satellite scene, which was 60 × 60 km, the district capital Nouna is located at 12° 44’N; 3° 51’W.
A Digital Elevation Model (DEM) at 90 m spatial reso-lution was available from the Shuttle Radar Topography Mission (SRTM version 4.1) [20,21]. It was resampled at 10 m spatial resolution.
Weekly day and night Land Surface Temperatures (LST) were extracted from MODIS (Moderate Imaging Spectroradiometer) images at 1 km spatial resolution for the full duration of the field work. The freely available MODIS Reprojection Tool [22] was used to extract LST values and to project the resulting images. The weekly LSTs were averaged for the survey region.
The TRMM (Tropical Rainfall Measurement Mission) daily data at 25 km spatial resolution were downloaded for the duration of the survey period including an addi-tional month, for calculating the cumulated precipita-tions within different time lags before larvae and adult mosquito captures respectively.
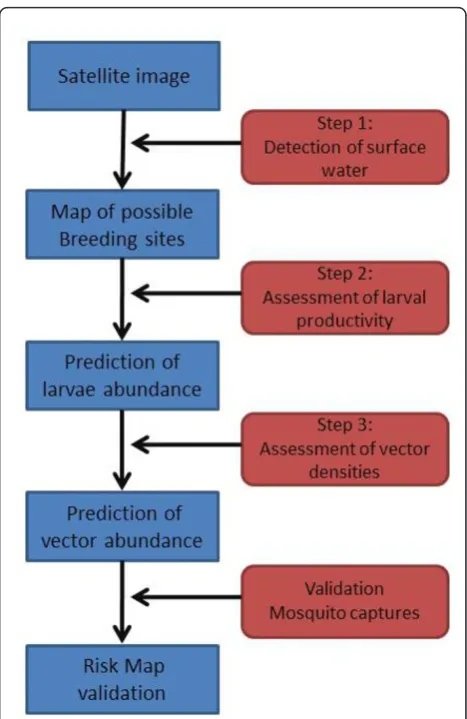
The data analysis was based on the conceptual approach of tele-epidemiology developed by CNES, the French Space Agency [23]i.e. i- assembling and analyz-ing multidisciplinary in-situ datasets to identify the main biological and physical mechanisms at stake in order to highlight the main factors implied in the diseases spatial and temporal distribution; ii- remote-sensing monitoring of environment linking the disease with the parameters previously identified with the aim to obtain well adapted products from space; iii- modeling to generate predictive environmental risk maps (Figure 2). This methodology has been previously applied successfully for the Rift Val-ley Fever in North Senegal [24,25] and for urban malaria in Dakar [26,27]. The basic requirement for malaria to occur is the presence of the vector, Anopheles. The
abundance of larvae and adults is directly linked to the presence, distribution and persistence of water bodies (puddles, ponds...). Based on this knowledge, the first step of this present study was the detection of surface water (hereafter called step 1). The second part (here-after called step 2) analyzed the environmental para-meters in and around the water collections, that could be related to larvae presence and abundance, and the third step (hereafter called step 3) aimed at identifying the relationships between the predicted larval produc-tion, the environmental and meteorological information with the ground recorded Anopheles densities, repre-senting a risk indicator for human population.
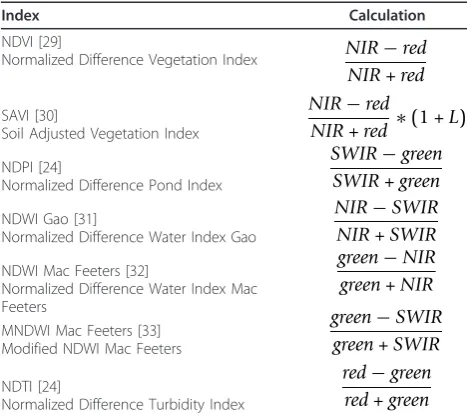
A Geographic Information System was built in ArcGIS 9.3, containing all remotely sensed and field data. All environmental information was extracted at 10 m pixel level or at village level and transferred into Stata 12 (Stata Corporation, College Station, Texas) for statistical modeling. Multiple indices combining different spectral bands were calculated from the SPOT-5 images using
the band math functionality in ENVI 4.7 (Table 1) and tested for statistical association with the presence of sur-face water, Anopheleslarvae and imagines abundance according to the three steps above. Land Use and Land Cover (LULC) from a supervised land cover classifica-tion were available from a previous study [28].
Step 1: Mapping of surface water
Outlines of pools and ponds (locally called“marigots”), in which continuous larvae sampling was performed, were mapped using a GPS device, and transferred to the GIS. Points, further called presence points, were
generated in the center of all 10 m pixels that were overlaid by the shape of a water body, even for small areas. Additional points, called absence points, were ran-domly generated outside of the pools. A total of 482 presence points and 1978 absence points were created. The values of every indicator, as well as the LULC class and the altitude (from the DEM) were extracted at every presence and absence point. The linearity of the rela-tionship between the outcome and each explanatory variable was assessed, except for the elevation that has been included as dichotomous variable. Logistic regres-sions were fitted to identify the remotely sensed envir-onmental variables significantly associated with the presence/absence of water at each point. The inversion of the best multivariate model allowed generating a 10 m resolution map of the probabilities of presence of water in the studied area.
Step 2: Mapping ofAnopheleslarvae
Mosquito larvae at all stages were collected daily from September 2ndto October 23rd 2009 in the 12 study vil-lages (2 vilvil-lages per day with a weekly repetition (Figure 3)). Within and around the villages, the follow-up con-cerned the most common habitats, i.e. the ponds that ranged in size from several meters to hundred meters in diameter. A standardized dipper with 200 ml volume was used to collect larvae.
For each potential breeding site, the environment was taken into account as a mean of the remotely sensed ecological variables computed in and around the water bodies (10 m ring). This scale allowed taking into account the surface (e.g. surface cover as vegetation) and nearby structures (e.g. shade) on potential habitats that could have an impact on the larval presence and density. Meteorological data was tested at different temporal scales until finding the best statistical association with the larvae presence. The linearity of the relationship between the outcome and each explanatory variable was tested.
A negative binomial regression was fitted to identify those remotely sensed environmental and meteorological variables significantly associated with larval density recorded in each water body at each date. The sampling scheme implied that some correlations could exist between observations obtained in a same water collec-tion since repeated observacollec-tions could be influenced by similar environmental factors. Yet, the basic requirement for using classical statistics is the independence of observations and neglecting autocorrelations in the ana-lysis may result in overestimation of the strength of the associations. Thus, a pond random effect was added to the models, to account for variables related to the water collection environment that could be significant deter-minants of the larvae abundance but would not have
Figure 3 Installation of a mosquito light trap and giving instructions to an operator in charge for trap surveillance. Table 1 Different indices combining different spectral bands were tested for statistical association with presence of surface water in step 1 and for correlation with larvae abundance in step 2
Index Calculation
NDVI [29]
Normalized Difference Vegetation Index NIR−red
NIR+red
SAVI [30]
Soil Adjusted Vegetation Index
NIR−red
NIR+red ∗(1 +L)
NDPI [24]
Normalized Difference Pond Index
SWIR−green
SWIR+green
NDWI Gao [31]
Normalized Difference Water Index Gao
NIR−SWIR
NIR+SWIR
NDWI Mac Feeters [32]
Normalized Difference Water Index Mac Feeters
green−NIR
green+NIR
MNDWI Mac Feeters [33] Modified NDWI Mac Feeters
green−SWIR
green+SWIR
NDTI [24]
Normalized Difference Turbidity Index
red−green red+green
been measured in the study. The environmental indica-tors found to be statistically associated with the Ano-pheles larval density were computed and fed back into the GIS, in and around every pond predicted at step 1 of the study in order to predict larvae abundance for the whole study area.
Step 3: Mapping of adultAnopheles
In the 12 villages where the larvae collection took place, adult mosquitoes were captured using light traps. Dur-ing 9 weeks from September to November 2009 villages were visited within the same time schedule as for the larvae collection, with a repetition period of 6 days. Depending on village accessibility, data was available from 5 to 7 visits. Each day, in 2 villages in the same region light traps were installed. In each village 3 places were chosen where a light trap was placed inside and outside a house respectively. Those pairs of light traps were installed in a distance of approximately 100 m from each other to detect possible local differences in vector abundance between different places within one village. The traps inside the houses were installed near the sleeping places if equipped with an untreated bed net, the traps outside were put beside the house within the common patio, where people stay in the evenings (Figure 3). Light traps were connected to the batteries at 6 pm and disconnected and closed at 6 am. All mosqui-toes caught in the light traps were transported to the research centers laboratory for species and gender determination.
The linearity of the relationship between the outcome and each explanatory variable was verified. Then, a negative binomial regression with a village random effect was fitted to predict the density of adult Ano-pheles caught in each village (mean of all the traps) at each date of the ground work using remotely sensed environmental and meteorological predictive variables, as well as larval densities predicted in step 2. As the sampling scheme implied that some correlations could exist between observations from the same village, a ran-dom effect was added at the village level.
To predict the adult Anophelesdensities in non-sur-veyed villages for every day of the study period, the environmental indicators that were found to be statisti-cally associated with the adult Anophelesdensity were computed in buffers of 500 m around the villages, in accordance with the flight range of emerged mosquitoes from their breeding habitat [34-36].
Results
Step 1: Mapping of surface water
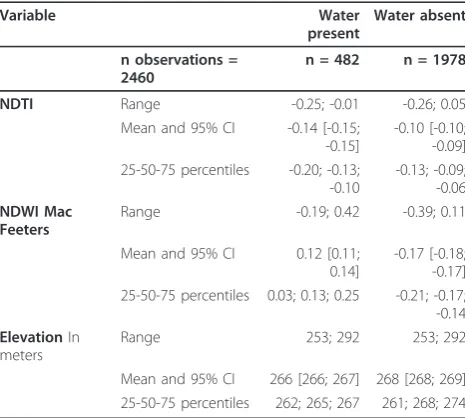
A description of the distribution of the remotely-sensed variables used at this step is presented in Table 2. Sig-nificant correlations were found in uni- and multivariate
analysis between the NDWI Mac Feeters (Normalized Difference Water Index), the NDTI (Normalized Differ-ence Turbidity Index) and the DEM (Digital Elevation Model) amongst 2,460 observations of the presence/ absence of ponds at 10 m pixel level (Table 3). The DEM shows differences in altitude between study vil-lages of about 100 m (Figure 1). Even if the contrast of mean elevation between presence and absence points was low, a significant association was highlighted between a low elevation and an increased probability for the presence of ponds. While the NDWI Mac Feeters was positively correlated with the presence of environ-mental surface water, the NDTI was found to be a pro-tective factor.
Predictions of the probability for the presence of ponds allowed to calculate the area under the ROC (receiver operating characteristic) curve at 0.99 (95% confidence interval: 0.99 - 1.00). The ROC curve is a visualization of the sensitivity, or true positive rate, vs. false positive rate for a binary classifier system whose discrimination threshold is varied. The inversion of the model and the extrapolation for the whole study area allowed generating a map of the probability of presence of water bodies. The application of a cut-off value on those probabilities provided a raster map of the pre-sence/absence of water at 10 m spatial resolution. The filtering (closing filter) and vectorization allowed trans-forming those maps into maps of ponds. A total of 4,600 water bodies were detected which sizes ranged from 100 to about 5,000 m2.
Table 2 Description of the quantitative remotely-sensed explicative variables associated with the presence of ponds
Variable Water
present
Water absent
n observations = 2460
n = 482 n = 1978
NDTI Range -0.25; -0.01 -0.26; 0.05 Mean and 95% CI -0.14 [-0.15;
-0.15]
-0.10 [-0.10; -0.09] 25-50-75 percentiles -0.20; -0.13;
-0.10
-0.13; -0.09; -0.06 NDWI Mac
Feeters
Range -0.19; 0.42 -0.39; 0.11
Mean and 95% CI 0.12 [0.11; 0.14]
-0.17 [-0.18; -0.17] 25-50-75 percentiles 0.03; 0.13; 0.25 -0.21; -0.17; -0.14 ElevationIn
meters
Range 253; 292 253; 292
Step 2: Mapping ofAnopheleslarvae
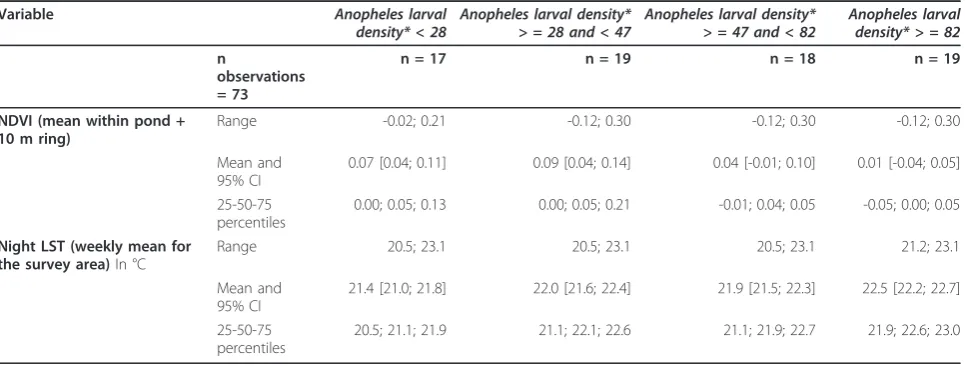
The Anopheleslarvae presence/absence (164 observa-tions positive for larvae and 3 negative) and the larval density were recorded during September-November 2009. A total of 16 ponds were digitized in the GIS. All the observations associated with those 16 collections were included in the analysis, for a total of 73 observa-tions. Description of the distribution of the remotely-sensed and meteorological variables used at this step is provided in Table 4. Results of the environmental and meteorological determinants of the Anopheles larval density recorded during the field work are presented in Table 5.
Those variables significantly associated with the larval density in multivariate analysis were the mean of the NDVI in and around the ponds and the current night Land Surface Temperature (night LST). The NDVI was negatively associated whereas the LST was positively associated with theAnopheleslarval density in ponds.
The results of the likelihood ratio test (p< 0.001) showed that the random effect model was significantly different from a model fitted without accounting for the pond effect. Predictions of the larval densities for each observation allowed the calculation of Spearman correla-tion with the observed densities at 0.55, showing med-ium correlation between the tested variables. Daily maps were drawn by inverting the global model predicting the Anopheles larval density for each water collection detected at step 1, for the full duration of the follow-up. Those maps were used as basis of step 3.
Step 3: Mapping of adultAnopheles
During the study period, 99% of theAnophelescaught in the traps wereAnopheles gambiae s.l. and1%Anopheles funestus. For both species, 89% of caught mosquitoes were female, 11% were male. The total larval production (surface water predicted in step 1 multiplied by the lar-val density predicted in step 2 for a given date) in the Table 3 Environmental factors significantly associated with the presence of ponds in the 10 meter pixels
Logistic regression
Univariate ** Multivariate
Number of obs. = 2460 Coef. 95% CI* p-value Coef. 95% CI* p-value
NDTI
Per unit increase -16.80 -18.91 - -14.69 < 0.0001 -38.81 -43.63 - -28.00 < 0.0001 NDWI Mac Feeters
Per unit increase 34.26 30.55 - 37.98 < 0.0001 43.55 38.54 - 48.77 < 0.0001 Elevation
Inferior to 270 m 1 1
Superior or equal to 270 m -1.03 -1.26 - -0.79 < 0.0001 -1.57 -2.22 - -0.92 < 0.0001
* 95% confidence interval
** Only the variables significantly associated in the multivariate model Logistic regression
Table 4 Description of the quantitative remotely-sensed and meteorological explicative variables associated with Anopheleslarval densities in ponds
Variable Anopheles larval
density* < 28 Anopheles larval density*> = 28 and < 47 Anopheles larval density*> = 47 and < 82 Anopheles larvaldensity* > = 82
n
observations = 73
n = 17 n = 19 n = 18 n = 19
NDVI (mean within pond + 10 m ring)
Range -0.02; 0.21 -0.12; 0.30 -0.12; 0.30 -0.12; 0.30
Mean and 95% CI
0.07 [0.04; 0.11] 0.09 [0.04; 0.14] 0.04 [-0.01; 0.10] 0.01 [-0.04; 0.05]
25-50-75 percentiles
0.00; 0.05; 0.13 0.00; 0.05; 0.21 -0.01; 0.04; 0.05 -0.05; 0.00; 0.05
Night LST (weekly mean for the survey area)In °C
Range 20.5; 23.1 20.5; 23.1 20.5; 23.1 21.2; 23.1
Mean and 95% CI
21.4 [21.0; 21.8] 22.0 [21.6; 22.4] 21.9 [21.5; 22.3] 22.5 [22.2; 22.7]
25-50-75 percentiles
20.5; 21.1; 21.9 21.1; 22.1; 22.6 21.1; 21.9; 22.7 21.9; 22.6; 23.0
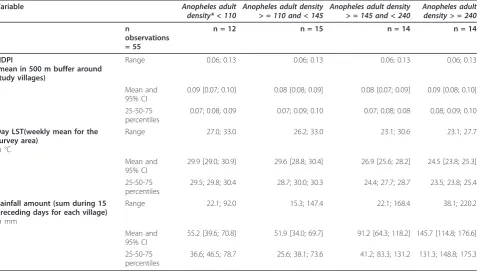
buffers around the villages was not significantly asso-ciated with the number of Anopheles caught in the traps. None of the LULC classes extracted from the supervised classification was associated with the adult densities. Nevertheless, other environmental (NDPI) and meteorological (day LST and rainfall amount) factors were significantly associated with the adult densities (Tables 6 and 7). On the basis of the multivariate nega-tive binomial regression, adultAnophelespredictions for the 10 study villages covered by the SPOT image were made for all capture dates between September 2nd and October 23rd 2009. The comparison with actual values is presented in Figure 4. Figure 5 is the prediction map ofAnophelesvector densities for October, 1st, 2009, for the 37 villages included in the SPOT-image outline.
Discussion
The present study allowed drawing predictive high-reso-lution risk maps for malaria vector abundance in a rural area following three modeling steps: the detection of water bodies, the larvae abundance in those water bodies and the adult Anophelesdensities in villages. In the multivariate models for all three study steps, there was more than one relevant influencing factor for the presence of surface water as well as forAnopheleslarvae and imagines. Due to the close interweavement of fac-tors influencing the surface water presence and vector larvae and imagines abundance, the number of used and combined techniques is comparably higher than in stu-dies that focus on a single step,e.g. detection of appro-priate larval habitats or prediction of vector density. Table 5 Meteorological and environmental factors associated significantly withAnopheleslarval density in ponds
Negative binomial regression with pond random effect
Univariate ** Multivariate
Number of obs. = 73 Number of ponds = 16 Coef. 95% CI * p-value Coef. 95% CI * p-value NDVI
(mean within pond + 10 m ring) Per unit increase
-2.64 -4.93 - -0.34 0.024 -3.20 -5.36 - -1.03 0.004
Night LST
(weekly mean for the survey area) Per °C increase
0.33 0.18 - 0.48 < 0.0001 0.36 0.21 - 0.50 < 0.0001
* 95% confidence interval
** Only the variables significantly associated in the multivariate model Negative binomial regression with pond random effect
Table 6 Description of the quantitative remotely-sensed and meteorological explicative variables associated with the adultAnophelesdensities in villages
Variable Anopheles adult
density* < 110
Anopheles adult density > = 110 and < 145
Anopheles adult density > = 145 and < 240
Anopheles adult density > = 240
n
observations = 55
n = 12 n = 15 n = 14 n = 14
NDPI
(mean in 500 m buffer around study villages)
Range 0.06; 0.13 0.06; 0.13 0.06; 0.13 0.06; 0.13
Mean and 95% CI
0.09 [0.07; 0.10] 0.08 [0.08; 0.09] 0.08 [0.07; 0.09] 0.09 [0.08; 0.10]
25-50-75 percentiles
0.07; 0.08; 0.09 0.07; 0.09; 0.10 0.07; 0.08; 0.08 0.08; 0.09; 0.10
Day LST(weekly mean for the survey area)
In °C
Range 27.0; 33.0 26.2; 33.0 23.1; 30.6 23.1; 27.7
Mean and 95% CI
29.9 [29.0; 30.9] 29.6 [28.8; 30.4] 26.9 [25.6; 28.2] 24.5 [23.8; 25.3]
25-50-75 percentiles
29.5; 29.8; 30.4 28.7; 30.0; 30.3 24.4; 27.7; 28.7 23.5; 23.8; 25.4
Rainfall amount (sum during 15 preceding days for each village) In mm
Range 22.1; 92.0 15.3; 147.4 22.1; 168.4 38.1; 220.2
Mean and 95% CI
55.2 [39.6; 70.8] 51.9 [34.0; 69.7] 91.2 [64.3; 118.2] 145.7 [114.8; 176.6]
25-50-75 percentiles
Step 1: Mapping of surface water
The digital elevation model turned out to be an indica-tor for surface water presence and swampy areas even in the survey region’s setting with little differences in local altitudes, while from survey regions that are more
heterogeneous and hilly this correlation and even its influence on malaria parasite prevalence has already been stated [37]. The NDWI Mac Feeters was positively correlated with the presence of water, in line with the fact that it is an indicator that increases with open Table 7 Meteorological and environmental factors associated with adultAnophelesabundance in Nouna region in September-November 2009
Negative binomial regression with village random effect
Univariate Multivariate
Number of obs. = 55
(Nights withmosquito captures) Number of villages = 10
Coef. 95% CI * p-value Coef. 95% CI * p-value
NDPI
(mean in 500 m buffer around study villages)
Per unit increase 6.01 -1.36 - 13.38 0.110 7.52 0.77 - 14.27 0.029 Day LST
(weekly mean for the survey area)
Per °C increase -0.16 -0.19 - -0.12 < 0.0001 -0.16 -0.20 - -0.12 < 0.0001 Rainfall amount (sum during 15 preceding days for each village)
Per 10 mm increase 0.06 0.04 - 0.08 < 0.0001 NS
* 95% confidence interval
Binomial negative regression with village random effect. Univariate and multivariate analysis
water presence, having been previously used for water detection [26,27]. The NDTI, initially designed to describe water turbidity, increases when water bodies become muddy and have spectral reflectance similar to bare soils [24] so it was logically negatively associated with the presence of water.
The smallest pond recorded on the ground covered one 10 m pixel so the direct water detection - using indices thresholds coupled with photointerpretation [24,25] - was not appropriate. Indeed, it is commonly stated that object detection is feasible only when the object size is at least 1.5 times larger than the pixel size. Instead, statistical modelling allowed to benefit from several remotely sensed data sources that could be put together to predict the probability of presence of ponds. This methodology already proved to be efficient for detection of smallAnophelesbreeding sites in urban set-tings [27]. The pixels that were predicted as belonging to water bodies were grouped into water collections as single objects, as it has been done in the North of Sene-gal for the mapping of ponds harbouring larvae for Rift Valley Fever vectors [24,25]. Indeed, important predic-tors that could further be related to the presence of
larvae, such as shade around the collection, were water body-related. In consequence, they had to be mapped at the level of the water collection and not at the pixel-level.
Step1 took advantage of the availability of a high reso-lution SPOT image that was acquired at the time of the field collections and that allowed to predict the presence of relatively small ponds recorded on the ground. As the image was taken during the rainy season, maximum water collections were predicted, that could further be weighted depending on the season. Even at 90 m spatial resolution, the DEM provided useful information for mapping the surface water and it should be expected that a DEM with an increased spatial resolution would improve the prediction by highlighting small altitude contrasts.
Step 2: MappingAnopheleslarvae
The findings were generally in line with the findings of other studies but show some particularities due to the very high resolution remote sensing approach. The NDVI at this scale turned out to be a hindering factor for larval production in contrast to most studies that utilize satellite imagery at a lower scale [38-40]. As far as the authors are aware, this correlation is unique to this study but may be reverse if changing towards a dif-ferent scale. In the present study, the NDVI could have been a proxy of shade on the water collection or surface vegetation that are both usually related to lower Ano-pheleslarval densities [41-43]. In consequence, the nega-tive association between NDVI and the larval density was coherent with the biological mechanisms of larval development already highlighted in ground studies.
The night LST during the ground prospecting days was significantly positively related to theAnopheles lar-val densities in the water collections. In breeding sites, the entire development cycle from egg to the emerging imago can be completed under favorable conditions. This cycle’s duration can vary between 1 and 3 weeks, depending on water and air temperatures, assuming suf-ficient food availability. Its length shortens with tem-perature increase [44] in accordance with the observation that LST was significantly positively asso-ciated with the density of larvae. Night LST showed stronger correlation than day temperature, probably due to the decreased impact of solar radiation and a more representative portrait of the average water temperature. The cumulated rainfall during the 15 days preceding the day of larvae collection was positively associated with the low/high densities of larvae (results not shown) in univariate analysis. Rainfall patterns steer the avail-ability of surface water for mosquito larvae breeding. In this study, only flooded water collections were included, so rainfall was already taken into account by definition.
Nevertheless, the amount of rainfall could be a proxy for the persistence of water bodies, providing sufficient time for larvae to develop. On the other hand, rainfall might be a surrogate variable for global larval productivity within a region.
Step 2 benefited from the high spatial resolution of the SPOT image and the high temporal resolution of the meteorological data. Indeed, rainfall and temperature were taken into account at coarse spatial resolution (vil-lage and study area levels) which was consistent with scales of the meteorological heterogeneity. Nevertheless, the daily or weekly repetition of data was necessary for evaluating the evolutions of local conditions favourable for larvae development.
Step 3: Mapping adultAnopheles
The multivariate model predicting theAnopheles adult densities at the village level included an environmental and a meteorological variable, which allowed recording of a spatial (using NDPI in 500 m buffers around the villages) effect that differed between villages and a tem-poral effect (using weekly LST).
The NDPI was correlated with the number of cap-tured mosquitoes. Increasing values for the NDPI char-acterize the presence of mixed pixels that show both, water and vegetation. The presence of this mixed envir-onment can be seen as an ideal prerequisite for emer-ging imagines to rest. In consequence, the NDPI was logically associated positively with the Anophelesadult densities.
As a meteorological factor, night LST was not signifi-cantly associated with the adult mosquito density whereas day LST was negatively associated. The higher the day LST, the lower the number of mosquitoes caught, which may indicate higher environmental stress, making it more difficult to survive or search for blood meal. Higher day LSTs in this region also go hand-in-hand with a lower relative humidity, especially during the rainy season. Lower environmental air humidity is less appropriate for mosquitoes survival [45] and blood meal retrieval success [46].
The cumulative amount of rainfall in the 15 preceding days was significantly positively correlated with the adult Anopheles density in univariate analysis. This is likely to be explained by the increased number and extended outlast of larval habitats. It can also be an indicator of humid air conditions that favors adult mos-quito survival.
The prediction for larval densities in environmental habitats within the buffer zone around mosquito capture points (500 m) was not significantly correlated with the imagines abundance. In extrapolating the prediction models for water collections and larval densities to
assess adult Anopheles densities, some errors were accepted, such as follows.
•Randomly created points for the absence of surface water did possibly fall to some extent into zones that were covered with water or had high soil humidity. In consequence, the map of water collec-tion could have been biased. Here, a more detailed study of the situation around the study villages would be needed, with the collection of ground absence points (i.e. absence of water).
•The quality of the validation of the prediction of larval densities with actual ground values was mod-erate, larger field dataset collections may improve the accuracy of the models.
•Working with a single satellite image, the positions and in particular the dimensions of ponds and other surface water were static and did not take into con-sideration the possible change in circumference after rainfalls or longer periods of continuous evaporation. The acquisition of several images could improve this point, as well as the modeling of the size of the ponds depending on rainfall amount and distribution as it has been done in North Senegal [25].
•Step 2 was undertaken to model larval densities, as no multivariate model could have been adjusted to predict the presence/absence of larvae. In conse-quence, the water collections that were not breeding sites could have been misclassified.
Ground entomological data
The field work undertaken in the Nouna region in the 2009 rainy season showed that most of theAnopheles caught in traps were An. gambiae s.l. that are known to be vectors for malaria. In consequence, risk maps drawn in the present study, may be seen as basis information for malaria risk mapping as the location of the vector’s larval habitats and their dynamics are the primary deter-minants of the spatial and temporal distribution of malaria transmission. Then, in addition to this entomo-logical approach, it should be emphasized that malaria transmission occurs only if a competent infected vector meets a sensitive human population; if a Plasmodium reservoir is present.
lower malaria transmission during more than 6 months due to drastically reduction of environmental habitats and rainfall, an extended future study including more survey month could allow to better understand the year round vector dynamics. Still little is known about the vector resting places during dry season and the process of re-emergence in rainy season.
Only the ponds have been followed-up in and around the study villages while small water collections that are known to be seasonally productive breeding sites of An. gambiae s.l. were not included for logistical reasons. It is argued that the larval productivity recorded at pond level may have been a surrogate evaluation of the total productivity in the villages. Nevertheless, it cannot be excluded that the lack of association between larval and adult densities may partly rely on this partial sampling. In addition, the use of light traps to catch adult mosquitoes may have biased the estimates of vector densities -e.g. depending on the density [47] and have introduced noise that could also explain the absence of significant association between the larval and adult densities.
In general, differences in vector abundance between villages may not only be subject to environmental, but also anthropogenic variables. Within the study area, there were no vector control interventions performed during the study year and the use of bed nets was equally distributed. In consequence, no bias was intro-duced when evaluating entomological figures.
Conclusion
Remotely sensed environmental and meteorological data allowed the prediction of water presence in the region of Nouna, as well as the dynamic prediction of Ano-pheleslarval and adult densities. While high resolution satellite data provided possibilities for spatial mapping of vector abundance, the amount and regional distribu-tion of precipitadistribu-tions and the temperature are the dri-vers for vector development; the temporal component of the risk model. The results of the present study could be seen as the basic element of a dynamic system aim-ing at facilitataim-ing real-time monitoraim-ing of human health in rural Burkina Faso. The derived risk maps may keep validity for several years up to a decade, since the geo-graphic factors change only within small limits. Having ground truth data on the region’s characteristic environ-mental features, the extension of this approach to neigh-boring regions should be possible with a significantly reduced need for preparatory fieldwork. With the acqui-sition of additional satellite images and weather data, predictions on vector abundance for bordering areas can be performed. For usage in additional regions, the tech-niques appliance can be probably performed with drasti-cally decreased costs due to the omission of extensive fieldwork components.
Acknowledgements
The SPOT-5 images are provided by the ISIS program from CNES. The project is supported by the French Minsitry of Ecology (MEDDTL) through its program GICC (Gestion et Impacts du Changement Climatique) We are deeply grateful to the people in the study villages for their cooperation and to the local staff of CRSN for their valuable work.
Author details
1Institute of Public Health, University of Heidelberg, Heidelberg, Germany. 2
Observatoire Midi Pyrénées/Laboratoire d’Aérologie, Toulouse, France.
3Centre National d’Etudes Spatiales (CNES), Toulouse, France.4Centre de
Recherche en Santé de Nouna, Nouna, Burkina Faso.5Centre for Global Health Research, Umeå University, Umeå, Sweden.
Authors’contributions
PD contributed to the conception and the design of the study, collected the field data and contributed to the analysis and interpretation of the data and to the writing of the paper. VM contributed to the study design, the analysis and interpretation of the data and wrote the paper. JPL contributed to the conception and the design of the study and the interpretation of the data. CV contributed to the analysis and interpretation of the data. AS contributed to the conception and the design of the study. RS contributed to the conception and the design of the study. All authors read and approved the final manuscript.
Competing interests
The authors have not received any funding or benefits from industry to conduct this study.
Received: 3 January 2012 Accepted: 23 March 2012 Published: 23 March 2012
References
1. Rogers DJ, Randolph SE, Snow RW, Hay SI:Satellite imagery in the study and forecast of malaria.Nature2002,415:710-715.
2. Machault V, Vignolles C, Borchi F, Vounatsou P, Pages F, Briolant S,et al:
The use of remotely sensed environmental data in the study of malaria.
Geospat Health2011,5:151-168.
3. Beck LR, Lobitz BM, Wood BL:Remote sensing and human health: new sensors and new opportunities.Emerg Infect Dis2000,6:217-227. 4. Craig MH, Snow RW, le Sueur D:A climate-based distribution model of
malaria transmission in sub-Saharan Africa.Parasitol Today1999,15:105-111. 5. Snow RW, Craig MH, Deichmann U, le Sueur D:A preliminary continental
risk map for malaria mortality among African children.Parasitol Today 1999,15:99-104.
6. Ceccato P, Connor SJ, Jeanne I, Thomson MC:Application of geographical information systems and remote sensing technologies for assessing and monitoring malaria risk.Parassitologia2005,47:81-96.
7. Clarke KC, McLafferty SL, Tempalski BJ:On epidemiology and geographic information systems: a review and discussion of future directions.Emerg Infect Dis1996,2:85-92.
8. Diuk-Wasser MA, Bagayoko M, Sogoba N, Dolo G, Toure MB, Traore SF,et al:
Mapping rice field anopheline breeding habitats in Mali, West Africa, using Landsat ETM + sensor data.Int J Remote Sens2004,25:359-376. 9. Hay SI, Snow RW, Rogers DJ:Predicting malaria seasons in Kenya using
multitemporal meteorological satellite sensor data.Trans R Soc Trop Med Hyg1998,92:12-20.
10. Thomas CJ, Lindsay SW:Local-scale variation in malaria infection amongst rural Gambian children estimated by satellite remote sensing.
Trans R Soc Trop Med Hyg2000,94:159-163.
11. Beck LR, Rodriguez MH, Dister SW, Rodriguez AD, Rejmankova E, Ulloa A, et al:Remote-sensing as a landscape epidemiologic tool to identify villages at high-risk for malaria transmission.AmJTrop Med Hyg1994,
51:271-280.
12. Beck LR, Rodriguez MH, Dister SW, Rodriguez AD, Washino RK, Roberts DR, et al:Assessment of a remote sensing-based model for predicting malaria transmission risk in villages of Chiapas, Mexico.AmJTrop Med Hyg 1997,56:99-106.
14. Roberts DR, Paris JF, Manguin S, Harbach RE, Woodruff R, Rejmankova E, et al:Predictions of malaria vector distribution in Belize based on multispectral satellite data.AmJTrop Med Hyg1996,54:304-308. 15. Adimi F, Soebiyanto RP, Safi N, Kiang R:Towards malaria risk prediction in
Afghanistan using remote sensing.Malaria Journal2010,9:125-136. 16. Charoenpanyanet A, Chen X:Satellite-based modeling of Anopheles
mosquito densities on heterogeneous land cover in Western Thailand.
The International Archives of the Photogrammetry, Remote Sensing and Spatial Information Sciences2008,37:159-164.
17. Briet OJT, Dossou-Yovo J, Akodo E, van de Giesen N, Teuscher TM:The relationship between Anopheles gambiae density and rice cultivation in the savannah zone and forest zone of Cote d’Ivoire.Trop Med Int Health 2003,8:439-448.
18. Diuk-Wasser MA, Toure MB, Dolo G, Bagayoko M, Sogoba N, Sissoko I,et al:
Effect of rice cultivation patterns on malaria vector abundance in rice-growing villages in Mali.AmJTrop Med Hyg2007,76:869-874.
19. Robert V, Gazin P, Carnevale P:Malaria transmission in three sites surrounding the area of Bobo Dioulasso (Burkina Faso): The savanna, a rice field and the city.Bull Soc Vector Ecol1987,12:41-43.
20. Shuttle Radar Topography Mission. 2011 [http://www2.jpl.nasa.gov/srtm/]. 21. Jarvis A, Reuter HI, Nelson A, Guevara E:Hole-Filled Seamless SRTM data
V4.International Centre for Tropical Agriculture (CIAT); 2008.
22. Land Processes DAAC: MODIS Reprojection Tool User’s Manual. 2011. 23. Marechal F, Ribeiro N, Lafaye M, Guell A:Satellite imaging and
vector-borne diseases: the approach of the French National Space Agency.
Geospatial Health2008,3:1-5.
24. Lacaux JP, Tourre YM, Vignolles C, Ndione JA, Lafaye M:Classification of ponds from high-spatial resolution remote sensing: Application to Rift Valley Fever epidemics in Senegal.Remote Sens Environ2006,106:66-74. 25. Vignolles C, Lacaux JP, Tourre YM, Bigeard G, Ndione JA, Lafaye M:Rift
Valley fever in a zone potentially occupied by Aedes vexans in Senegal: dynamics and risk mapping.Geospat Health2009,3:211-220.
26. Machault V, Gadiaga L, Vignolles C, Jarjaval F, Bouzid S, Sokhna C,et al:
Highly focused anopheline breeding sites and malaria transmission in Dakar.Malaria Journal2009,8:138-159.
27. Machault V:Utilisation de données d’observation de la terre par satellite pour l’evaluation des densités vectorielles et de la transmission du paludisme.Marseille: Université de la méditerranée, Thèse de doctorat, Faculté de médecine de Marseille; 2010.
28. Dambach P, Sie A, Lacaux JP, Vignolles C, Machault V, Sauerborn R:Using high spatial resolution remote sensing for risk mapping of malaria occurrence in the Nouna district, Burkina Faso.Glob Health Action2009,
2, doi:10.3402/gha.v2i0.2094.
29. Rouse JW, Hass RH, Schell JA, Deering DW:Monitoring vegetation systems in the great plains with ERTS1973, 309-317.
30. Huete AR:A soil-adjusted vegetation index (SAVI).Remote Sens Environ 1988,25:295-309.
31. Gao B:NDWI - A normalized difference water index for remote sensing of vegetation liquid water from space.Remote Sens Environ1996,
58:257-266.
32. McFeeters SK:The use of the normalised difference water index (NDWI) in the delineation of open water features.Int J Remote Sens1996,
17:1425-1432.
33. Xu H:Modification of normalised difference water index (NDWI) to enhance open water features in remotely sensed imagery.Int J Remote Sens2006,27:3015-3033.
34. Cho S-H, Lee H-W, Shin E-H, Lee H-I, Lee W-G, Kim C-H,et al:A mark-release-recapture experiment with Anopheles sinensis in the northern part of Gyeonggi-do, Korea.Kor J Parasitol2002,40:139-148.
35. Ejercito A, Urbino M:Flight range of gravid and newly emerged Anopheles.Bulletin of the World Health Organisation1951,4:663-671. 36. Quraishi MS, Esghi N, Faghih MA:Flight range, lengths of gonotrophic
cycles, and longevity of P-32-labeled Anopheles stephensi mysorensis.
J Econ Entomol1966,59:50-55.
37. Balls MJ, Bodker R, Thomas CJ, Kisinza W, Msangeni HA, Lindsay SW:Effect of topography on the risk of malaria infection in the Usambara Mountains, Tanzania.Trans R Soc Trop Med Hyg2004,98:400-408. 38. Rogers DJ:Satellite imagery, tsetse and trypanosomiasis in Africa.Prev
Vet Med1991,11:201-220.
39. Thomson MC, Connor SJ:Environmental information systems for the control of arthropod vectors of disease.Med Vet Entomol2000,
14:227-244.
40. Tourre YM, Jarlan L, Lacaux JP, Rotela CH, Lafaye M:Spatio-temporal variability of NDVI-precipitation over southernmost South America: possible linkages between climate signals and epidemics.Environmental Research Letters2008,3:1-9.
41. Gillies MT, Coetzee M:A supplement to the anophelinae of Africa south of the Sahara (Afrotropical region).Johannesburg: The South African Institute for Medical Research; 1987, 55.
42. Gimnig JE, Ombok M, Kamau L, Hawley WA:Characteristics of larval anopheline (Diptera: Culicidae) habitats in western Kenya.J Med Entomol 2001,38:282-288.
43. Matthys B, N’Goran EK, Kone M, Koudou BG, Vounatsou P, Cisse G,et al:
Urban agricultural land use and characterization of mosquito larval habitats in a medium-sized town of Cote d’Ivoire.J Vector Ecol2006,
31:319-333.
44. Bayoh MN, Lindsay SW:Effect of temperature on the development of the aquatic stages of Anopheles gambiae sensu stricto (Diptera: Culicidae).
Bull Entomol Res2003,93:375-381.
45. Pampana E:A Textbook of Malaria Eradication.London: Oxford Publishing; 1969.
46. Takken W, Dekker T, Wijnholds YG:Odor-mediated flight behavior of Anopheles gambiaeGiles Sensu Stricto andA-stephensiListon in response to CO2, acetone, and 1-octen-3-ol (Diptera: Culicidae).J Insect Behav1997,
10:395-407.
47. Mbogo CN, Glass GE, Forster D, Kabiru EW, Githure JI, Ouma JH,et al:
Evaluation of light traps for sampling anopheline mosquitoes in Kilifi, Kenya.J Am Mosq Control Assoc1993,9:260-263.
doi:10.1186/1476-072X-11-8
Cite this article as:Dambachet al.:Utilization of combined remote sensing techniques to detect environmental variables influencing malaria vector densities in rural West Africa.International Journal of Health Geographics201211:8.
Submit your next manuscript to BioMed Central and take full advantage of:
• Convenient online submission
• Thorough peer review
• No space constraints or color figure charges
• Immediate publication on acceptance
• Inclusion in PubMed, CAS, Scopus and Google Scholar
• Research which is freely available for redistribution
![Figure 1 Digital Elevation Model of the survey region [20]. Classes were built using natural breaks (Jenks-Caspall-algorithm)](https://thumb-us.123doks.com/thumbv2/123dok_us/794713.2075256/2.595.57.539.461.706/figure-digital-elevation-model-classes-natural-caspall-algorithm.webp)