Open Access
M E T H O D O L O G Y
© 2010 Kramer et al; licensee BioMed Central Ltd. This is an Open Access article distributed under the terms of the Creative Commons Attribution License (http://creativecommons.org/licenses/by/2.0), which permits unrestricted use, distribution, and reproduction in any medium, provided the original work is properly cited.
Methodology
Do measures matter? Comparing
surface-density-derived and census-tract-derived
measures of racial residential segregation
Michael R Kramer*
1, Hannah L Cooper
2, Carolyn D Drews-Botsch
1, Lance A Waller
3and Carol R Hogue
1Abstract
Background: Racial residential segregation is hypothesized to affect population health by systematically patterning
health-relevant exposures and opportunities according to individuals' race or income. Growing interest into the association between residential segregation and health disparities demands more rigorous appraisal of commonly used measures of segregation. Most current studies rely on census tracts as approximations of the local residential environment when calculating segregation indices of either neighborhoods or metropolitan areas. Because census tracts are arbitrary in size and shape, reliance on this geographic scale limits understanding of place-health
associations. More flexible, explicitly spatial derivations of traditional segregation indices have been proposed but have not been compared with tract-derived measures in the context of health disparities studies common to social epidemiology, health demography, or medical geography. We compared segregation measured with tract-derived as well as GIS surface-density-derived indices. Measures were compared by region and population size, and segregation measures were linked to birth record to estimate the difference in association between segregation and very preterm birth. Separate analyses focus on metropolitan segregation and on neighborhood segregation.
Results: Across 231 metropolitan areas, tract-derived and surface-density-derived segregation measures are highly
correlated. However overall correlation obscures important differences by region and metropolitan size. In general the discrepancy between measure types is greatest for small metropolitan areas, declining with increasing population size. Discrepancies in measures are greatest in the South, and smallest in Western metropolitan areas. Choice of segregation index changed the magnitude of the measured association between segregation and very preterm birth. For example among black women, the risk ratio for very preterm birth in metropolitan areas changed from 2.12 to 1.68 for the effect of high versus low segregation when using surface-density-derived versus tract-derived segregation indices. Variation in effect size was smaller but still present in analyses of neighborhood racial composition and very preterm birth in Atlanta neighborhoods.
Conclusion: Census tract-derived measures of segregation are highly correlated with recently introduced spatial
segregation measures, but the residual differences among measures are not uniform for all areas. Use of surface-density-derived measures provides researchers with tools to further explore the spatial relationships between segregation and health disparities.
Background
Throughout the twentieth century residential segregation by race and class has been described by sociologists [1-3]. W.E.B. DuBois [4] detailed differences in black mortality by residential neighborhood in Philadelphia, and in the
1950's Yankauer [5] explicitly restated residential tion as a public health concern. More recently segrega-tion has reemerged as a possible "fundamental determinant" [6] of racial disparities in such health out-comes as all-cause mortality [7], preterm birth [8,9], self-rated health [10], obesity [11], survival for individuals with end stage renal disease[12] and stage at cancer diag-nosis [13].
* Correspondence: [email protected]
1 Department of Epidemiology, Rollins School of Public Health, Emory University, Atlanta, GA, USA
Residential segregation can be conceptualized as a descriptive state or condition, or as an active process [14]. As an adjective, 'segregated' describes the degree to which there is departure from a random spatial distribu-tion of racial, ethnic, or economic groups within a city or metropolitan area. Alternatively 'segregate' as a verb evokes an active process of differential sorting of individ-uals into residential environments, thereby influencing their probability of experiencing a range of place-related exposures. Both the condition and the process of segrega-tion may represent geographically variable operasegrega-tional- operational-izations of structural inequality or institutionalized racism, which may be toxic to health, particularly of minority groups [6].
In the health literature, the term 'racial segregation' has been evoked to describe processes and health determi-nants at two distinct geographic scales. Although these scales are related, the implied mechanisms by which seg-regation affects health may be quite different. One line of research, extending from the neighborhood effects litera-ture, evaluates the role of the racial/ethnic composition or density in the neighborhood of residence. Some inves-tigators have hypothesized that residents of predomi-nantly minority neighborhoods disproportionately experience negative health effects resulting from neigh-borhood deprivation, infrastructure disinvestment, or decreased access to health promoting resources including healthy food choices and walkable neighborhoods [15-18]. Other investigators have posited that living in neigh-borhoods with large minority populations is health-pro-tective for minority residents due to the buffering effects of social networks and support in racial/ethnic enclaves [19,20].
While the local neighborhood environment is a critical component of understanding health effects of residential segregation, many researchers argue that the social pro-cesses of interest do not operate solely within neighbor-hoods but across a broader geographic context [21]. For instance metropolitan areas encompass the urban and suburban areas across which the phenomenon of residen-tial segregation occurs, while also capturing economically and socially integrated areas that may have spatially vary-ing economic opportunity [22]. Health research at this broader geographic scale may posit that segregation is not an exposure limited to residents of a few neighbor-hoods, but rather a larger context in which all minority residents have some degree of exposure [23].
With increasing focus on the association between resi-dential segregation and health, researchers have called for a more rigorous and nuanced approach to conceptualiz-ing and measurconceptualiz-ing residential settlement patterns [21,24]. For research focused on racial composition primarily within neighborhoods, the most common measure is the minority population percent in a given areal unit (e.g.
census tract, zip code area, county). This simple measure may be analyzed as a continuous variable assuming linear relationships [25], or acknowledging possible threshold effects of racial composition, it may be analyzed as a binary or categorical variable [26,27].
More measurement tools are available for researchers interested in geographic scales broader than neighbor-hoods (e.g. Metropolitan Statistical areas Areas, MSAs). Of five axes or dimensions of segregation patterns described by Massey and Denton, three are commonly employed in research on segregation and health: even-ness (the degree to which social groups are similarly dis-tributed across areal units in a metropolitan region); exposure/isolation (the likelihood for inter-group interac-tion within local areal units); and clustering (the proxim-ity of areal units with high minorproxim-ity concentration to one another within a metropolitan region) [28].
Whether segregation is measured as an attribute of individual neighborhoods or as an aggregate pattern across all neighborhoods in a metropolitan area, mea-sures of segregation depend on operationalizing the 'resi-dential neighborhood' that corresponds to the spatial scale at which health-relevant social and economic expo-sures operate. The most common definition is the census tract, which is a well-defined areal unit that ideally has a homogeneous population of approximately 1500-8000 residents [29]. However this definition has been critiqued on the basis of the modifiable areal unit problem (MAUP) wherein quantitative results based on data aggregated to small areas depends on both the level of aggregation and which set of small areas are used. Arbitrary changes in tract boundaries could result in different values of mea-sured segregation without real change in residential loca-tion [30,31]. The use of census tracts to proxy neighborhoods presumes that all residents of a tract have a uniform experience of diversity or economic opportu-nity, that boundaries between tracts approximate mean-ingful social or economic boundaries and that residential patterns at smaller or larger scales are not meaningfully different (or relevant) from those at the scale of the tract. These assumptions may be false generally, but the impli-cations could also vary by region of the country or by rel-ative size of metropolitan areas because of historical patterns of urban development in different regions. Pat-terns of both residential segregation and health dispari-ties have been noted to vary by geographic region and metropolitan size [32].
is uniquely defined as the area surrounding that resi-dence, and further allowing the size of that area to be researcher-specified and not constrained to the scale of census geography. To date the relative merit of these new measures of segregation have not been compared to tra-ditional tract-derived measures. Furthermore, the poten-tial effect of exposure misclassification bias resulting from choice of measure in epidemiologic models has not been considered in the context of segregation-health associations.
The goal of this study is to compare tract-derived and spatial surface-density-derived measures of segregation as they might be used in a) studies which focus on segre-gation within MSAs; and b) studies which focus on racial composition as a neighborhood-level effect. Of particular interest is the possibility for meaningful exposure mis-classification or mis-measurement in epidemiologic stud-ies interested in the effects of varying degrees of residential segregation on health outcomes. Previous research suggests there is an association between resi-dential segregation and risk of preterm birth, particularly for black women [8,34,35]. Therefore, to motivate the previous questions, measures of segregation were linked to birth records to assess differences in the magnitude of the segregation-preterm birth association and goodness of model fit using alternate indices of segregation.
Residential segregation can occur across different eco-nomic, racial, and ethnic groups. Acknowledging that most segregation-health research in the United States is focused on black-white segregation, and that many of the largest health disparities in the US are between blacks and whites, we focus this analysis on this particular case.
Methods
Measuring MSA segregation
Following Massey and Denton, we measured evenness segregation with the dissimilarity index, and exposure/ isolation with the black isolation index (xP*x), in each case using census tracts as approximations of the local residential neighborhood. The formulas follow using the notation of Reardon and O'Sullivan [33]:
Tract-derived dissimilarity index
Tract-derived black isolation index
For each equation, i indexes n census tracts within an MSA. π is the proportion black either in the census tract (πi) or in the MSA overall (π). T is the total (black plus white) population count of the MSA, and ti is the total population count for the ith census tract. In each case the
measure is a population-weighted average across all tracts. Each index ranges from 0 (least segregated) to 1 (most segregated). The dissimilarity index compares the racial composition of each tract to the overall MSA com-position and approximates the proportion of blacks who would have to move to a different tract to produce even racial distribution across tracts. The black isolation index approximates the probability that any two randomly drawn individuals from the same tract are both black.
We calculated the surface-density-derived measures using an ArcGIS script developed for the purpose [36]. Following Lee, et al, [30] we converted census block data for white, black, and total population counts to a surface density on a fine grid (50 m × 50 m). Census blocks are the highest resolution population data available. In the Atlanta MSA the median area of census tracts is 1,372 acres, while the median area of census blocks is just 9.6 acres. To more realistically approximate the population distribution in space, we employed a pycnophylactic (mass preserving) smoothing process to reduce abrupt changes in density at block boundaries without artificially shifting population mass across boundaries [37]. All pos-sible locations within a given MSA were thus approxi-mated as the set of all grid points within the MSA on the resulting surface densities (one each for blacks, whites, and total population). To describe the racial composition of the environment around each point (egocentric neigh-borhoods), biweight kernel densities were calculated using varying bandwidths. Thus a 500-meter bandwidth describes the density of blacks (or whites) within a 500-meter radius circle of each point, with Gaussian-like dis-tance decay. Any bandwidth can be specified allowing exploration of the role of the spatial scale of local envi-ronments on the calculation of metropolitan segregation indices. We initially considered 500-, 1000-, 2000-, and 4000-meter bandwidths which may approximate neigh-borhoods ranging from the small, walkable area around one's home (500 m) to a much broader sub-region of the MSA (4000 m) in which economic, educational and social transactions may occur [30,38,39]. We calculated spatial versions of the dissimilarity and the black isolation index using the formulas adapted from those proposed by Rear-don & O'Sullivan [33]:
D ti i T
i n
= −
−
=
∑
p pp p
2 1
1 ( )
(1)
x x i
i n
P ti T
*=
=
∑
p1
(2)
D
p p T p p
p R
~
~
( )
=
−
−
∈
∑
2tpp1 ppSpatial dissimilarity index
Spatial black isolation index
For each calculation, we summed values across all p
points of the 50- by 50-meter grid within region R (the
MSA). The total (black plus white) population density at
each point, p, is indicated by τp, while the proportion
black is denoted either for the entire MSA (π), for a given
point, p(πp), or for the spatial area surrounding point p as
estimated from the kernel density function . One
possible advantage of this flexible approach to the scale of
the local areas in segregation measures is that other axes
or dimensions of segregation may be seen as special cases
of spatial evenness or isolation. Specifically Reardon
argues that the clustering dimension of segregation is
simply evenness (or unevenness) at a broader scale;
there-fore the dissimilarity index could approximate the
tradi-tional evenness dimension using 500-meter or
1000-meter bandwidths and may measure neighborhood
clus-tering using larger bandwidths such as 4000-meters or
greater [33].
Measuring neighborhood segregation
Neighborhood-specific racial diversity (as opposed to MSA segregation) have most commonly been measured using the proportion black in a census tract. However the spatial density approach can be adapted to studies focused on neighborhood effects or analyses of point pro-cesses of geocoded health events. For instance the value of the kernel density for the grid point closest to a geo-coded health event is an estimation of the racial composi-tion (e.g. proporcomposi-tion black) in the spatial area (e.g. 500 m-to 4000 m- radius circle) surrounding that point with greater weight to points closer than those further away.
Data sources
MSA Segregation
We selected for analysis the 231 MSAs with a total popu-lation greater than 100,000 persons and greater than 5,000 black residents in the 2000 decennial census. Met-ropolitan statistical areas are defined as a central city of at least 50,000, and the surrounding counties which are
deemed to be economically and socially integrated with the central city as determined in part by the proportion of outlying county residents who commute to the urban core for employment [40].
To determine the potential for mis-measurement of segregation in the context of a common epidemiologic analysis, we linked birth records to measures of segrega-tion. All singleton live births born to non-Hispanic black or non-Hispanic white women residing in the eligible MSAs in 2000-2002 were abstracted from National Cen-ter for Health Statistics natality files [41]. These births are only coded at the MSA level, not for specific neighbor-hoods or tracts within each MSA. Births were classified as very preterm (gestational age at birth less than 32 weeks) or term (gestational age at birth 37 or more weeks). Very preterm birth was selected as a model out-come because it is a leading cause of infant mortality in the US [42], there is a large racial disparity in risk [43], and there is substantial geographic variation in the mag-nitude of the black-white disparity [44]. It therefore rep-resents a significant public health problem that may be partially understood in terms of geographically varying exposures.
Neighborhood segregation
To examine neighborhood-specific differences in mea-surement we used birth records from a single MSA, Atlanta, Georgia. The twenty-county Atlanta MSA has a large black population, and is notable for the size of the black middle class, and the growing importance of pre-dominantly black and racially mixed suburbs outside the urban core.
We obtained from the Georgia Division of Public Health birth records for all singleton live births born to non-Hispanic black and non-Hispanic white women residing in the region in 2000-2002 with street-level geo-codes. We measured the racial diversity environment of each mother in three ways: using the proportion black in the census tract of residence, using the previously calcu-lated kernel density estimates for the grid point nearest the geocoded residence, and finally using the population weighted average of the kernel density points within each census tract, thus giving a spatial black isolation index for each census tract. This final step of re-aggregating the continuous surface information to the level of the areal census tract may better approximate the average racial diversity environment of each household within a tract by accounting for sub-tract micro-segregation, and incorpo-rating information from adjoining tracts for residents near the border. It also allows exploration of differences between tract-derived and surface-density-derived segre-gation measures when the only available data are health events aggregated to the census tract level.
x x p
p R
P p
T
~ ~
* =
∈
∑
tp (4)
Analysis
We calculated the mean of each index overall and by cen-sus region (Northeast, South, Midwest, West - see Table 1 for states within each region) for measures at all scales, and tested differences in the means across regions using ANOVA. We also calculated the mean and median of the arithmetic differences in segregation measures as the density-derived measure minus the tract-derived mea-sure (e.g. MSA dissimilarity calculated with 500 m-ego-centric neighborhoods minus MSA dissimilarity calculated with tracts). Because the surface-density-derived measures use a constant size neighborhood defi-nition, differences in segregation indices at the metropol-itan level could result from differences in the average size
of census tracts within MSA's. Exploratory analysis sug-gested substantial variation in the median area of census tracts in MSA's and that this variation was strongly asso-ciated with census region and with the total MSA popula-tion count. Therefore we constructed plots of the arithmetic difference in segregation measures against the log of the MSA total population stratified on region.
We fit a series of models to consider the impact that choice of segregation measure has on epidemiologic parameters of interest. Using national birth records we fit Poisson models to estimate the risk of very preterm birth across MSAs as a function of maternal race, metropolitan segregation and--recognizing previously reported racial differences in the effect of segregation--an interaction term between race and segregation. We changed the seg-regation measure entered with each model to include measures of dissimilarity and black isolation, estimated using tract-derived or spatial surface-density-derived (500-meter or 4000-meter egocentric neighborhoods) indices.
Segregation has variously been operationalized in the health literature as a continuous [45], or dichotomous/ categorical variable [46]. Therefore we entered segrega-tion into models as each. Following prior work, the threshold for dichotomizing MSAs as highly segregated versus not was 0.6 for dissimilarity and 0.7 for isolation [47]. In models with segregation as a continuous variable it was mean-centered to facilitate interpretation of model parameters. In other words after centering, an MSA with average segregation would have a value of zero, with less segregated MSAs below zero and more segregated MSAs above zero. We controlled for census region and MSA population size in all models. Risk ratios describe the rel-ative excess risk for a full 1-unit change in segregation (e.g. index 1 vs 0).
We took a similar approach to quantifying the variation in model parameters for births to women in Atlanta neighborhoods. We fit logistic regression models with very preterm birth as the dependent variable, and mater-nal race, neighborhood segregation and an interaction term as independent variables. Because the evenness dimension is not meaningful for a single neighborhood, we only included measures of racial composition and density, which make up the isolation dimension.
All data analysis was conducted using R 2.9 [48].
Results
MSA segregation
For the metropolitan dissimilarity index (evenness dimension of segregation) and the metropolitan isolation index (exposure dimension of segregation), the degree of segregation is highest when the operationalization of the local neighborhood environment is small (e.g. 500 m ego-centric neighborhood) and gets progressively smaller
Table 1: US Census Regions and States
Northeast
Connecticut New York
Maine Pennsylvania
Massachusetts Rhode Island
New Hampshire Vermont
New Jersey
Midwest
Indiana Missouri
Illinois Nebraska
Iowa North Dakota
Kansas Ohio
Michigan South Dakota
Minnesota Wisconsin
South
Alabama Maryland
Arkansas Mississippi
Delaware North Carolina
District of Columbia Oklahoma
Florida South Carolina
Georgia Tennessee
Kentucky Texas Virginia
Louisiana West Virginia
West
Arizona Nevada
California New Mexico
Colorado Oregon
Hawaii Utah
Idaho Washington
with larger definitions of neighborhood (Table 2, Figure 1). As seen in Figure 1, on average census tracts appear equivalent to a 2000 m-egocentric neighborhood. Indices which differ by their definition of neighborhood scale are highly correlated (Figure 2). For the dissimilarity index the correlation is 0.9 to 0.95, and for isolation it is higher.
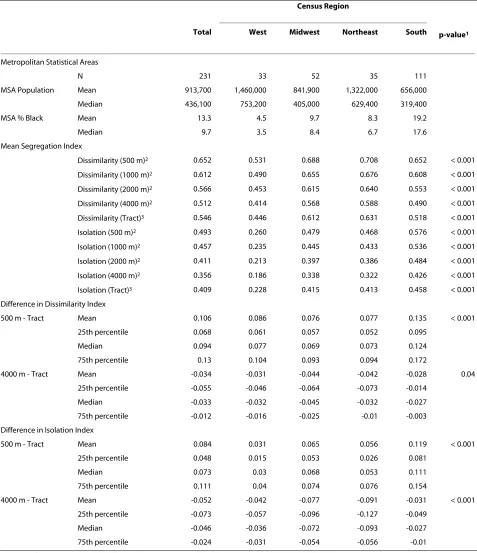
The degree of residential segregation varies signifi-cantly by region of the country (Table 2). While the West-ern MSA's have the highest median population count, they also have the lowest proportion black, and the low-est average values on all measures of black-white segrega-tion. In contrast the Southern MSA's have the smallest median population count, the highest proportion black, but not necessarily the highest segregation. Isolation (which is sensitive to the MSA proportion black) is in fact highest on average in the South, but dissimilarity is lower in the South than either Northeastern or Midwestern MSA's across all neighborhood definitions.
The average arithmetic differences between segregation indices also vary by region. The largest differences com-paring small egocentric neighborhoods (500 m) to census tracts is in the Southern MSA's for both the isolation (mean change 0.12) and dissimilarity (mean change 0.14) indices. In contrast the largest difference for dissimilarity between large egocentric neighborhoods (4000 m) and census tracts is in the Midwestern MSA (mean change
-0.04), but for isolation the largest difference is in the Northeastern MSAs (mean change -0.09).
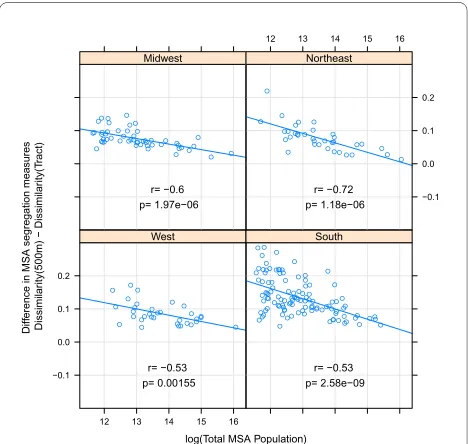
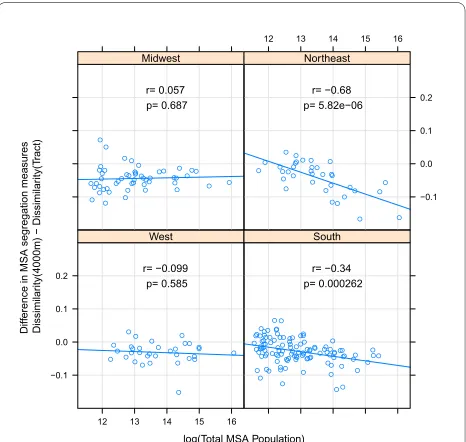
In addition to systematic differences by regions, there are also important differences in measurement change by MSA population size. Comparing small egocentric neigh-borhoods to census tracts, the difference in either isola-tion or dissimilarity decreases with increasing populaisola-tion size in all regions with the exception of isolation in West-ern MSAs (Figures 3 &4). The differences are less consis-tent when comparing 4000 m egocentric neighborhoods to tracts where the strongest association with population size is evident in the Northeastern MSA's (Figures 5 &6).
Table 3 reports results from Poisson models of the asso-ciation between segregation and very preterm birth across 231 MSAs. Parameters of interest include the independent association of segregation with very preterm birth using each segregation index, the magnitude of the black-white disparity with inclusion of segregation, and the interaction between maternal race and segregation. Because race is coded black = 1 and white = 0, the main effect of the segregation parameter represents the relative change in risk for white mothers exposed to a highly seg-regated MSA as compared to a minimally segseg-regated
Figure 1 Distribution of MSA residential segregation measured
with five definitions of neighborhood environment. Median value indicated by filled black dot, 25th and 75th percentile indicated by the
lower and upper ends of the box, whiskers are 1.5 times the inter-quartile range, and outliers are hollow dots beyond whiskers.
Scale of Measured Residential Environment
Metropolitan Segregation Inde
x 0.0 0.2 0.4 0.6 0.8
500m 1000m 2000m Tract 4000m
● ● ● ● ● ● ● ● ● ● ● ● ● ● ● ● Dissimilarity
500m 1000m 2000m Tract 4000m
● ●
● ●
● Isolation
Figure 2 Correlation of MSA black-white segregation indices.
His-tograms (on the diagonal) and correlations (plots below diagonal, Spearman rank correlation coefficients above the diagonal) of segre-gation indices for 231 US MSA's, 2000. P-values for all pair wise correla-tions are < 0.0001. (Diss-tract: census tract-derived dissimilarity index; Diss-500 m, Diss-4000 m: surface-density-derived dissimilarity index for MSA's with neighborhoods defined with a 500 m or 4000 m kernel density function; Iso-tract: census tract-derived isolation index; Iso-500 m, Iso-4000 m: surface-density-derived isolation index for MSA's with neighborhoods defined with a 500 m or 4000 m kernel density func-tion)
Diss−tract 0.4 0.6 0.8
0.90 0.95 0.2 0.6 0.62 0.50 0.0 0.4 0.3 0.5 0.7 0.50 0.4 0.6 0.8 ● ● ● ● ● ● ● ● ● ● ● ● ● ● ● ● ● ● ● ●●●● ● ● ● ● ● ● ● ● ● ● ● ● ● ● ● ● ● ● ● ● ● ● ● ●● ● ● ● ● ● ● ● ●●● ● ● ● ● ● ● ● ● ● ● ● ● ● ● ● ● ● ● ● ● ● ● ● ● ● ● ●● ● ● ● ● ● ●●●● ● ● ● ● ● ●● ● ● ● ● ● ● ● ●● ●● ● ● ● ● ● ● ● ●●●● ●●● ● ● ● ● ● ● ● ● ● ● ● ● ● ● ● ● ● ● ● ● ● ● ● ● ● ● ● ●● ● ● ● ●● ●● ● ● ● ● ● ● ● ● ● ● ● ●● ● ● ● ● ● ● ● ●● ● ●● ● ● ● ● ● ● ● ● ● ● ● ● ● ● ● ● ● ● ● ● ● ● ● ● ● ● ● ●● ● ● ● ● ●●● ● ● ●● ●
● ● Diss−500m
0.91 0.68 0.66 0.61
● ● ● ● ● ● ● ● ● ● ● ● ● ● ● ● ●● ● ●● ● ● ● ● ● ● ● ● ●● ● ● ● ● ● ● ● ● ● ● ● ● ● ● ●●● ● ● ● ● ● ● ● ● ● ● ● ● ● ● ● ● ● ● ● ● ● ● ● ● ● ● ● ● ● ● ● ● ● ● ● ● ● ● ● ● ● ● ● ● ● ● ● ● ● ● ● ● ● ● ● ● ● ● ● ● ● ● ● ● ● ● ● ● ● ● ● ● ● ● ● ● ● ● ● ● ● ● ● ● ● ● ●● ● ● ● ● ● ●●●●● ● ● ● ● ● ● ● ● ● ● ● ● ● ●● ●● ● ● ●● ● ● ● ● ● ● ● ● ● ● ● ● ● ● ● ● ●● ● ●● ● ● ● ● ● ● ●● ● ● ● ● ● ● ● ● ● ● ● ● ● ● ● ● ● ● ● ● ● ● ● ● ● ● ●●● ● ● ● ● ●● ● ● ● ● ● ● ● ● ● ● ● ● ● ●● ● ● ● ● ●● ● ● ● ● ● ● ● ● ●● ● ● ●● ● ● ● ● ● ● ● ● ● ● ●●● ● ● ● ● ● ● ● ● ● ● ● ● ● ● ● ● ● ● ● ● ●●● ● ● ● ● ● ● ● ● ● ● ● ● ● ● ● ● ● ● ● ● ● ● ● ● ● ●● ● ● ● ● ● ● ● ● ● ● ● ● ● ● ● ● ● ● ● ● ● ● ● ● ● ● ● ● ● ● ● ● ● ● ● ● ●● ● ● ● ● ● ● ● ●●● ● ● ● ● ● ● ● ● ● ● ● ● ● ●● ● ● ● ● ●● ● ● ● ● ● ● ● ● ● ● ● ● ● ● ● ● ●● ● ●● ● ● ● ● ● ● ● ● ● ● ● ● ● ● ● ● ● ● ● ● ● ● ● ● ● ● ● ● ● ● ● ● ●● ●●● ● ● ● ●
●● Diss−4000m
0.56 0.47 0.3 0.5 0.7 0.48 0.2 0.6 ● ● ● ● ● ● ● ● ● ● ● ● ● ● ● ● ● ● ● ●●●● ● ● ● ● ● ● ● ● ● ● ● ● ● ● ● ● ● ● ● ● ● ● ● ● ● ● ● ● ● ● ● ● ● ● ● ● ● ● ● ● ●●● ● ● ● ● ● ● ● ● ● ● ● ● ● ● ● ● ● ● ● ● ● ● ● ● ● ● ● ● ● ● ● ● ● ● ● ● ● ● ● ● ● ● ● ● ● ● ● ● ● ● ● ● ● ● ● ● ● ● ● ● ● ● ● ● ● ● ● ● ● ● ● ● ● ● ● ● ● ●●● ● ●●● ● ● ● ●●● ● ● ● ●● ● ● ● ● ●● ● ● ● ● ● ● ● ●● ● ● ● ● ● ● ● ●●● ●● ● ● ● ● ● ● ● ● ● ● ● ● ● ● ● ● ● ● ● ● ● ● ● ● ● ● ● ● ● ● ● ● ● ● ● ● ● ● ● ● ● ● ● ● ● ● ● ● ● ● ● ● ● ● ● ● ● ● ● ● ● ● ●●●● ● ● ● ● ● ● ● ● ● ● ● ● ● ● ● ● ● ● ● ● ●● ● ● ● ● ● ● ● ● ● ● ●● ● ● ● ●● ● ●●● ● ● ● ● ● ● ● ● ● ● ● ● ●● ● ● ● ● ● ●● ● ● ● ● ● ● ● ●● ● ● ● ● ● ● ● ● ● ● ● ● ● ● ● ● ● ● ● ● ● ● ● ● ● ● ● ● ● ● ● ● ● ● ● ● ● ● ● ● ● ● ● ● ● ● ● ●●● ● ●●● ● ●● ● ●● ● ● ● ●● ● ● ● ● ●● ● ● ● ● ● ● ● ●● ● ● ● ● ● ● ● ●●● ●● ● ● ● ● ● ● ● ● ● ● ● ● ● ● ● ● ● ● ● ● ● ● ● ● ● ●●● ● ● ● ● ● ● ● ● ● ● ● ● ● ● ● ● ● ● ● ● ● ● ● ● ● ● ● ● ● ● ● ● ● ●● ● ●● ● ● ● ● ● ● ● ● ● ● ● ● ● ● ● ● ● ● ● ● ● ● ● ● ● ● ● ● ● ● ●● ● ● ● ● ● ● ● ● ●●● ● ● ● ●● ● ● ● ● ● ● ● ● ● ● ● ● ● ● ● ● ● ● ● ● ● ● ● ● ● ● ● ● ● ● ● ● ● ● ● ● ● ● ● ● ● ● ● ● ● ● ● ● ● ● ● ● ● ● ● ● ● ● ● ● ● ● ● ● ● ● ● ● ● ● ● ● ●●● ● ●●● ● ● ● ● ● ● ● ● ● ●● ● ● ● ● ●● ● ● ● ● ● ● ● ●● ● ● ● ● ● ● ● ●● ● ● ● ● ● ● ● ● ● ● ● ● ● ● ● ● ● ● ● ● ● ● ● ● ● ● ● ● ● ● ● ● ● ● ● ● ● ● ● ● ● ● ● ● ● ● Iso−tract 0.96 0.97 ● ● ● ● ● ● ● ● ● ● ● ● ● ● ● ● ● ● ● ●●● ● ● ● ● ● ● ● ● ● ● ● ● ● ● ● ● ● ● ● ● ● ● ● ●● ● ● ● ● ● ● ●● ●● ● ● ● ● ● ● ● ●● ● ● ● ● ● ● ● ● ● ● ● ● ● ● ● ● ● ● ● ● ● ● ● ● ● ● ● ● ● ● ● ● ● ● ● ● ● ● ● ● ● ● ● ●● ● ● ● ● ● ● ● ● ● ● ●● ● ● ● ● ● ● ● ● ● ● ● ● ● ● ● ● ● ● ● ● ●●● ● ●●● ● ● ● ●●● ● ● ● ● ● ● ● ● ● ●● ● ● ● ● ● ● ● ●● ● ● ● ● ● ● ● ● ●● ●● ● ● ● ● ● ● ● ● ● ● ● ● ● ● ● ● ● ● ● ● ● ● ● ● ● ● ● ● ● ● ● ● ● ● ● ● ● ● ●● ● ● ● ● ● ● ● ● ● ● ● ● ● ● ● ● ● ● ● ● ● ●●●● ● ● ● ● ● ● ● ● ● ● ● ● ● ● ● ● ● ● ● ● ● ● ● ●● ● ● ● ● ● ● ●● ●● ● ● ● ●● ● ●●● ● ● ● ● ● ● ● ● ● ● ● ● ● ● ● ● ● ● ● ● ● ● ● ● ● ● ● ● ● ● ● ● ● ● ● ● ● ● ● ● ● ● ● ● ● ● ● ● ● ● ● ● ● ● ●●● ● ● ● ● ● ● ● ● ● ● ● ● ● ● ● ● ● ● ● ● ●●● ● ● ●● ● ●● ● ●● ● ● ● ● ● ● ● ● ● ●● ● ● ● ● ● ● ● ●● ● ● ● ● ● ● ● ● ●● ●● ● ● ● ● ● ● ● ● ● ● ● ● ● ● ● ● ● ● ● ● ●● ● ● ● ● ● ● ● ● ● ● ● ● ● ● ● ● ● ●● ● ● ● ● ● ● ● ● ● ● ● ● ● ● ● ● ● ● ● ● ●● ●● ● ● ● ● ● ● ● ● ● ● ● ● ● ● ● ● ● ● ● ● ● ● ● ●● ● ● ● ● ● ● ●● ● ● ● ● ● ● ● ● ●●● ● ● ● ● ● ● ● ● ● ● ● ● ● ● ● ● ● ● ● ● ● ● ● ● ● ● ● ● ● ● ● ● ● ● ● ● ● ● ● ● ● ● ● ●● ● ● ● ● ● ● ● ● ● ●●● ● ● ● ● ● ● ● ● ● ● ● ● ● ● ● ● ● ● ● ● ●●● ● ●● ● ● ● ● ● ● ● ● ● ● ● ● ● ● ● ● ●● ● ● ● ● ● ● ● ●● ● ● ● ● ● ● ● ● ● ● ● ● ● ● ● ● ● ● ● ● ● ● ● ● ● ● ● ● ● ● ● ● ● ● ● ● ● ● ● ● ● ● ● ● ● ● ● ● ● ● ● ● ● ● ● ● ● ● ● ● ● ● ● ● ● ● ● ● ● ● ● ● ● ● ● ● ● ● ● ● ● ● ● ● ● ● ● ●● ● ● ● ● ● ● ● ● ● ● ● ●● ● ● ● ● ● ● ● ● ● ● ● ● ● ●● ● ●● ● ● ● ● ● ● ● ● ● ● ● ● ● ● ● ● ● ● ● ● ● ● ● ●● ● ● ● ● ● ● ● ● ● ● ● ● ● ●● ● ● ● ● ● ● ● ● ● ●● ●● ● ● ●●● ● ● ● ● ● ● ● ● ● ● ● ● ● ● ● ● ● ● ● ●● ● ● ● ● ●● ● ●● ● ●●● ● ● ●●● ● ● ● ●● ● ● ● ● ● ● ● ● ● ● ● ● ●● ● ● ● ●● ● ● ● ● ● ●● ● ● ● ● ● ● ● ● ● ● ● ● ● ● ● ● ● ● ● ● ● ● ● ●● ● ● ● ● ● ● ● ● ●● ● ● ● Iso−500m 0.2 0.6 0.97
0.3 0.5 0.7
0.0 0.4 ● ● ● ● ● ● ● ● ● ● ● ● ● ● ● ● ● ● ● ●●● ● ● ● ● ● ● ● ● ● ● ● ● ● ● ● ● ● ● ● ● ● ● ● ●● ● ● ● ● ● ● ●● ● ● ● ● ● ● ● ● ● ●● ● ● ● ● ● ● ● ● ● ● ● ● ● ● ● ● ● ● ● ● ● ● ● ● ● ● ● ● ● ● ● ● ● ● ● ● ● ● ● ● ● ● ● ●● ● ● ● ● ● ● ● ● ● ● ● ● ● ● ● ● ● ● ● ● ● ● ● ● ● ● ● ● ● ● ● ● ● ● ● ● ●●● ● ● ● ●●●● ● ● ● ● ● ● ● ● ●● ● ● ● ● ● ● ● ●● ● ● ● ● ● ● ● ● ● ● ●● ● ● ● ● ● ● ● ● ● ● ● ● ● ● ● ● ● ● ● ● ● ● ● ● ● ● ● ● ● ● ● ● ● ● ● ● ● ● ●● ● ● ● ● ● ● ● ● ● ● ● ● ● ● ● ● ● ● ● ● ● ● ●●● ● ● ● ● ● ● ● ● ● ● ● ● ● ● ● ● ● ● ● ● ● ●● ●● ● ● ● ● ● ● ●● ●● ● ● ● ●● ● ●●● ● ● ● ● ●●● ● ● ● ● ● ● ● ● ● ● ● ● ●● ● ● ● ● ● ● ● ● ● ● ● ● ● ● ● ● ● ● ● ● ● ● ●● ● ● ● ● ● ● ● ● ● ● ● ● ● ● ● ● ● ● ● ● ● ● ● ● ● ● ● ● ● ● ● ● ● ● ● ● ●●● ● ●● ● ● ● ● ● ● ● ● ● ● ● ● ● ● ● ● ● ● ● ● ● ●● ● ● ● ● ● ● ● ● ● ● ●● ● ● ● ● ● ● ● ● ● ● ● ● ● ● ● ● ● ● ● ● ●● ● ● ● ●●● ● ● ● ● ● ● ● ● ● ● ● ● ● ● ●
0.3 0.5 0.7
Table 2: Black-White residential segregation measures for 231 US Metropolitan Statistical Areas, 2000
Census Region
Total West Midwest Northeast South p-value1
Metropolitan Statistical Areas
N 231 33 52 35 111
MSA Population Mean 913,700 1,460,000 841,900 1,322,000 656,000
Median 436,100 753,200 405,000 629,400 319,400
MSA % Black Mean 13.3 4.5 9.7 8.3 19.2
Median 9.7 3.5 8.4 6.7 17.6
Mean Segregation Index
Dissimilarity (500 m)2 0.652 0.531 0.688 0.708 0.652 < 0.001
Dissimilarity (1000 m)2 0.612 0.490 0.655 0.676 0.608 < 0.001
Dissimilarity (2000 m)2 0.566 0.453 0.615 0.640 0.553 < 0.001
Dissimilarity (4000 m)2 0.512 0.414 0.568 0.588 0.490 < 0.001
Dissimilarity (Tract)3 0.546 0.446 0.612 0.631 0.518 < 0.001
Isolation (500 m)2 0.493 0.260 0.479 0.468 0.576 < 0.001
Isolation (1000 m)2 0.457 0.235 0.445 0.433 0.536 < 0.001
Isolation (2000 m)2 0.411 0.213 0.397 0.386 0.484 < 0.001
Isolation (4000 m)2 0.356 0.186 0.338 0.322 0.426 < 0.001
Isolation (Tract)3 0.409 0.228 0.415 0.413 0.458 < 0.001
Difference in Dissimilarity Index
500 m - Tract Mean 0.106 0.086 0.076 0.077 0.135 < 0.001
25th percentile 0.068 0.061 0.057 0.052 0.095
Median 0.094 0.077 0.069 0.073 0.124
75th percentile 0.13 0.104 0.093 0.094 0.172
4000 m - Tract Mean -0.034 -0.031 -0.044 -0.042 -0.028 0.04
25th percentile -0.055 -0.046 -0.064 -0.073 -0.014
Median -0.033 -0.032 -0.045 -0.032 -0.027
75th percentile -0.012 -0.016 -0.025 -0.01 -0.003
Difference in Isolation Index
500 m - Tract Mean 0.084 0.031 0.065 0.056 0.119 < 0.001
25th percentile 0.048 0.015 0.053 0.026 0.081
Median 0.073 0.03 0.068 0.053 0.111
75th percentile 0.111 0.04 0.074 0.076 0.154
4000 m - Tract Mean -0.052 -0.042 -0.077 -0.091 -0.031 < 0.001
25th percentile -0.073 -0.057 -0.096 -0.127 -0.049
Median -0.046 -0.036 -0.072 -0.093 -0.027
75th percentile -0.024 -0.031 -0.054 -0.056 -0.01
1. P-value from ANOVA analysis of mean values across census regions.
MSA. Within dimensions of segregation the estimated risk ratio is negligible and varies modestly, ranging from 0.91 to 0.95 for continuously measured dissimilarity, from 0.91 to 0.96 for isolation, and similarly for dichotomized segregation indices.
In contrast to the very small differences in effect-size estimates for white women, the interaction term between race and segregation (indicating the excess relative risk experienced by black women above and beyond the main effect of exposure to high versus low segregation) varies more widely. The risk ratio for the segregation-race inter-action term is 1.68, 2.12, and 1.69 when segregation is measured using tract-derived dissimilarity, 500-meter or 4000-meter surface-density-derived dissimilarity respec-tively. This represents a 39% change in the size of the effect estimate. When segregation is modeled as a binary hi/low variable the effect across all measures is smaller but still variable by choice of index. The results of the interaction term are most interpretable when combined with the independent effects of race and segregation. As discussed the independent effect of segregation varied lit-tle by measure, but the independent effect of race (the excess relative risk for very preterm birth among black as compared with white mothers) was most variable when dissimilarity segregation was modeled as a dichotomous
variable, where risk ratios range from 2.80 to 2.99, a mea-sured effect estimate change of 9.5%.
The deviance from each model is a measure of relative fit with smaller values suggesting better fit. Comparing each segregation measure to the baseline model which included only race, region, and population size, the larg-est reduction in deviance (blarg-est fit) occurs with dissimilar-ity or isolation measured with 500-meter egocentric neighborhoods (change in deviance is 156 for dissimilar-ity, and 141 with isolation).
Neighborhood segregation
Figure 7 displays maps of the neighborhood racial com-position using each method of measuring segregation in neighborhoods across the Atlanta MSA. Panel A is the proportion black in each census tract; panel B is the results of surface-density-derived local proportion black using 500-meter egocentric neighborhoods; Panel C is the resulting segregation values when the 500-meter sur-face-density-derived values are aggregated to the level of census tracts using population-density weighting; panel D is the 4000-meter surface-density-derived pattern. Most black residents of Atlanta live in the central and central-southern portion of the MSA, although the pat-tern varies somewhat by measure. The micro-segregation within tracts is most visible using the 500-meter measure,
Figure 3 Difference in MSA dissimilarity index when measured
using 500 m-egocentric neighborhood versus census tract by re-gion. The arithmetic difference of MSA segregation calculated with 500-meter bandwidth surface-density-derived dissimilarity index as compared with census-tract derived dissimilarity is plotted on the y-ax-is; log of MSA total population count in 2000 is plotted on x-axis. Pear-son correlation coefficient is 'r', and corresponding p-value. Line is best fit linear regression. Panels represent MSA's within each of four census regions.
log(Total MSA Population)
Diff
erence in MSA segregation measures
Dissimilar
ity(500m) − Dissimilar
ity(T
ract)
−0.1 0.0 0.1 0.2
12 13 14 15 16 ●
● ● ●
● ● ●
● ●
● ●
●●● ● ●
● ● ●
● ● ● ● ●
● ● ●
● ●● ●
● ●
r= −0.53 p= 0.00155
West
● ● ●
● ●
● ●
● ●
● ● ● ● ●
● ● ●
●
● ●
● ● ● ●
● ●
● ●
● ● ● ●
● ● ● ●
● ● ● ● ●
● ●
● ●
● ●
● ●
● ●
● ●●● ● ●
● ● ●
● ●
● ●
● ● ●
● ● ●
● ● ● ● ● ●
● ●
● ●
● ● ● ● ● ● ● ●
● ●
● ● ●
● ● ●
● ● ●
●
● ●
● ●●
●
● ● ● ●
●
r= −0.53 p= 2.58e−09
South
● ● ● ●● ●
● ● ● ●
● ●
● ●
●
● ●
● ●● ● ● ●
● ●
● ● ● ●
● ●
● ● ●
● ● ●
● ● ●
●● ● ●
● ● ●● ● ● ●●
r= −0.6 p= 1.97e−06
Midwest
12 13 14 15 16
−0.1 0.0 0.1 0.2
● ● ●
● ●
● ● ● ●
● ● ● ●
● ●● ● ● ●
● ● ●
● ● ● ●
● ● ●
● ● ● ● ●
●
r= −0.72 p= 1.18e−06 Northeast
Figure 4 Difference in MSA isolation index when measured using
500 m-egocentric neighborhood versus census tract by region. The arithmetic difference of MSA segregation calculated with 500-me-ter bandwidth surface-density-derived isolation index as compared with census-tract derived isolation is plotted on the y-axis; log of MSA total population count in 2000 is plotted on x-axis. Pearson correlation coefficient is 'r', and corresponding p-value. Line is best fit linear regres-sion. Panels represent MSA's within each of four census regions.
log(Total MSA Population)
Diff
erence in MSA segregation measures Isolation(500m) − Isolation(T
ract)
−0.1 0.0 0.1 0.2
12 13 14 15 16 ●
● ● ● ●
● ●
● ●
●
● ●
● ● ● ●● ● ●
●●● ● ●●
● ●
● ●● ● ● ●
r= 0.042 p= 0.818 West
● ● ●
● ●
● ●
● ●
● ● ● ● ●
● ● ● ●
● ●
● ● ● ●
● ●
● ●
● ● ● ●
● ● ● ●
● ● ● ● ●
● ●
● ●
●
● ●
● ● ●
● ●● ● ● ● ●
● ● ● ●
●
● ● ● ●
● ● ●
● ●
● ● ● ●
● ●
● ●●● ●
● ●
● ● ● ●
● ● ● ●
● ● ●
● ● ●
●
● ●
● ●●
●
● ● ●
● ●
r= −0.43 p= 3.31e−06
South
● ● ● ●
● ●
● ●
● ●
● ●
● ●
●
● ●
● ●●
● ● ●
● ●
● ● ●
● ● ●
● ● ●
● ● ● ● ●●● ●
● ●
● ● ●● ● ● ●●
r= −0.49 p= 0.000195
Midwest
12 13 14 15 16
−0.1 0.0 0.1 0.2
● ● ●
● ●
● ● ● ●
● ● ● ●
● ● ●
● ● ●
● ● ●
● ● ● ●
● ● ●
● ● ● ● ●
●
and it is likely this micro-segregation within tracts which results in the increased number of mixed-race and pre-dominantly black tracts in panel C compared to A.
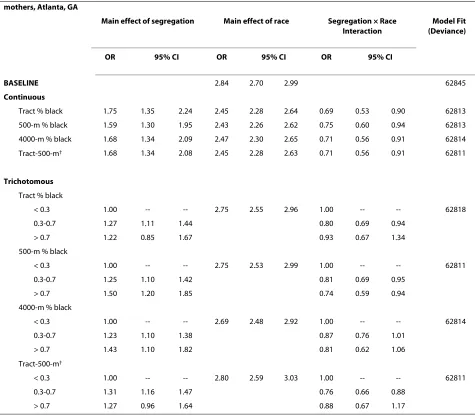
Table 4 summarizes results from logistic regression models of the association between neighborhood racial composition and odds for very preterm birth among black and white mothers. In contrast to MSA segregation, the main effect of segregation suggests the odds for very preterm birth increase for white mothers as neighbor-hood proportion black increases. For black mothers, the odds of very preterm birth also increases as neighbor-hood proportion black increases, but it does so less steeply than for whites, as demonstrated by the odds ratio for the interaction effect below the null value of 1.0. In other words, the 'protective' interaction term describes the tempering of the main effect of segregation experi-enced by black women, but in the case of each segrega-tion index, the main effect is so strongly deleterious that the net result is still higher risk for blacks and for whites as segregation increases.
For both continuous and categorical parameterizations of segregation, there is important variation in effect size estimates depending on the measure chosen. For instance the odds ratio for high versus low segregation measured continuously at the tract level is 1.75 (95% CI 1.35-2.24),
while the odds ratio for 500-meter surface-density-derived isolation is 1.59 (1.30-1.95), a 21% change in effect-size estimate; the magnitude of the interaction term is similarly attenuated. When neighborhoods are categorized into three groups, the effect-size estimate for high segregation (> 0.7) as compared with low segrega-tion (< 0.3) varies from an OR of 1.50 when segregasegrega-tion is measured with 500-meter surface-density-derived isola-tion to 1.22 when measured with tract-level percent black.
Discussion
As public health researchers increasingly look to struc-tural or upstream explanations for widespread racial health disparities there is increasing need for better tools to measure and describe residential segregation. Epide-miologists, demographers, and medical geographers have tested hypotheses about the role of residential segrega-tion on a wide variety of health outcomes, but with very little attention paid to possible measurement error or misclassification with regards to exposure to segregation. The question of misclassification in epidemiologic research is crucial because of the likelihood of imprecise or biased estimates of the parameters of interest in the presence of measurement error [49,50].
Figure 5 Difference in MSA dissimilarity index when measured
using 4000 m-egocentric neighborhood versus census tract by region. The arithmetic difference of MSA segregation calculated with 4000-meter bandwidth surface-density-derived dissimilarity index as compared with census-tract derived dissimilarity is plotted on the y-ax-is; log of MSA total population count in 2000 is plotted on x-axis. Pear-son correlation coefficient is 'r', and corresponding p-value. Line is best fit linear regression. Panels represent MSA's within each of four census regions.
log(Total MSA Population)
Diff
erence in MSA segregation measures
Dissimilar
ity(4000m) − Dissimilar
ity(T
ract)
−0.1 0.0 0.1 0.2
12 13 14 15 16 ●
● ●
● ● ● ●● ● ● ● ● ●
● ● ●
● ● ● ●
● ● ● ●
● ● ●
● ● ● ●
● ●
r= −0.099 p= 0.585
West
● ●● ● ● ● ●
● ●
● ● ● ● ● ● ● ●
● ●
● ●
● ● ●
●● ●
● ● ● ●
● ●
● ● ●
● ● ● ● ●
● ●● ●
● ●
● ●
● ●
● ●
●● ● ● ● ●
● ● ● ● ● ● ● ●
● ● ●
● ●
● ● ● ●
● ●
● ●
● ● ● ●
● ● ● ●
● ●
● ● ●
● ● ● ● ● ●
● ●
● ● ● ●
● ●
● ●
● ●
r= −0.34 p= 0.000262
South
● ● ● ● ●
●
● ●
●
● ●
● ● ●
●
● ●
● ● ●
● ● ●
● ●
●
● ● ●
● ●
● ● ●
● ● ●
● ● ●
● ●
● ●
● ● ●
● ● ●
● ●
r= 0.057 p= 0.687 Midwest
12 13 14 15 16
−0.1 0.0 0.1 0.2
● ● ●
● ●
● ● ● ●
● ● ● ● ●
● ●
● ● ●
● ● ●
● ● ● ● ●
● ● ● ●
● ● ● ●
r= −0.68 p= 5.82e−06 Northeast
Figure 6 Difference in MSA isolation index when measured using
4000 m-egocentric neighborhood versus census tract by region. The arithmetic difference of MSA segregation calculated with 4000-meter bandwidth surface-density-derived isolation index as compared with census-tract derived isolation is plotted on the y-axis; log of MSA total population count in 2000 is plotted on x-axis. Pearson correlation coefficient is 'r', and corresponding p-value. Line is best fit linear regres-sion. Panels represent MSA's within each of four census regions.
log(Total MSA Population)
Diff
erence in MSA segregation measures Isolation(4000m) − Isolation(T
ract)
−0.1 0.0 0.1 0.2
12 13 14 15 16 ●
● ● ● ●
● ●
● ●
● ● ●
●● ●
● ●
● ●
● ● ● ● ●●
● ●
● ●● ● ● ●
r= −0.16 p= 0.376 West
● ●●
● ●
● ●
● ●
● ● ● ● ● ● ● ●
● ●
● ●
● ●● ●
● ●
● ● ● ● ●
● ● ● ●
● ● ● ● ●
● ●
● ●
● ●
● ●
● ●
● ●
●● ● ● ● ●
● ● ●
● ●
● ● ●
● ● ● ●
●● ● ● ● ●
●
● ●
● ● ● ●
● ● ●
●
● ●
● ● ●
● ● ●
● ● ●
●
● ●
● ● ●
● ●
● ●
● ●
r= −0.26 p= 0.00525
South
● ● ● ●
● ●
● ●
● ●
● ●
● ●
●
● ●
● ●● ●
● ●
● ●
● ●
● ●● ●
● ● ●
● ● ●
● ● ●
●
● ●
● ●
● ●
● ● ●
● ●
r= 0.12 p= 0.388 Midwest
12 13 14 15 16
−0.1 0.0 0.1 0.2
● ● ●
● ●
● ● ● ●
● ● ● ●
● ● ●
● ● ●
● ● ●
● ● ● ● ●
●
● ●
● ● ● ●
●
We find that the class of surface-density-derived mea-sures of evenness and isolation segregation proposed by Reardon, et al, is highly correlated with traditional census tract-derived indices. Although reassuring, the high over-all degree of correlation between measures may obscure important differences of interest to health researchers considering segregation as an exposure or covariate. Understanding the potential impact of measurement dif-ferences in the context of social epidemiology or health geography requires recognition of the causes for patterns of measurement difference, the relevance of neighbor-hood scale in conceptualizing residential segregation, and the degree and direction of measurement difference for health outcomes.
Census tracts were created for specific administrative purposes with the goals of homogeneity of population and a semblance of consistency in population size. It is not surprising that the area and population density of tracts varies not only within MSA's but also across regions of the US and with respect to overall population size. With increasing total population size, population density may increase and thus tracts are more homoge-nous in size; this may explain the parity of surface-den-sity-derived segregation measures with tract-derived measures in the most populated urban areas. In contrast for studies focusing on smaller MSAs or particularly on MSAs in the Southern US, there appears to be increased likelihood of differences in measured segregation. One
Table 3: Association of MSA segregation and very preterm birth among Black and White mothers, 231
MSAs
Main effect of segregation Main effect of race Segregation × Race Interaction Model Fit (Deviance)
RR 95% CI RR 95% CI RR 95% CI
BASELINE 3.11 3.07 3.15 2104
Continuous
Dissimilarity
Tract 0.91 0.83 1.00 2.96 2.92 3.01 1.68 1.52 1.87 1990
500 m 0.95 0.85 1.07 2.96 2.92 3.01 2.12 1.84 2.43 1948
4000 m 0.95 0.87 1.05 2.99 2.94 3.03 1.69 1.50 1.89 2001
Isolation
Tract 0.91 0.86 0.96 2.91 2.86 2.96 1.51 1.40 1.62 1967
500 m 0.96 0.91 1.01 2.91 2.87 2.96 1.52 1.41 1.64 1963
4000 m 0.93 0.88 0.98 2.93 2.88 2.98 1.44 1.34 1.54 1990
Binary†
Dissimilarity
Tract 0.97 0.95 0.99 2.91 2.85 2.97 1.11 1.08 1.14 2038
500 m 0.98 0.95 1.01 2.80 2.69 2.91 1.12 1.08 1.17 2067
4000 m 0.97 0.95 0.99 2.99 2.94 3.05 1.08 1.06 1.11 2062
Isolation
Tract 0.96 0.93 0.98 3.00 2.95 3.04 1.17 1.13 1.20 1978
500 m 0.96 0.94 0.98 2.97 2.92 3.01 1.13 1.10 1.16 2011
4000 m 0.91 0.88 0.94 3.03 2.99 3.07 1.18 1.14 1.22 2022
NOTE: Race is coded Black = 1, White = 0, and all continuous segregation indices are mean-centered so that the main effect of segregation is the effect for white women only, and the main effect of race is the excess relative risk for black as compared with white women at average segregation levels (e.g. mean-centered segregation equals zero for in an MSA with average level of segregation). The interaction term is then the excess relative risk for black women in the most compared with the least segregated MSAs. All models are adjusted for census region and MSA population size.
† Dissimilarity index dichotomized into low (< 0.6) = 0, and high (≥0.6) = 1. Isolation index dichotomized at 0.7
implication of these patterns is that future research should consider variation in segregation-health associa-tions within and between regions and MSAs categorized by population size.
The finding that these differences are greater for dis-similarity than for isolation point to differences in the two constructs. Dissimilarity measures relative evenness or uniformity of the distribution of blacks across neighbor-hoods and is therefore insensitive to absolute size of the black population. High isolation on the other hand is only possible in cities with a sufficiently large black population to allow complete spatial separation of blacks from whites. Therefore isolation is somewhat correlated with population size, and the largest cities had the smallest dif-ferences in measures. There are also difdif-ferences between dissimilarity and isolation across regions of the US. The higher isolation for Southern MSAs is consistent with the relatively larger black population in Southern cities, but
the fact that Northern and Midwestern MSAs have higher dissimilarity than the South may result from those MSAs being larger on average and thus have greater spa-tial separation between racial groups (more unevenness). Although isolation and dissimilarity are correlated these two constructs can be useful together in understanding what aspect of the segregation pattern is most health rele-vant [21,24].
The question of the importance of spatial scale for con-ceptualizing neighborhoods in health research is not new [51,52]. Rather than recommending a single 'ideal' scale many investigators argue for exploring place-health asso-ciations at a variety of scales to understand how associa-tions are spatially patterned [53,54]. In that regard census tracts are not aspatial, they are simply of a somewhat arbitrary scale which appears to correlate in these MSA's with a 2000m-egocentrically defined neighborhood (Fig-ure 1). Thus segregation indices estimated using only
Figure 7 Residential area racial composition of sub-areas in Atlanta MSA, 2000, using alternate measures. Twenty-county Atlanta MSA
distri-bution of black residents as measured with four methods: A: % black in census tract; B. surface-density-derived proportion black using 500-meter bandwidth kernel; C. population-density-weighted average of 500-meter bandwidth proportion black aggregated to the census tract; D. surface-den-sity-derived proportion black using 4000-meter bandwidth kernel.
A. % Black by tract 0% - 20% 20.1% - 40% 40.1% - 60% 60.1% - 80% 80% - 100%
B. % Black 500m egocentric neighborhood Value
High :100
Low : 0
C. Tract average % Black 500m 0% - 20%
20.1% - 40% 40.1% - 60% 60.1% - 80% 80.1% - 100%
D. % Black 4000m egocentric neighborhood Value
High :100
Low : 0 A.
0 10 20 40Kilometers
0 10 20 40Kilometers 0 10 20 40Kilometers
$
$
$
0 10 20 40Kilometers
$
B.
census tracts may miss opportunities to more richly describe associations between health and residential pat-terns at different scales.
In this study the largest differences between tract-derived measures and surface-density tract-derived measures was for the smallest egocentric neighborhood considered, defined as a 500-meter-radius circle around each resi-dence. Although this spatial scale (and in fact all of the egocentric scales assessed) are arbitrary and imperfect descriptions of experienced residential environment, a
500-meter area may be particularly meaningful for some aspects of residential segregation. Sastry, et al found that the majority of residents surveyed in sprawling Los Ange-les County self-reported their neighborhood to be either the street or block on which they lived, or the area within a 15-minute walk of their home [39]. This is similar to the area approximated by a 500-meter radius egocentric neighborhood. A study of residents' perception of neigh-borhood safety and security in Flint, Michigan evaluated the association between proximity to deteriorating
resi-Table 4: Association of neighborhood racial composition and very preterm birth among Black and White
mothers, Atlanta, GA
Main effect of segregation Main effect of race Segregation × Race
Interaction
Model Fit (Deviance)
OR 95% CI OR 95% CI OR 95% CI
BASELINE 2.84 2.70 2.99 62845
Continuous
Tract % black 1.75 1.35 2.24 2.45 2.28 2.64 0.69 0.53 0.90 62813
500-m % black 1.59 1.30 1.95 2.43 2.26 2.62 0.75 0.60 0.94 62813
4000-m % black 1.68 1.34 2.09 2.47 2.30 2.65 0.71 0.56 0.91 62814
Tract-500-m† 1.68 1.34 2.08 2.45 2.28 2.63 0.71 0.56 0.91 62811
Trichotomous
Tract % black
< 0.3 1.00 -- -- 2.75 2.55 2.96 1.00 -- -- 62818
0.3-0.7 1.27 1.11 1.44 0.80 0.69 0.94
> 0.7 1.22 0.85 1.67 0.93 0.67 1.34
500-m % black
< 0.3 1.00 -- -- 2.75 2.53 2.99 1.00 -- -- 62811
0.3-0.7 1.25 1.10 1.42 0.81 0.69 0.95
> 0.7 1.50 1.20 1.85 0.74 0.59 0.94
4000-m % black
< 0.3 1.00 -- -- 2.69 2.48 2.92 1.00 -- -- 62814
0.3-0.7 1.23 1.10 1.38 0.87 0.76 1.01
> 0.7 1.43 1.10 1.82 0.81 0.62 1.06
Tract-500-m†
< 0.3 1.00 -- -- 2.80 2.59 3.03 1.00 -- -- 62811
0.3-0.7 1.31 1.16 1.47 0.76 0.66 0.88
> 0.7 1.27 0.96 1.64 0.88 0.67 1.17
NOTE: Race is coded Black = 1, White = 0, and all continuous segregation indices are mean-centered so that the main effect of segregation is the effect for white women only, and the main effect of race is the excess relative risk for black as compared with white women at average segregation levels (e.g. mean-centered segregation equals zero for an neighborhood with average racial composition). The interaction term is then the excess relative risk for black women in the most compared with the least segregated neighborhoods.
†Tract-500-m are obtained by taking a population-weighted average of the racial composition in the 500-meter vicinity of each grid point within a census tract, thus approximating the average spatial isolation experienced by residents of each tract.
dential housing quality and fear of crime, quality of social capital and general satisfaction [55]. The investigators found that the resident's fear of crime and perception of low social capital was greatest when they lived 0.25 miles (about 400 meters) away from deteriorating residential housing.
Ultimately researchers should be interested in whether their choice of segregation measure results in biased or unnecessarily imprecise estimates of the association of place and health. As an example, we find that when com-paring different measures of segregation, the estimated effect of MSA segregation on very preterm birth varies in magnitude (but not direction) particularly for black mothers, where the smallest neighborhood approxima-tion had the strongest associaapproxima-tion. In contrast for studies focusing on neighborhood racial composition, we find that the choice of measure changes the magnitude of the segregation effect for white women, and to lesser degree black women. Using continuously measured indices, the strongest association was found using proportion black within census tracts, although when segregation was cat-egorized the largest effect of high versus low segregation was for the 500-meter egocentric neighborhoods.
While these models are not adjusted for other impor-tant confounders--because the object of the current anal-ysis is variation in the segregation parameter, not causal inference with regards to the parameter--several patterns are worthy of mention. The difference in association for white women in this neighborhood analysis as compared with the MSA-level analysis speaks to one of the critical distinctions between segregation studies where the spa-tial unit of observation is the neighborhood as opposed to the MSA. The characteristics of the residential environ-ment which are toxic to health (e.g. crumbling infrastruc-ture, concentrated poverty, high crime) are bad for all residents, black or white, as demonstrated in the Atlanta neighborhood study where white and black women have elevated very preterm birth risk as segregation increases. What may account for the differences in the MSA analy-sis, however, is that as segregation increases, the proba-bility of white women experiencing those unhealthy neighborhoods declines, so that in highly segregated MSAs even poor white women tend to live in mixed income neighborhoods, while poor blacks predominantly live in high-poverty neighborhoods [22].
Limitations
There are several important limitations to our study. First, we used census blocks as the demographic input from which we created surface-densities of populations. Census blocks are the highest resolution data available, but the possibility for imprecise estimation of fine-scale residential density remains.
Secondly, we focused primarily on black-white residen-tial segregation as this particular pattern has most consis-tently been associated with health disparities in the US [21]. While the segregation indices are valid descriptions of black-white residential patterns, other population pat-terns may be of interest to researchers as well, including multi-group segregation among Hispanics, whites, and blacks, or economic segregation overall or within racial/ ethnic groups. The spatial surface density approach to measuring segregation can be extended to each of these cases [56,57].
Third, in the example of residential segregation and very preterm birth we chose to use simple models, with the focus on the relative change in the segregation param-eters as the index of segregation was changed. A conse-quence is that several important confounders of the association were ignored. While our findings should not be interpreted as describing causal associations, in other work we confirm that these patterns persist in more com-plex multi-level models with adjustment for individual and area-level covariates (manuscript under review).
Finally, because national birth records are not available with small-area geocodes, we were not able to simultane-ously consider neighborhood and MSA-level segregation, and thus cannot make inference as to which scale is most responsible for the observed associations.
Conclusions
Social epidemiologists, health demographers, and medi-cal geographers are increasingly interested in the associa-tion between patterns of racial residential segregaassocia-tion and health disparities. As this area evolves more nuanced approaches to measuring segregation are needed. We find that a new class of explicitly spatial segregation sures is highly correlated with census tract derived mea-sures, but specific measures differ in systematic ways which may be relevant to particular studies. Specifically there are systematic variations in the values of the dissim-ilarity and isolation indices among US Census regions and between MSAs with different population sizes. Investigators should consider these variations in future research. Further research is also needed to better under-stand the role of spatial scales in describing the relation-ship between segregation and health, noting that relevant scales may vary with different health outcomes. In fact exploring variations in the place-health associations across spatial scales may be considered an additional dimension of the residential context.