E D U C A T I O N A L R E V I E W
Open Access
The Charcot foot: a pictorial review
Andrea B. Rosskopf
1,2*, Christos Loupatatzis
3, Christian W. A. Pfirrmann
1,2, Thomas Böni
2,4and
Martin C. Berli
2,4Abstract
Charcot foot refers to an inflammatory pedal disease based on polyneuropathy; the detailed pathomechanism of
the disease is still unclear. Since the most common cause of polyneuropathy in industrialized countries is diabetes
mellitus, the prevalence in this risk group is very high, up to 35%. Patients with Charcot foot typically present in
their fifties or sixties and most of them have had diabetes mellitus for at least 10 years. If left untreated, the disease
leads to massive foot deformation. This review discusses the typical course of Charcot foot disease including
radiographic and MR imaging findings for diagnosis, treatment, and detection of complications.
Keywords:
Charcot foot, Imaging, Osteomyelitis, MRI, Radiographs
Key points
X-rays may be normal during early stage of Charcot
foot
MRI should be done with large field of view
covering the entire foot
MRI can be used for early diagnosis, monitoring of
disease activity and complications
Acute MRI findings include bone marrow edema,
soft tissue edema, and subchondral fractures
Chronic MRI findings include subchondral cysts,
joint destructions, joint effusion, and bony
proliferations
Annotation regarding wording of planes of foot
imaging in this review
Hindfoot: sagittal = parallel to long axis of metatarsal
bones; coronal = perpendicular to long axis of metatarsal
bones; axial = perpendicular to long axis of the tibia.
Forefoot: sagittal = parallel to long axis of metatarsal
bones; axial = perpendicular to long axis of metatarsal
bones; coronal = parallel to foot sole.
Introduction
The Charcot foot has been first described in 1868 by
Jean-Martin
Charcot,
a
French
pathologist
and
neurologist, in patients with tabes dorsalis (myelopathy
due to syphilis) [
1
]. The detailed pathomechanisms of
this disease still remain unclear: there is consensus
that the cause is multifactorial and that
polyneurop-athy (reduced pain sensation and proprioception) is
the underlying basic condition of this disease. In
in-dustrialized countries, diabetes mellitus is the main
cause of polyneuropathy in the lower limb [
2
]—much
more common than other causes like alcohol abuse or
malnutrition. The prevalence of Charcot foot in a
gen-eral diabetic population is estimated between 0.1 and
7.5%, but regarding diabetic patients with apparent
peripheral neuropathy, this prevalence is increasing up
to 35% [
3
]. The risk of getting a Charcot foot is not
re-lated to the type (I or II) of diabetes mellitus. The
inci-dence of bilateral involvement of the feet has been
reported between 9 and 75% [
2
]. Patients with
Char-cot foot typically present within their fifties or sixties
and most of them have had diabetes mellitus for at
least 10 years [
2
].
Natural course of disease
Charcot foot is characterized by four different disease
stages (Fig.
1
) [
7
,
8
], resembling active and inactive
dis-ease phases: inflammation, fragmentation, coalescence,
consolidation. The disease is normally limited to a
sin-gle-run through these different disease stages. The active
phase is characterized by a hot, red, and swollen foot
(inflammation), often without pain, due to the
polyneur-opathy (Fig.
2
) [
1
]. In the active phase, the bone gets
© The Author(s). 2019Open AccessThis article is distributed under the terms of the Creative Commons Attribution 4.0 International License (http://creativecommons.org/licenses/by/4.0/), which permits unrestricted use, distribution, and reproduction in any medium, provided you give appropriate credit to the original author(s) and the source, provide a link to the Creative Commons license, and indicate if changes were made.
* Correspondence:andrea.rosskopf@balgrist.ch
1Radiology, Balgrist University Hospital, Forchstrasse 340, 8008 Zurich, Switzerland
fragile due to temporary osteopenia leading to fractures,
joint destructions (often Lisfranc’s joint) and collapse of
the longitudinal arch of the foot [
2
,
8
,
9
]. During the less
active or inactive phase, the foot is not red any more,
but some soft tissue and bone marrow edema may last.
Prominent osteophytes and palpable loose bodies are the
consequence of a substantial joint and bone destruction
followed by bony proliferations [
2
,
9
]. The typical
end-stage appearance of a Charcot foot is the so-called
rocker-bottom deformity (Fig.
3
).
A recent study showed that there is a risk of
re-activa-tion of a
“formerly in-active”
Charcot foot in about 23%
within a mean interval of 27 months [
4
] (Fig.
1
).
Clinical stages and differential diagnoses
The (modified) Eichenholtz classification [
5
,
6
], which
relies on clinical and x-ray findings, is frequently used
for clinical assessment of a suspected Charcot foot
(stages 0, I, II, III, IV). Stage 0 is the ideal stage for early
diagnose of a Charcot foot, but also the most difficult
one for the clinician: the patients typically present with a
red, swollen, warm foot, but no visible changes (yet) on
radiographs. Typical differential diagnoses in this early
stage include deep vein thrombosis, gout, osteoarthritis,
and infection (cellulitis/osteomyelitis) [
10
].
Treatment
Current state-of-the art treatment is the off-loading of
the affected foot—as soon as possible—so that the
Fig. 1Charcot foot: natural course of disease with recurrence rates about 23%, adapted from [4–6]
Fig. 2A typical Charcot foot in acute active phase: red, hot, and swollen right foot
Fig. 3Rocker-bottom deformity: end-stage of Charcot foot.a
mentioned four disease stages run-through while the
foot is protected from major shape changes (Fig.
4
) [
1
].
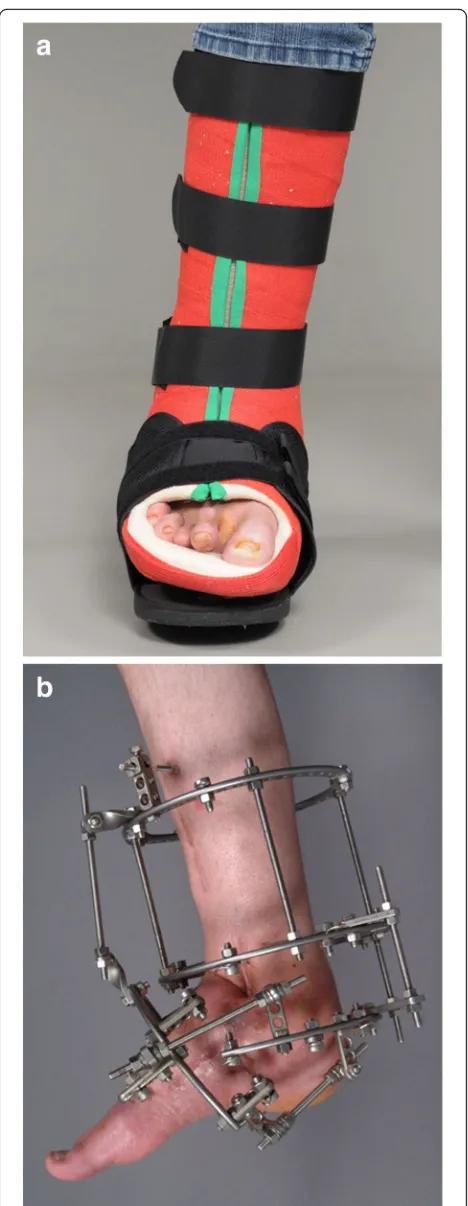
One commonly used method is the treatment of patients
with custom-made removable total contact casts (Fig.
5
a)
until the activity signs of the Charcot foot are
signifi-cantly reduced or gone. This might take up to 18 months
[
4
]. Establishing an early diagnosis and therefore an early
off-loading treatment is crucial for the prognosis and
outcome of an acute Charcot foot. The stabilization with
the Ilizarov external fixator frame is considered an
alter-native treatment option for the off-loading [
11
] (Fig.
5
b)
in feet with complications (severe deformity or after the
removal of osteomyelitic bone fragments) [
12
].
Imaging findings
This review is focused on typical findings of a Charcot
foot on radiographs and MR imaging since these two
modalities play the most important role for disease
mon-itoring, classification, and treatment [
13
].
Classifications
The Charcot foot can be classified using various systems
according to anatomical landmarks and clinical
symp-toms. The most common ones are the Sanders and
Fryk-berg classification, the Brodsky classification, and the
Eichenholtz-classification [
5
,
7
,
14
–
17
]. This review
covers the Sanders and Frykberg classification in detail,
because it can be used without additional clinical
information.
Sanders and Frykberg classification
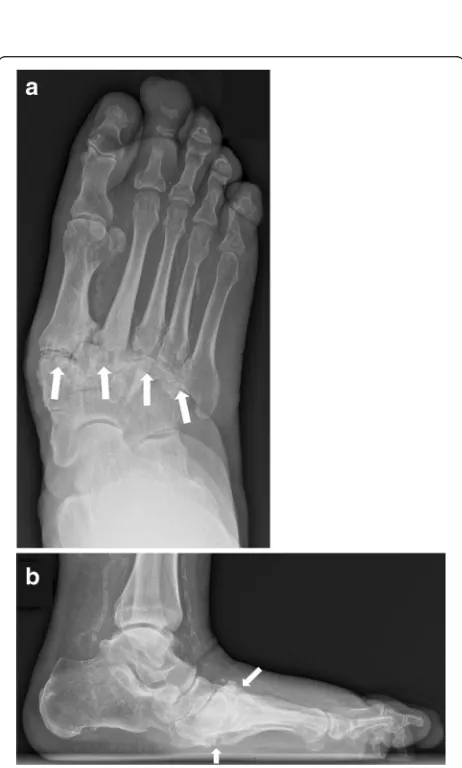
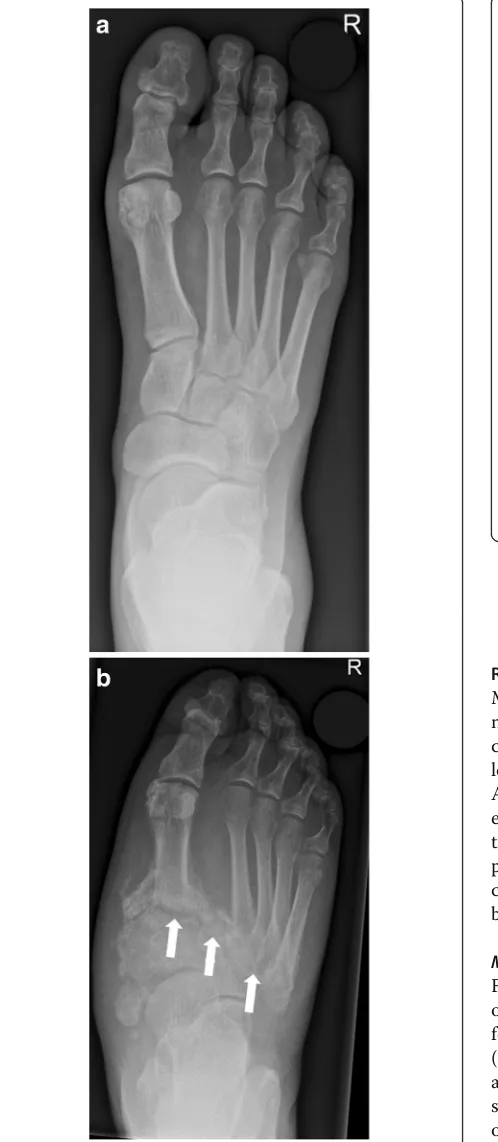
Sanders and Frykberg identified five zones of disease
distribution according to their anatomical location, as
demonstrated in Fig.
6
. Most commonly involved are
zone II in about 45% and zone III in about 35% of
cases [
2
], Fig.
7
and Fig.
8
.
Fig. 4Off-loading therapy with total contact casts give the patient the chance of healing properly without debilitating deformities and with a preserved longitudinal arch
Fig. 5aRemovable total contact cast used for off-loading treatment of active Charcot foot.bIlizarov fixateur in a patient with
Role of conventional radiographs
Conventional radiographs of the Charcot foot are
trad-itionally the standard imaging technique to establish the
diagnosis, to stage, and to monitor the disease. The main
value of plain radiographs is to assess the position of the
bones to each other in general, and in particular under
load (Fig.
9
) [
13
,
18
,
19
].
Typical measurements on radiographs [
19
] help to
de-termine the severity of deformation in a Charcot foot
(especially in follow up studies), Fig.
10
:
1. Meary
’
s angle: angle between the line originating
from the center of the body of the talus, bisecting
the talar neck and head, and the line through the
longitudinal axis of 1st metatarsal; normal value
should be around 0°.
2. Cuboid height: perpendicular distance from the
plantar aspect of the cuboid to a line drawn from
the plantar surface of the calcaneal tuberosity to the
plantar aspect of the 5th metatarsal head. Mean
normal value is about 1.2 cm above that line.
3. Calcaneal pitch: angle between a line extending
from the plantar aspect of the calcaneus to the
plantar surface of the 5th metatarsal head and the
line extending from the most plantar portion of the
calcaneal tuberosity to the most plantar portion of
the anterior calcaneus [18]. Normal value lies
between 20 and 30°.
4. Hindfoot-forefoot angle: Dorsoplantar (dp)
radiographs can reliably show the (sub-)luxation in
the Lisfranc
’
s joint, especially the medial aspect of
the joint (Fig.
11). Dorsoplantar radiographs in
follow-up studies typically show the increase in
forefoot abduction relative to the hindfoot over
time, the so-called hindfoot-forefoot angle (Fig.
11).
Oblique conventional radiographs are superior to
Fig. 6Anatomical distribution in the Sanders and Frykbergclassification. Zone I: metatarsophalangeal and interphalangeal joints, zone II: tarsometatarsal joints, zone III: tarsal joints, zone IV: ankle and subtalar joints, and zone V: calcaneus
Fig. 7Radiographs of the right foot in dp (a) and lateral projection (b) involving zone II. Note the involvement of the tarsometatarsal articulations (white arrows) with lateral subluxation of the metatarsal bones in the Lisfranc’s joint
dp-radiographs in visualizing the lateral aspect of
the Lisfranc
’
s joint (3rd to 5th tarsometatarsal
joint).
Role of magnetic resonance imaging
MRI can be very helpful in order to establish an early
diag-nosis of Charcot foot. MRI also allows to determine the
course of the healing process and the success of the
off-loading treatment (monitoring: active or inactive disease).
Another very significant role of MRI is its ability to further
evaluate complications of a Charcot foot, in particular soft
tissue infections and osteomyelitis (Fig.
12
) [
3
,
13
,
20
]. In
patients with contraindications for MR examination,
nu-clear medicine imaging can be performed (see section
below:
“
CT and nuclear medicine imaging
”).
MRI-protocol
For Charcot foot, it is essential to use a large field
of view (FoV) since the disease can affect the entire
foot. It is necessary to use a fluid sensitive sequence
(e.g., STIR) for assessing edema in the bone marrow
and soft tissue. A classic T1 TSE (turbo spin-echo)
sequence is irreplaceable to demonstrate the
anat-omy and the fat signal of the bone marrow.
T2-weighted sequences can demonstrate the presence of
subchondral cysts and help to identify fluid
collec-tions and sinus tracts [
2
,
3
]. Axial images are useful
to assess the Lisfranc’s joint disease. An MRI
proto-col proposal for Charcot foot evaluation is
demon-strated in Fig.
13
. Nephrotoxic effects of gadolinium
Fig. 9Weight-bearing radiograph in dp projection (abaseline,b
5 months later). Notice the development of fractures and subchondral cysts, erosions, joint distention, and luxation of the Lisfranc’s joint (white arrows)
are still controversely discussed, and almost all
pa-tients with a Charcot foot are at risk for
develop-ment of renal failure (due to diabetes) [
21
,
22
].
Therefore, the application of contrast media should
be limited to patients with suspected infections
(ab-scess collections and osteomyelitis).
MRI for Charcot foot diagnosis
Charcot foot cannot be diagnosed based on imaging
alone and should always be interpreted in context with
the clinical parameters (known polyneuropathy, red foot,
and so on) [
2
,
23
]. However, there are some typical MR
imaging features for the early- and late-stage of a
Char-cot foot.
MRI for diagnosis of early-stage Charcot foot
MRI is
the best imaging modality to confirm diagnosis of
sus-pected early active Charcot disease [
24
]. This may be
cru-cial, since conventional radiographs can appear normal
during very early stage of Charcot disease (Eichenholtz
stage 0, Fig.
14
). Early signs of a Charcot foot in MRI are
bone marrow edema and soft tissue edema, joint effusion,
and eventually microfractures (subchondral) [
2
,
25
].
Dur-ing early stage of Charcot foot, there are no cortical
frac-tures and no gross deformity seen [
26
].
Fig. 11Radiograph in dp projection showing the changes in foot morphology in a typical Charcot foot patient over time (abaseline,
b10 months later). Note the increase in forefoot abduction relative to the hindfoot: The hindfoot-forefoot angle (yellow curve) is the angle between the longitudinal axis of the 2nd metatarsal bone (yellow line) and the bisection (black dotted line) of another angle (white curve), which is formed by the following two lines: the midline through the talar neck and head and a line parallel to the lateral cortex of the calcaneus (white arrows) [19]
MRI of middle- to late-stage Charcot foot (frag
mentation to consolidation)
Joint destruction, cortical
fractures, and joint dislocations are present (Figs.
15
and
16
). Bone marrow edema can be present (very common
in middle-stage Charcot foot) or absent, depending on
disease activity. Especially the involvement of Lisfranc’s
joint leads to a typically superior and lateral dislocation
of the metatarsal bones leading to a complete collapse of
the longitudinal arch [
2
,
24
,
25
]. The talus head is
typic-ally tilted toward the sole of the foot (Fig.
17
a), the
na-vicular bone typically dislocates into a medial and
superior position, often with fractures and
fragmenta-tion. Prominent well-marginated subchondral cysts are a
typical feature of the chronic Charcot foot (Fig.
17
b).
Bone proliferation and sclerosis, debris, and intraarticular
Fig. 13Proposed MRI-protocol for evaluation of the Charcot foot with four sequences: sagittal STIR, 3 mm, whole foot (a); sagittal T1, 3 mm, whole foot (b); transverse T1, 3 mm, hindfoot including Lisfranc’s joints (c); coronal T2, 3 mm, hindfoot including Lisfranc’s joints (d). Additional contrast media application is optional for patients with suspected infection/osteomyelitis: sagittal T1 fs 3 mm post contrast and axial T1 fs 3 mm post contrast. Note: Of course, the protocol should be extended and adapted in cases of non-Charcot-related complications, that require better spatial resolutions: e.g., additional sequences with smaller field of view, when infection at the distal toes in a diabetic foot is suspectedbodies can occur (Fig.
17
c) [
2
,
26
]. Fluid collections
sur-rounding destructed joints may be huge (Fig.
18
).
Monitoring of disease activity with MRI
MRI is the best imaging modality to monitor the disease
activity. As long as a significant amount of bone marrow
edema is seen on MRI, consequent off-loading therapy
with removable total contact casts has to be continued
[
27
]. After a significant decrease or complete
disappear-ance of bone marrow edema, the cast can be removed,
and an orthopedic shoe adapted (Fig.
19
).
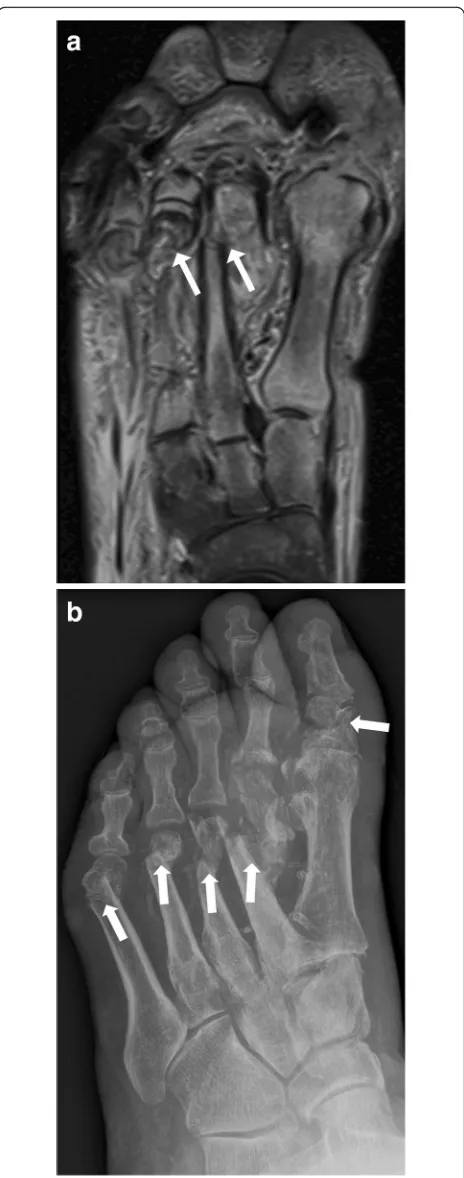
MR-imaging of complications: infection/osteomyelitis
In Charcot foot, the cuboid bone typically becomes the
most inferior bone in the foot [
3
] (Fig.
20
). Due to the
resulting changes in pedal shape, the foot is prone to
extensive callus formation, blisters, and ulcerations,
espe-cially plantar to the cuboid bone (Fig.
20
c). This may lead
to soft tissue infections and osteomyelitis (Fig.
20
a, b) [
2
].
MRI has a high diagnostic accuracy in diagnosing
osteomyelitis of the foot, with a high sensitivity (77–
100%) and a high specificity (80–100%) [
24
]. MRI has a
very high negative predictive value (98%): if there are no
signs of osteomyelitis on MRI, osteomyelitis can
practic-ally be excluded [
28
].
Fig. 15Active Charcot foot (stage of fragmentation).aSagittal STIR: note the superior dislocation of the metatarsals at the level of Lisfranc’s joint (white arrow heads); massive bone marrow edema (black asterisks) in metatarsal bone, navicular bone, and cuneiform bones; and massive soft tissue edema (white thin arrows).bSagittal T1: shows degree of bone destruction and fragmentation in the midfoot with huge signal drop (arrows) in the fatty bone marrow, similar to signal drops in osteomyelitis (white arrows)
However, discriminating an active Charcot foot from
acute osteomyelitis remains challenging [
25
]. Both
entities have similar image characteristics like bone
mar-row edema, soft tissue edema, joint effusions, fluid
col-lections, and contrast enhancement in bone marrow and
soft tissues. Even the degree of signal drop in T1
se-quences might be quite similar in both conditions
(Figs.
15
and
20
). However, there are some imaging
fea-tures (listed in Table
1
, Fig.
21
) that may help to find the
correct diagnosis.
Fig. 17Three sagittal images of different patients showing classic features of late-stage Charcot foot.a(Sagittal STIR) inferior dislocation of the talar head (white arrow), effusion in the tibiotalar joint (white arrow head).b(Sagittal STIR) prominent subchondral cysts at the Lisfranc’s joint (white arrows).c(Sagittal T1) bone proliferation and debris in the midfoot (white arrows) and fragmentation of navicular bone
Advanced MR-imaging techniques
Diffusion-weighted imaging may contribute in the
detec-tion and extension of osteomyelitis: pure edema does not
show diffusion restriction, whereas the presence of pus
and inflammatory cells in infection leads to restricted
dif-fusion with lower ADC-values than in pure edema [
31
].
Dynamic contrast enhancement (DCE)-perfusion may
help in the discrimination between viable tissue and
ne-crosis. Furthermore, the enhancement pattern in
DCE-perfusion seems to be different between osteomyelitis and
osteoarthropathic changes, increasing the potential of
dif-ferencing lesions with bone marrow edema [
30
].
CT and nuclear medicine imaging
During early-stage Charcot foot, CT does not play an
im-portant role for imaging since bone marrow and soft tissue
Fig. 19Before off-loading therapy (asagittal STIR,bsagittal T1): active stage of Charcot disease with a significant amount of bone marrow edema (white arrow heads) and soft tissue edema (white arrows) (a). Also note the subluxation at the Chopard’s joint with downward tilt of the talar head (b) 7 months after a consequent off-loading therapy with a total contact cast: note the almost complete disappearance of bone marrow edema (white arrow heads) and soft tissue edema on sagittal STIR sequence
Fig. 20Patient with ulceration (a) at the sole of the foot directly beneath the cuboid bone as a typical complication of rocker-bottom deformity of the foot. MRI with sagittal STIR sequence (b)
demonstrates contiguous spread of infection from the skin, forming a sinus tract (red arrow) to the cuboid bone (asterisk) and bone marrow edema due to active Charcot disease (arrow heads). Sagittal T1-weighted sequence shows focal replacement of fatty bone marrow signal within the cuboid bone (c),
changes can be better visualized using MRI [
2
]. However,
CT may be used in later-stage Charcot foot for better
visualization of bony proliferations and consolidation, or
for surgery planning and treatment monitoring in patients
with Ilizarov fixation [
2
]. Furthermore, CT and PET-CT
may be used as an alternative cross-section imaging tool in
patients with contraindications for MR examination
(pace-maker, severe claustrophobia, etc.). PET-CT allows the
quantification of the inflammatory process in all stages of
Charcot foot and allows to follow-up its evolution over
time: recent research showed that PET-CT may be of
add-itional help for evaluation of treatment duration in addition
to MR imaging [
32
].
Furthermore, nuclear medicine imaging may be of
im-portant value in non-conclusive cases with suspected
in-fection of a Charcot foot: a recent meta-analysis
compared MRI, FDG
–
PET-CT, and white blood cell
scintigraphy [
33
]. The authors concluded that despite all
of these modalities having a similar sensitivity for
detec-tion of osteomyelitis in Charcot foot, the nuclear
im-aging methods show a higher specificity [
33
]. However,
all nuclear medicine imaging methods are more
expen-sive than MRI and result in radiation exposure to the
patient.
Conclusion
The Charcot foot is a rare disease, associated with
poly-neuropathy, in industrialized countries most commonly
seen in the long-term diabetic population. The radiologist
plays an important role in the management of this disease.
Therefore, it is important to be familiar with the typical
im-aging characteristics of the Charcot foot and to consider
this diagnosis in a proper clinical setting. Recognizing this
disease in early stages prevents a delayed onset of an
appro-priate therapy and helps minimizing the disability of these
patients.
Although radiographs are important to assess the
pos-ition of the bones to each other in general, and in
par-ticular under load, MRI is the method of choice not only
in establishing an early diagnosis but also in monitoring
the course of the disease activity and in diagnosing
in-fectious complications.
Fig. 21MRI of a Charcot foot complicated with osteomyelitis.a
Abbreviations
ADC:Apparent diffusion coefficient; CT: Computed tomography; Dp: Dorsoplantar; FDG: Fluorodesoxyglucose; FoV: Field of view; MR: Magnetic resonance; MRI: Magnetic resonance imaging; PET: Positron emission tomography; STIR: Short tau inversion recovery
Acknowledgements
This work was not sponsored by grants or any funding organization or company. This work was presented as a poster at the ESSR (European Society of Musculoskeletal Radiology) congress 2018 in Amsterdam.
Authors’contributions
All authors designed, wrote, and reviewed this article. All authors read and approved the final manuscript.
Funding
This work was not sponsored by grants or any funding organization or company.
Availability of data and materials
Data sharing is not applicable to this article as no datasets were generated or analyzed. A different version of this article was presented as an educational poster at the ESSR (European Society of Musculoskeletal Radiology) congress 2018 in Amsterdam.
Ethics approval and consent to participate
All patients have signed consent forms agreeing that their images and data might be used for educational and research purposes.
Competing interests
The authors declare that they have no competing interests.
Author details 1
Radiology, Balgrist University Hospital, Forchstrasse 340, 8008 Zurich, Switzerland.2Faculty of Medicine, University of Zurich, Zurich, Switzerland. 3
Radiology, Spital Maennedorf, Asylstrasse 10, 8708 Maennedorf, Switzerland. 4Orthopedic Surgery, Balgrist University Hospital, Forchstrasse 340, 8008 Zurich, Switzerland.
Received: 9 March 2019 Accepted: 12 July 2019
References
1. La Fontaine J, Lavery L, Jude E (2016) Current concepts of Charcot foot in diabetic patients. Foot (Edinb) 26:7–14
2. Ergen FB, Sanverdi SE, Oznur A (2013) Charcot foot in diabetes and an update on imaging. Diabetic Foot & Ankle 4:21884
3. Schoots IG, Slim FJ, Busch-Westbroek TE, Maas M (2010)
Neuro-osteoarthropathy of the foot-radiologist: friend or foe? Semin Musculoskelet Radiol 14:365–376
4. Osterhoff G, Boni T, Berli M (2013) Recurrence of acute Charcot neuropathic osteoarthropathy after conservative treatment. Foot Ankle Int 34:359–364 5. Eichenholtz SN (1966) Charcot Joints. Charles C Thomas, Springfield, III, pp.
3–10
6. Shibata T, Tada K, Hashizume C (1990) The results of arthrodesis of the ankle for leprotic neuroarthropathy. J Bone Joint Surg Am 72:749–756 7. Rosenbaum AJ, DiPreta JA (2015) Classifications in brief: Eichenholtz
classification of Charcot arthropathy. Clin Orthop Relat Res 473:1168–1171 8. Pinzur M (2018) An evidence-based introduction to Charcot foot Arthropathy.
Foot Ankle Orthopaedics.https://doi.org/10.1177/2473011418774269:1-7
9. Frykberg RG, Zgonis T, Armstrong DG et al (2006) Diabetic foot disorders. A clinical practice guideline (2006 revision). J Foot Ankle Surg 45:S1–66 10. Holmes C, Schmidt B, Munson M, Wrobel JS (2015) Charcot stage 0: a
review and consideratons for making the correct diagnosis early. Clin Diabetes Endocrinol 1:18
11. Yousry AH, Abdalhady AM (2010) Management of diabetic neuropathic ankle arthropathy by arthrodesis using an Ilizarov frame. Acta Orthop Belg 76:821–826
12. Wirth SH, Espinosa N, Berli M, Jankauskas L (2015) [Complex reconstruction in Charcot arthropathy using the Ilizarov ring fixator) Orthopade 44:50–57
13. Rosskopf AB, Berli M (2018) The role of radiological imaging for treatment of Charcot foot [article in German]. Fuss und Sprunggelenk 16:99–108 14. Chantelau EA, Grutzner G (2014) Is the Eichenholtz classification still valid for
the diabetic Charcot foot? Swiss Med Wkly 144:w13948
15. Sanders LGF, G R (1991) The high risk foot in diabetes mellitus. Churchill Livingstone, New York
16. Brodsky JW (2006) The diabetic foot. In: Coughlin MJ, Mann RA, Saltzman CL (eds) Surgery of the foot and ankle. Mosby, St. Louis, pp 1281–1368 17. Robinson AH, Pasapula C, Brodsky JW (2009) Surgical aspects of the diabetic
foot. J Bone Joint Surg Br 91:1–7
18. Hastings MK, Sinacore DR, Mercer-Bolton N et al (2011) Precision of foot alignment measures in Charcot arthropathy. Foot Ankle Int 32:867–872 19. Hastings MK, Johnson JE, Strube MJ et al (2013) Progression of foot
deformity in Charcot neuropathic osteoarthropathy. J Bone Joint Surg Am 95:1206–1213
20. Toledano TR, Fatone EA, Weis A, Cotten A, Beltran J (2011) MRI evaluation of bone marrow changes in the diabetic foot: a practical approach. Semin Musculoskelet Radiol 15:257–268
21. Buhaescu I, Izzedine H (2008) Gadolinium-induced nephrotoxicity. Int J Clin Pract 62:1113–1118
22. Ledneva E, Karie S, Launay-Vacher V, Janus N, Deray G (2009) Renal safety of gadolinium-based contrast media in patients with chronic renal
insufficiency. Radiology 250:618–628
23. van Netten JJ, Prijs M, van Baal JG, Liu C, van der Heijden F, Bus SA (2014) Diagnostic values for skin temperature assessment to detect diabetes-related foot complications. Diabetes Technol Ther 16:714–721 24. Mautone M, Naidoo P (2015) What the radiologist needs to know about
Charcot foot. J Med Imaging Radiat Oncol 59:395–402
25. Ahmadi ME, Morrison WB, Carrino JA, Schweitzer ME, Raikin SM, Ledermann HP (2006) Neuropathic arthropathy of the foot with and without superimposed osteomyelitis: MR imaging characteristics. Radiology 238:622–631
26. Ledermann HP, Morrison WB (2005) Differential diagnosis of pedal osteomyelitis and diabetic neuroarthropathy: MR imaging. Semin Musculoskelet Radiol 9:272–283
27. Renner N, Wirth SH, Osterhoff G, Boni T, Berli M (2016) Outcome after protected full weightbearing treatment in an orthopedic device in diabetic neuropathic arthropathy (Charcot arthropathy): a comparison of unilaterally and bilaterally affected patients. BMC Musculoskelet Disord 17:504 28. Johnson PW, Collins MS, Wenger DE (2009) Diagnostic utility of
T1-weighted MRI characteristics in evaluation of osteomyelitis of the foot. AJR Am J Roentgenol 192:96–100
29. Donovan A, Schweitzer ME (2010) Use of MR imaging in diagnosing diabetes-related pedal osteomyelitis. Radiographics 30:723–736 30. Martin Noguerol T, Luna Alcala A, Beltran LS, Gomez Cabrera M, Broncano
Cabrero J, Vilanova JC (2017) Advanced MR imaging techniques for differentiation of neuropathic arthropathy and osteomyelitis in the diabetic foot. Radiographics 37:1161–1180
31. Eguchi Y, Ohtori S, Yamashita M et al (2011) Diffusion magnetic resonance imaging to differentiate degenerative from infectious endplate abnormalities in the lumbar spine. Spine (Phila Pa 1976) 36:E198–E202 32. Ruotolo V, Di Pietro B, Giurato L et al (2013) A new natural history of
Charcot foot: clinical evolution and final outcome of stage 0 Charcot neuroarthropathy in a tertiary referral diabetic foot clinic. Clin Nucl Med 38: 506–509
33. Lauri C, Tamminga M, Glaudemans A et al (2017) Detection of osteomyelitis in the diabetic foot by imaging techniques: a systematic review and meta-analysis comparing MRI, white blood cell scintigraphy, and FDG-PET. Diabetes Care 40:1111–1120
Publisher
’
s Note