Scalable Computing: Practice and Experience
Volume 15, Number 3, pp. 201–216. http://www.scpe.org
DOI 10.12694/scpe.v15i3.1016 ISSN 1895-1767
c
⃝2014 SCPE
A SYSTEM SUPPORTING THE EVALUATION OF THE OPERATIONAL EFFECTIVENESS OF NAVAL TASKS BASED ON AGENT SIMULATION∗
DAVIDE ANGHINOLFI†, ALBERTO CAPOGROSSO‡, MASSIMO PAOLUCCI§,
AND PERRA FRANCESCO¶
Abstract. This paper considers a system for supporting the multi-dimensional analysis of alternative configurations of military naval units, which is currently the object of a research and development project between Orizzonti Sistemi Navali, an Italian ship design company, and the University of Genova (Italy). The project aims at providing a decision making aid in the early phase of the vessels’ design. In particular, the agent-based simulation framework included in such a system is presented and its characteristics are compared with a set of four existing frameworks, i.e, MANA, NetLogo, Stage and MASON. Agent-based simulation is specifically exploited in the early design phase for the evaluation of the vessel efficiency in a set of reference naval tasks. The comparison is performed considering a common reference scenario and a set of qualitative and quantitative key performance indicators. The results obtained show both the effectiveness and efficiency of the proposed agent-based simulation environment for the considered application case.
Key words: Agent-based simulation, decision support systems, military naval tasks.
1. Introduction. During the early design phase of military naval vessels, it is of fundamental importance being able to evaluate their operational effectiveness with respect to the set of the main naval tasks in which such vessels will be engaged. This capability, indeed, allows to consider the possible different alternative design configurations from a multi-dimensional standpoint, associating with each of them aMeasure of the Effectiveness (MOE) of a specifically configured vessel in the main scenarios in which it is intended to operate, besides a number of key performance indicators as, for example, the cost.
This kind of analysis is investigated in a research project currently carried on in collaboration with Orizzonte Sistem Navali (OSN), an Italian company with great experience in total naval ship design and integrated support services. The project aims at supporting the design of naval vessels through the development of a system, denoted as Operational Evaluator Model (OEM), providing the evaluation of the operational effectiveness of particular ship configurations for a set of specified operating scenarios [1] [2]. This paper presents the main characteristics of such an operational evaluation support system, specifically focusing on the new simulation framework included in the OEM.
In general, simulation can significantly improve the design phase of naval units and specifically, in the considered context, Agent-Based Simulation (ABS) can play a fundamental role [3] [4] [5] [6] [7]. Therefore, one of the aims of the project consists in exploiting ABS in order to support the naval designers in their exploration of the space of alternative solutions and in the identification of a suitable ship configuration able to satisfy the customer requirements with good performance in terms of both operational effectiveness and costs. It must be underlined that, in the context of this project, the purpose of simulation is neither that of supporting the operational decisions of the commander, nor that of evaluating the effectiveness of operational tactics; differently, here simulation is used to provide ship designers and stakeholders with insights on what could be the expected behaviour of a vessel configured to satisfy certain requirements (e.g., maximum speed, presence of a helicopter on board, kinds of weapons). This means that the simulation specifically focuses on the ship configuration, whereas other aspects that in a real scenario may influence the performance of an operational vessel, such as, the meteo conditions or human factor as the commander skill, are considered fixed or not explicitly modelled.
This paper first presents in Section 2 the architecture and main functionalities of the OEM, as well as the characteristics of the developed ABS framework. In order to compare such framework with other existing ABS environments, a case study is introduced in Section 3 consisting in the so-called Anti-surface Warfare (ASuW). In particular, such a scenario assumes a set of patrol vessels in charge of protecting a strategic facility, e.g., a port located in a gulf, from the possible attack of small fast boats. Note that, in the last years, this scenario
∗This work was supported by Orizzonte Sistemi Navali S.p.A.
†DIBRIS Department, University of Genova, Genova, Italy, ([email protected]). ‡DIBRIS Department, University of Genova, Genova, Italy, ([email protected]). §DIBRIS Department, University of Genova, Genova, Italy, ([email protected]). ¶Orizzonte Sistemi Navali S.p.A., Genova, Italy ([email protected]).
has been usually associated with the defence from terrorist attacks. The patrol vessels use the radar to detect the threats and their actions are coordinated by a command centre on land; the patrol vessels have missiles and a gun to defend themselves from the missiles launched by the small fast boats, and their mission is considered successful if they are able to neutralize all the threats before these latter reach the facility. In Section 4 the implementation of this scenario with the new ABS Framework (in the following denoted as ABSF) included in the OEM is illustrated. In addition, in Section 5 a set of performance indicators are defined to facilitate the comparison of the different simulation environments. Such indicators assign to each of the considered frameworks a rating providing a qualitative or quantitative evaluation, having applied each environment to the same reference naval operational scenario.
The different simulation environments considered in the analysis presented in Section 6 of this paper are the followings:
• MANA (Map Aware Non-uniform Automata), developed by the Operational Analysis Section of the New Zealand Defense Technology Agency (DTA), is released for academic research purposes; the tool is used in a number of studies, such as the management of urban warfare, maritime surveillance and coastal patrol [8].
• NetLogo, developed at the Center for Connected Learning (CCL) of the Northwestern University (USA) by Uri Wilensky, is an open source visual environment that is particularly suitable for the analysis of complex natural and social phenomena, as well as military tasks. NetLogo provides a simple program-ming language in order to characterize the behavior of the agents and to specify the evolution of the simulation, and it is equipped with a graphics viewer that allows the users to visualize the evolution of the simulation and to interact with the agents [9].
• Stage, developed by Presagis Inc., is a commercial visual environment that allows to develop models of very complex war scenarios in terms of the involved platforms (avionics, naval, land, etc.) as it includes highly accurate models of sensors (radar, sonar, Missile Warning Set, etc.) and weapons (missiles, guns, etc.) [10].
• MASON, developed at Evolutionary Computation Laboratory of the George Mason University, is an open source function library developed in Java. MASON is designed to serve as the basis for a wide range of multi-agent simulation tasks, ranging from swarm robotics to machine learning to social complexity environments [11, 12, 13].
A previous version of the comparative analysis of the first three different ABS environments is provided in [14], where a number of limitations of such environments pointed out the need for a new ABS framework for the operational evaluation of military naval tasks. In this paper such an analysis is extended with the inclusion of MASON. It must be observed that NetLogo and MASON are general purpose environments, whereas MANA and Stage have been specifically designed for the simulation of military scenarios. As revealed by the comparative analysis, only NetLogo and MASON appear suitable for appropriate modelling the chosen reference scenario. Therefore, in Section 7 the statistical equivalence of the simulation models implemented using ABSF, NetLogo and MASON is demonstrated. Even if MASON tool overcomes most of the limitations highlighted in [14], in Section 8 the higher quality of the new ABS framework here proposed is confirmed. Finally, Section 9 reports some concluding remarks.
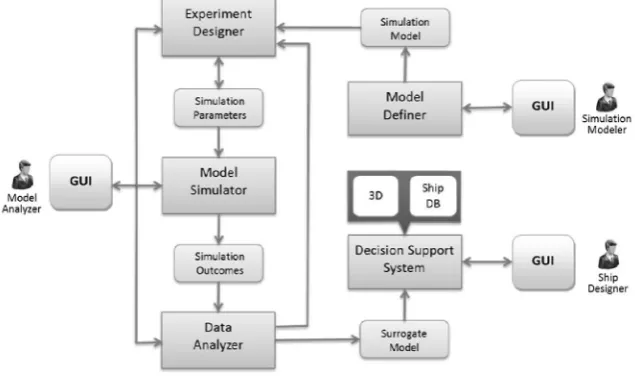
2. The OEM architecture and functionalities. The Operational Evaluation Model (OEM) is a de-cision support system aiming at the multi-dimensional analysis of alternative ship design configurations, in particular, with the capability of estimating the effectiveness of the considered vessel in a set of operational scenarios, and of taking it into account in the overall evaluation. OEM has been developed in the programming language C# and it includes in an integrated environment a framework for ABS modelling and simulating mil-itary naval scenarios. The overall architecture of such a support system is shown in Fig. 2.1. The environment is composed by five main modules: Model Definer, Experiment Designer, Model Simulator, Data Analyser and Decision Support System. The Data Analyser and the Decision Support System modules are not yet imple-mented in the current version of OEM, but they will be the object of the next developments of the project. The following of this section provides a description of each module.
A System Supporting the Evaluation of the Operational Effectiveness of Naval Tasks based on Agent Simulation 203
Fig. 2.1.The overall architecture of the Operational Evaluation Model.
Modeler in Fig. 2.1, can specify an ABS model by means of the following three types of diagrams:
• class-diagram, used to define both entities, i.e., the prototypes of the agents that can be included in the simulation models, and the set of messages that such agents can generate during the simulations; the user can define a new agent prototype by specifying:
– theUnique name for the prototype;
– the Attributes that represent the knowledge of the entity (e.g., the maximum speed for a naval unit);
– theStates that represent the operating modes of the entity (e.g., possible states for a naval unit could be Idle, Patrolling, Following and so on);
– theMessage traps that determine thebehaviours to be activated when receiving messages;
– theBehaviours corresponding to a set of activity-diagrams associated with the various states and Message traps;
• object-diagram, used to specify the instances of the agents deriving them from the available entities (e.g., having defined a Naval Unit entity, instances of agents as Unit1 or Unit2 with specific characteristics can be derived). To define a new instance of an agent the modeler user must specify:
– theUnique name for the agent;
– theValues for the Attributes included in the referenced agent prototype;
• activity-diagram, used to define the behaviour of the agents. An activity diagram consists in the sequence of actions that an agent must perform when it is in a specific state or when it receives a specific message. The ABSF included in the OEM provides a library of generic blocks (e.g., Change stateorSend message) and a library of naval blocks for ship simulations (e.g.,Get radar detected agents or Follow route).
The kind of agent model that the ABSF allows to define is quite general; different classes of agents (e.g., reactive, goal driven or belief-intention-desire agents) can be specified with the above mentioned model elements, provided that an appropriate set of building blocks is used to generate the agents’ behaviour. MD generates an output file that can be successively translated in a C# source program and then compiled. In this way the activity of designing and implementing a simulation model is greatly simplified without worsening the computational efficiency of the executable simulation code finally generated.
2.3. Model simulator. The Model Simulator (MS) is the core of the environment as it allows the syn-chronous evolution of the agent behaviours. MS has two different use modes:
• graphic mode – the real-time evolution of the simulation is graphically visualized in a window so that the user can observe and validate the behaviour of different agents. The window also includes controls for slowing down or speeding up the simulation, for suspending or resuming it, as well as zooming the graphic simulation area. A log including the fundamental simulation events occurred is also provided;
• batch mode – this mode allows to compress the time required to simulate the single experiments not providing any graphical representation of the simulation. The interface requires the specification of a configuration input file, in order to execute multiple experiments for a large number of the ship con-figurations, and the number of repetitions for each configuration needed to obtain a suitable statistical relevance.
2.4. Data Analyser. The Data Analyser (DA) is the module devoted to execute the statistical analysis of the results collected through the batch simulation mode with the purpose of generating a proper surrogate model. The surrogate model is an analytic function, e.g., a polynomials or a neural network, that returns a value of a MOE as a function of the values of a set of input parameters. The generic structure of the surrogate model is:
M OE=f(p1, ...., pn) (2.1)
where nis the number of parameters. An example of polynomial surrogate model (without cross-parameters) of the m-th order with n parameters is:
f =a11p1+a21p2+....+an1pn+a12p21+a22p22+....+an2p2n+
+...+a1mp m
1 +a2mp m
2 +....+anmp m n
(2.2)
where a11, ..., anm are the unknown coefficients.
To estimate the unknown coefficients, DA implements a set of algorithms e.g. Ordinary Least Squares for polynomial structures and Back Propagation for neural network structures.
2.5. Decision Support System. The Decision Support System (DSS) module provides a set of tools for multi-criteria decision support in order to perform the analysis of the alternative design configurations for a naval unit. DSS references the list of admissible ships (i.e., corresponding to design configurations that can actually be developed) contained in a Ship Database, and it is able to provide a 3D graphic representation of the vessel corresponding to a selected configuration by invoking an appropriate external 3D visualization module. DSS provides users with a tool for the multi-dimensional comparison of the alternatives, in particular the Pareto-optimal ones, in order to support the selection of the most suitable one for the stakeholders’ requirements.
A System Supporting the Evaluation of the Operational Effectiveness of Naval Tasks based on Agent Simulation 205
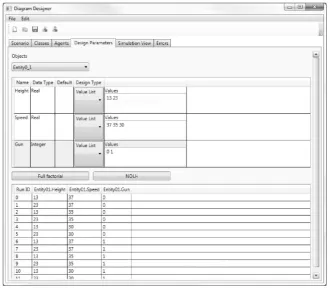
Fig. 2.2.The design parameter tab of the ED module.
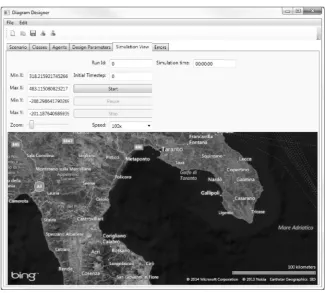
to simulate, the simulation speed and the dimension of the simulated area (note that the possible geographic coordinates are defined as scenario parameters). The interface allows to change the simulation speed during its execution, as well as pausing or stopping the run.
3. The Anti-Surface Warfare Scenario. In this section the main features of the ASuW scenario used as reference for the ABS framework comparison is introduced (for reader’s convenience, the list of the acronyms used for this scenario is provided in Tab. 3.1). The ASuW scenario consists in considering a facility in a gulf (i.e., a port) that must be protected against threats, represented by a group of Small Fast Attack Crafts (SFAC) [17].
Table 3.1
ASuW acronyms table.
Acronym Meaning
ASuW Anti Surface Warfare OPV Offshore Patrol Vessel SFAC Small Fast Attack Craft
SAM Surface-to-Air Missile SSM Surface-to-Surface Missile
The port is guarded by a set of Offshore Patrol Vessels (OPV) patrolling the area. The OPVs are equipped with a radar, so that they can detect the presence of the SFACs, and with ASuW weapons used to contrast the threats, which consist in a fixed number of surface-to-surface missiles (SSM) and a gun. The SFACs are assumed to be equipped with four SSM missiles used to attack the OPVs. Specifically, in this scenario it has been assumed that a SFAC launches a SSM against an OPV as soon as it realizes to be engaged or followed by it. On the other hand, the OPVs have three surface-to-air (SAM) missiles that are utilized, together with the gun, to neutralize the attacking missile.
Fig. 2.3.The simulation view tab of the MS module.
OPVs is considered successful if the port is defended, i.e., if all the threats are neutralized before reaching their target (the port). In this scenario a helicopter can be included in the OPVs configuration; in this case, the helicopter is assumed to perform the function of radar picket, i.e., it stays on a fixed position with the purpose of improving the threat detection ability of the defence system.
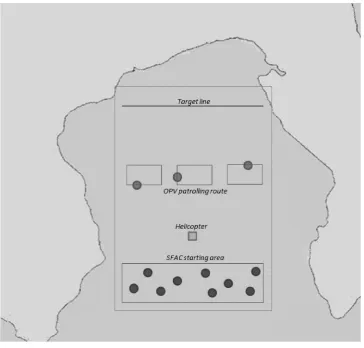
The ASuW scenario specifically considered in this paper includes nine SFACs and three OPVs. The gulf subject to possible attacks is schematically represented as a rectangular area of about 50×100 nautical miles (nm), situated in the Gulf of Taranto (Italy) so that the coasts are not affecting the operations. The scenario is shown in Fig. 3.1 where the horizontal line in the upper (north) side of the area represents the SFAC target. In Fig. 3.1 the three OPVs patrolling routes (consisting of straight stretches between successive patrol points) are represented, as well as the area in which the SFACs are assumed to be initially located when the simulation starts and the position of the helicopter, if present. The SFAC attack and OPV contrast strategies are summarized as follows:
• the OPVs patrol the area, according to given routes, whereas the helicopter, if present, maintains a fixed position;
• each SFAC moves from its starting position following a vertical trajectory (from south to north) at constant speed until reaching the target line;
• the SFACs start from a random position within the area shown in Fig. 3.1;
• the OPVs and the helicopter, if present, can detect the threats by radar sensor;
• if a threat is detected, its position is communicated to the ASuW Commander who assigns the OPVs to the SFACs. Specifically, the SFACs to be engaged are ordered according to their distance from the target line (threat evaluation);
• a list of at most three SFACs is assigned to each OPV; in particular, each SFAC is assigned to the nearest OPV;
A System Supporting the Evaluation of the Operational Effectiveness of Naval Tasks based on Agent Simulation 207
Fig. 3.1.Geometric representation of the considered ASuW scenario.
route;
• as soon as a SFAC realizes to be engaged or followed by an OPV, it launches a SSM against the OPV;
• the OPV engages with weapons a SFAC that is within its intercepting range in two cases:
(a) whenever is attacked by a SSM from the SFAC or
(b) whenever the SFAC is at sight range (in this latter case OPV can classify the SFAC as a threat). The preferred weapon system used by the OPV are the SSM missiles; if the OPV runs out of missiles it engages with the gun. A threat is neutralized with a probability given by a function depending on the kind of weapon and on the distance between the launcher and the target;
• if OPV is attacked by a SSM, it launches one or possibly two SAM to neutralize it. If this defence action fails, OPV tries to contrast the missile with the gun.
The OPV radar range depends on the radar height and on SFAC height. In particular, denoting withhOP V
andhSF AC the height respectively of the OPV radar and of the SFAC, the OPV radar range RRis given by
RR= 2.22×(√hOP V +
√ hSF AC
)
(3.1)
˙
θ=V
R (3.2)
where R∼=2L.
The weapon success probability functions have been provided by Italian Navy officers and they depend on the type of weapon. Fig. 3.2 and Fig. 3.3 plot the success probability function respectively for the gun and the SSM missile.
Fig. 3.2.Success probability function for the gun.
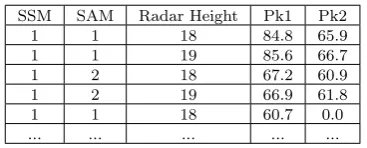
The probabilities for SAM missiles to destroy an SSM have been assessed by an analytic study of the anti-air warfare scenario. Tab. 3.2 reports a subset of such data, showing the probability that the first SAM destroy the SSM (PK1) and the one for the second SAM (PK2) as a function of the SAM and SSM types, and the OPV radar height (expressed in meter). Note that the value zero for PK2 denotes the impossibility to launch the second SAM in time to contrast the attacking SSM.
Fig. 3.3.Success probability function for an SSM missile.
Table 3.2
An excerpt of the success probabilities for SAM contrasting SSM.
SSM SAM Radar Height Pk1 Pk2
1 1 18 84.8 65.9
1 1 19 85.6 66.7
1 2 18 67.2 60.9
1 2 19 66.9 61.8
1 1 18 60.7 0.0
... ... ... ... ...
A System Supporting the Evaluation of the Operational Effectiveness of Naval Tasks based on Agent Simulation 209
The elements of the ASuW scenario that show an autonomous behaviour are modelled as agents. Therefore, in this scenario four classes of agents are introduced: the OPV, the SFAC, the Commander and the (launched) Missile. The missile agents are created during the simulation whenever an OPV or SFAC agent lunches an available missile, whereas the other classes of agents are created during the initialization of the scenario. Note that an element such as the helicopter, that, in a different scenario, could be modelled as agent, here simply plays the role of a sensor providing information to the OPVs and the Commander.
Fig. 4.1 and 4.2 give two examples of views of the unified GUI that are needed by the MD module. Specifically, Fig. 4.1 shows the class diagram tab that allows the definition of the entity and the message traps, whereas Fig. 4.2 shows the activity diagram tab used to define the behaviour of the agents. Any new item in both interfaces can be defined by dragging the item prototype from the toolbox in the left of the window to the workspace and then setting the appropriate properties. The items in the toolbox of the class diagram tab represent the prototypes of classes and messages, whereas the ones in the toolbox of the activity diagram tab correspond to the building blocks available to formalize the agent actions.
The Fig. 4.1 shows the definitions of the classes (OPV,Commander,Missile,SFAC) and the messages (En-emiesDetected,FollowEnemies,HitByMissile) for the ASuW scenario as it appears in the class-diagram tab of the MD GUI. The OPV class is characterized by two different states, i.e.,Patrol andFollow, respectively asso-ciated with the patrolling behaviour, which makes the OPV reaching in sequence a number of patrolling points, and the following behaviour, which makes the OPV direct towards a target (this behaviour is implemented by the workflow shown in Fig. 4.2). The Commander class has a single state ProcessEnemies associated with its threat evaluation and assignment behaviour. The SFAC class has two states,Idle andMoveToTarget, the first needed to model the possible delay before starting to move towards the target and the second associated with the SFAC mission of reaching the target line. Finally, the Missile class has a state Follow associated with the behaviour that moves it towards the target and a TargetReached state, assumed when the missile finishes its trajectory hitting or missing the target.
The model includes three kind of messages: the EnemiesDetected message, sent by an OPV to the Com-mander when the OPV detects a SFAC; the FollowEnemies message, sent by the Commander to an OPV in order to assign the threat; theHitByMissile message, send by a missile to its target when this latter is reached. Whenever a recipient receives a message it invokes the corresponding message trap behaviour. As an example, when an OPV receives a FollowEnemies message it starts itsFollow routine.
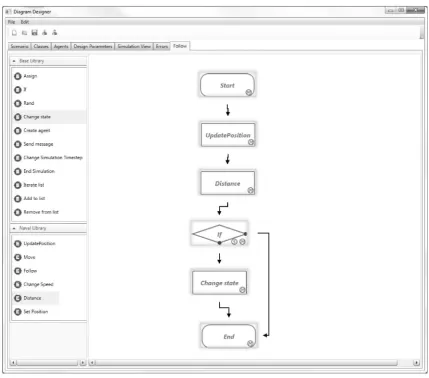
For each class of agents at least one behaviour must be modelled. For example, in Fig. 4.2 the behaviour prescribing an agent to follow a given target is shown. The behaviours are modelled usingworkflows. A workflow starts always with aStart block and finishes always with aEnd block. Considering the workflow in Fig. 4.2, at each time step the agent:
1. updates its position;
2. calculates the distance to the target and stores this value in a local variable;
3. checks if the distance is lower than a threshold, and in the positive case the agent changes its state to TargetReached, otherwise the agent remains in its current state.
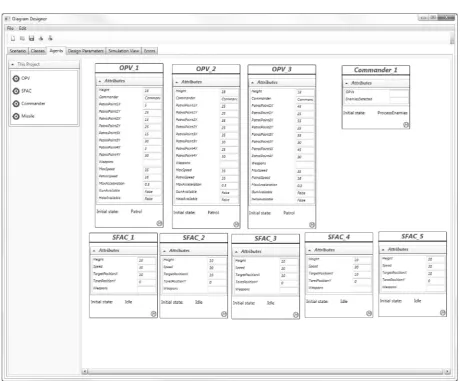
After the definition of the classes and the messages, a simulation model can be specified by creating the instances of the agents involved in the simulation. This can be done in the agent tab of the MD GUI, where an Object Diagram can be generated. As an example, Fig. 4.3 shows the agents included in the ASuW scenario that includes a Commander, three OPVs and five SFACs. Note that in this diagram there are no missile agents as these latter are only created at run time. In the agent tab the user must provide the initial values of the attributes for each agent instance (e.g., for OPV 1 PatrolSpeed is set to 16 kn).
5. Performance Indicators. In order to compare the considered simulation environments, both qualita-tive and quantitaqualita-tive key performance indicators (KPIs) have been defined. The qualitaqualita-tive KPIs aim at defining the ability of the simulation environment to comply with specific characteristics, whereas the quantitative KPIs provide some numerical indexes as detailed in the following.
5.1. Qualitative indicators. The following KPIs are used to evaluate the environment’s capacity to implement simulation scenarios with a degree of complexity comparable to the considered ASuW scenario.
Fig. 4.1. Definition of classes (OPV, Commander, Missile, SFAC) and messages (EnemiesDetected, FollowEnemies, Hit-ByMissile) involved in the ASuW scenario with MD Module of OEM.
2. Possibility of running multiple experiments in batch mode. This property makes it possible to execute extended experimental campaigns; specifically, the environment must allow reading the parameters characterizing the different experiments from some data structure or file, as well as writing the results in an appropriate way.
3. Presence of an integrated visual development environment. Such a tool reduces the complexity of defining new simulation model and the time needed for the development.
4. Possibility to implement complex agents. This is a qualitative judgement of what is the level of the complexity in the definition of the agents allowed by the environment, specifically in term of the type of data managed by the agents and of the elaborateness of the agent behaviour. As an example, the index takes into account the possibility of including complex data types (such as lists of structures) in the agent attributes. In the specific case of the ASuW scenario this index is specified considering the ability of the environment to define and manage the list of SFAC assigned to each OPV by the Commander. 5. Possibility to define complex coordination politics for the agents. With reference to the ASuW scenario,
A System Supporting the Evaluation of the Operational Effectiveness of Naval Tasks based on Agent Simulation 211
Fig. 4.2.An example of behaviour definition with the MD Module.
OPVs actions according to the complex threat evaluation and assignment rules.
6. Possibility to implement and manage the communication between agents. In the considered scenario this feature is needed to allow the ASuW commander communicating with the OPVs.
7. Availability of language primitives of an appropriate level. In the ASuW it is necessary to use mathe-matical equations, for example to implement the turn rate and the radar range.
5.2. Quantitative indicators. The following numerical KPIs can be adopted to compare the models developed by means of the different environments.
1. Number of code lines. This can be considered an index of the complexity of the development of the models, as well as of development time (note that this index is estimated by considering only the code needed to define agents and their behaviour);
2. Average time to perform a single run (in seconds); 3. Average time to perform 1000 runs (in seconds);
Fig. 4.3.Definition of the Agents involved in the ASuW scenario with MD Module of OEM
• MANA - It allows to define the topological characteristics of the scenario, such as the type and size of accessible areas and the presence of hot-points (i.e., starting points, target points and patrol points) [18]. The agent characteristics are defined by drop-down menus and scroll bars; for example, the tendency of the agents to direct towards either the next patrol point or the nearest threat, the speed and the agent icon. Agents can be equipped with armaments and sensors and their associated hit/detect probability can be specified by a data table as a function of distance. The MANA environment allows to execute a sequence of different runs of the scenario. The main limitation of MANA (confirmed also by a personal communication with one of its designers) is that it does not provide a programming language for describing complex agent behaviours. This made impossible to implement the scenario ASuW as described. In particular, the ASuW agent Commander assignment rules, the OPV air-air missiles defence behaviour, and the evaluation of algebraic expressions (i.e., the ones needed for the rate of turn and the radar range) cannot be implemented.
A System Supporting the Evaluation of the Operational Effectiveness of Naval Tasks based on Agent Simulation 213
so making the execution of multi-run simulation batches possible. An interesting feature is that the graphic interface can be deactivated during the multi-run simulation, making in this way the simulation quite fast. Summing up, NetLogo includes all the features needed to implement the ASuW scenario.
• Stage - It has a graphical environment that allows to create very sophisticated environments. Stage enables creating simulation models with realistic details, as it provides very detailed models of ships, vehicles, aircrafts, sensors and radar. The agent behaviour can be defined by an interpreted script language inspired by the C language. Stage integrates a development environment and an automated script analyser. The agents communicate using a standard communication protocol. In addition, the execution of a simulation can be distributed in a computer network to parallelize the computational burden. Stage definitely allows implementing the ASuW scenario. However, two main limitations were observed that prevent the use of Stage in batch mode: it is quite hard (at least for conventional designers or users) to simulate excluding the graphic output; it is not possible to perform multiple simulations.
• MASON - The scenario and the agent behaviours must be defined by coding in Java language. The framework supplies some features like a very high performance random numbers generator and some high efficiency data-structures. It supplies also some features to implement a customizable graphic interface. As an alternative, the simulation can run in batch mode, i.e. without interface, to speed-up it. In addition, the execution of a simulation can be distributed in a computer network to parallelize the computational burden. Therefore, MASON includes all the features needed to implement the ASuW scenario.
Table 6.1
KPI comparison for the simulation environments
MANA NetLogo Stage MASON Qualitative Indicators
Monte Carlo simulations × √ √ √
Batch multiple experiments √ √ × √
Visual development environment √ √ √ √
Complex agent definition × √ √ √
Complex agent coordination politics × √ √ √
Communication among agents × √ √ √
Appropriate language primitives × √ √ √
Quantitative Indicators
Source lines of code – 1000 700 1300
Average time for single run (s) – 0.6 480 0.015
Average time for 1000 runs (s) – 754 – 20
Tab. 6.1 summarizes the main features observed (here a cross denotes the lack of the corresponding feature, whereas a dash the impossibility to collect the data). Observing the quantitative KPIs, the number of code’s lines needed by Mason to implement the agent behaviours is greater than the one of NetLogo: this indicates that NetLogo provides an higher level language compared to the one provided by Mason. The low number of lines of code required for the implementation of the scenario in Stage is due to the fact that the environment has been developed specifically for the management of military simulations.
Finally, the batch run time results are shown only for NetLogo and MASON, as MANA does not allow the appropriate design for the considered scenario and Stage does not permit the batch execution mode. Comparing the simulation times obtained using Mason and NetLogo, it can be noticed that the first is about 40 times faster than the second. This result is due to the fact that NetLogo uses a scripting language, while Mason uses Java language which is semi-compiled.
were analyzed and for each of them 1000 repetitions were executed, each of which producing a binary value (representing the success/failure in defending the target) as simulation outcome. The tested configurations correspond to all the combinations of the values for the parameters shown in Tab. 7.1.
Table 7.1
The tested OPV configurations
Parameter Values
OPV Height m {13, 23} OPV Speedkn {37, 35, 30} Helicopter presence {true, false} Gun presence {true, false}
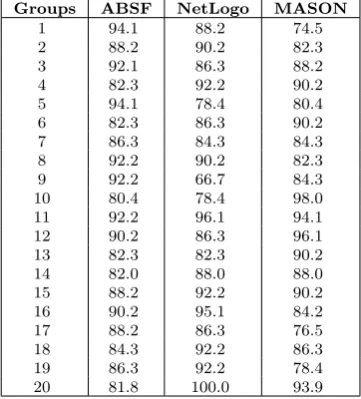
The binary outcomes obtained from the models were divided into 20 groups, each consisting of 50 elements. For each group the relative OPV success frequency was calculated. As an example, Tab. 7.2 shows the success frequencies obtained for the configuration characterized byOPV Height = 13m,OPV Speed= 37kn,Helicopter presence = true,Gun presence = true.
Table 7.2
The relative success frequency for a tested configuration.
Groups ABSF NetLogo MASON
1 94.1 88.2 74.5
2 88.2 90.2 82.3
3 92.1 86.3 88.2
4 82.3 92.2 90.2
5 94.1 78.4 80.4
6 82.3 86.3 90.2
7 86.3 84.3 84.3
8 92.2 90.2 82.3
9 92.2 66.7 84.3
10 80.4 78.4 98.0
11 92.2 96.1 94.1
12 90.2 86.3 96.1
13 82.3 82.3 90.2
14 82.0 88.0 88.0
15 88.2 92.2 90.2
16 90.2 95.1 84.2
17 88.2 86.3 76.5
18 84.3 92.2 86.3
19 86.3 92.2 78.4
20 81.8 100.0 93.9
Successively, the hypotheses needed to correctly perform the test of analysis of variance (ANOVA) were verified on the obtained data. In particular, the well-known Jarque-Bera test was used to verify the hypothesis of normality of the data series and the Welch test to verify the hypothesis homoscedasticity. Then, the ANOVA test was used to validate the hypothesis of equivalence of the models. Fig. 7.1 shows the box-plots obtained from the ANOVA test. From Fig. 7.1 it can be observed how the three boxes are almost overlapped, so that it can be concluded that the three implemented models can be considered statistically equivalent for the configurations shown in Tab. 7.2. The equivalence of the three models was also confirmed for the other configurations in Tab. 7.1.
8. Comparison between ABSF, NetLogo and MASON. Having established the equivalence of the models produced by ABSF, NetLogo and MASON, the three frameworks were evaluated over the KPIs defined in Section 5. Tab. 8.1 reports the obtained results for the quantitative KPIs, provided that the three considered environments have the same qualitative characteristics.
A System Supporting the Evaluation of the Operational Effectiveness of Naval Tasks based on Agent Simulation 215
Fig. 7.1.The box-plot produced by ANOVA
Table 8.1
KPI comparison of ABSF, NetLogo and MASON
Quantitative Indicators ABSF NetLogo MASON
Source lines of code 0 1000 1300
Average time for single run (s) 0.003 0.6 0.015 Average time for 1000 runs (s) 5 754 20
Observing the comparison among the simulation times needed by ABSF, NetLogo and MASON, it can be observed that the average times for 1000 runs obtained by ABSF were about 4 times lower than those obtained by MASON, and 150 times lower than those obtained by NetLogo. It is worth recalling that for the three models the simulation experiments were run on the same computer and they were executed without any graphical interface to minimize the computational burden.
9. Conclusions. This paper presents the main features of a project carried on in collaboration with OSN, an Italian company specialized in total naval ship design, aiming at supporting the early phase of military naval unit design. In particular the OEM support system should enable human designers and stakeholders to evaluate different configurations also from the point of view of the operational effectiveness of the resulting ship in a set of operating scenarios.
This paper devotes particular attention to the agent-based simulation framework included in the OEM and it provides evidence in favour of its suitability as a tool for rapidly modelling military naval scenarios and efficiently simulating them. To this end, the main characteristics and limitations of a set of agent-based simulation environments have been analysed, using as a reference a specific Anti-surface Warfare scenario. As a result of such an analysis, the quality of ABSF as excellent simulation tool was proved, since it is able to overcome the main limitations of the other simulation environments considered and to outperform, in terms of ease of development and run execution speed, MASON, the best one among the competitors.
The high quality computational performance showed by ABSF are actually very important, as it allows to decrease the time needed for exploring the space of the possible configurations of the naval units, so facilitating a deeper alternative analysis. Differently from MASON, the Model Definer module included in the proposed framework lets the user define scenarios without the need to know or learn any programming language, or, as is the case for NetLogo, any scripting languages.
REFERENCES
[1] M. Tiah,n Analysis Of Small Navy Tactics Using A Modified Hughes Salvo Model, thesis, Naval Post Graduate School, 2007. [2] W. P. Hughes,Fleet Tactics: Theory and Practice, Naval Institute Press, Annapolis, MA, 2000.
[3] R. L. Axtell, and J. M. Epstein, Agent-Based Modeling: understanding our creations, The Bulletin of the Santa Fe Institute, Winter (1994), pp. 28–32.
[4] K. Decker, and V. Lesser,Quantitative Modeling of Complex Environments, Computer Science Department, University of Massachusetts Technical Report (1994) pp. 93–21.
[5] A. Vag,First generation multi-agent models and their upgrades, Interdisciplinary Description of Complex Systems, Vol. 2, No. 1, 2004, pp. 95–103.
[6] B. Heath, R. Hill and F. Ciarallo,A Survey of Agent-Based Modeling Practices, Journal of Artificial Societies and Social Simulation, Vol. 12, No. 4, 2009.
[7] M. T. Cioppa, and W L. Lucas,Military Applications Of Agent-Based Simulation, Proc. Winter Simulation Conference, 2004.
[8] M. K. Lauren and R. T. Stephen, Map-aware Nonuniform Automata (MANA) a New Zealand Approach to Scenario Modelling, Journal of Battlefield Technology, Vol. 5, No. 1, 2009.
[9] U. Wilensky,NetLogohttp://ccl.northwestern.edu/netlogo/, (Accessed: July 30, 2013).
[10] Presagis Inc., Presagis Stage, http://www.presagis.com/products_services/products/modeling-simulation/ simulation/stage/, (Accessed: July 30, 2013).
[11] S. Luke, C. Cioffi-Revilla, L. Panait, K. Sullivan, G. Balan, A Multi-Agent Simulation Environment, Simulation: Transactions of the society for Modeling and Simulation International, Vol. 82, No. 7, 2005, pp. 517–527.
[12] S. Luke, C. Cioffi-Revilla, L. Panait, and K. Sullivan,A New Multi-Agent Simulation Toolkit, Proc. SwarmFest Work-shop, 2004.
[13] S. Luke, C. Cioffi-Revilla, L. Panait, K. Sullivan, G. Balan,MASON: A Java Multi-Agent Simulation Library, Proc. Agent 2003 Conference, 2003.
[14] D. Anghinolfi, A. Capogrosso, M. Paolucci and F. Perra,An agent-based simulator for the evaluation of the mea-surement of effectiveness in the military naval tasks, Proc. 17th International Conference System Theory, Control and Computing (ICSTCC), 2013, pp. 733–738.
[15] D. C. Montgomery,Design and analysis of experiments, Wiley, Hoboken, NJ, Year 2009.
[16] D. Bingham, R.R. Sitter and B. Tang,Orthogonal and nearly orthogonal designs for computer experiments, Biometrika, Vol. 96, No. 1, 2006, pp. 51–65.
[17] N. E. Wissel,Surface Combatant Readiness To Confront A Sea Control Navy, thesis, Naval Post Graduate School, 2008. [18] A. W. Gill,Improvement to the Movement Algorithm in the MANA AgentBased Distillation, Journal of Battlefield
Tech-nology, Vol. 7, No. 2, 2004, pp. 19–22.