Research Article ISSN 2250-0480 VOL 6/ ISSUE 4 /OCTOBER 2016
P - 22
Pharmaceutical Science Chemistry
A SIMPLE HPLC METHOD FOR
IN-VITRO
DISSOLUTION STUDY OF
SERTRALINE HYDROCHLORIDE IN TABLETS
SUSHIL P. NARKHEDE*1, SANTOSH KUMAR SINGH1, G. VIDYASAGAR1
*1
Department of Pharmaceutical Sciences, Suresh Gyan Vihar University, Jaipur, India
ABSTRACT
The main aim of present work was to develop and validate a dissolution test for Sertraline Hydrochloride in tablets using HPLC method. The dissolution established conditions were: 900 ml of 0.05M Acetate buffer pH 4.5 as dissolution medium, using a paddle apparatus at a stirring rate of 75 rpm. The chromatographic condition employed a C-18 column (Eurospehere, 250 x 4.6mm, 5µm), isocratic elution with Acetonitrile:Methanol:Phosphate buffer pH 3 (20:50:30 V/V/V) and UV detection at 274 nm. The method was validated to meet requirements for a global regulatory filing. The dissolution test developed was adequate for its purpose and could be employed for routine quality control of Sertraline Hydrochloride tablets.
KEYWORDS:Sertraline Hydrochloride, Dissolution method, HPLC, Validation
INTRODUCTION
The Dissolution test has emerged in the pharmaceutical field as a very important tool to characterize drug product performance. It provides measurements of the bioavailability of a drug as well as can demonstrate bioequivalence from batch-to-batch. Besides, dissolution is a requirement for regulatory approval for product marketing and is a vital component of the overall quality control program1.Sertraline Hydrochloride (SER), (1S,4S)-4(3,4dichlorophenyl)Nmethyl1,2,3,4tetrahydronaph thalen-1-amine hydrochloride (Fig. 1) is white or almost white powder, slightly soluble in water, freely soluble in anhydrous ethanol, slightly soluble in acetone and in isopropanol. SER is primarily selective serotonin reuptake inhibitor (SSRI), belongs to the category of antidepressant drug
2
.Literature survey reveals that no instrumental method is reported for estimation of percent release of SER from tablet. Hence an attempt has been made to develop an ideal dissolution method for determination of percent release of drug from their dosage form 3-19
MATERIAL AND METHODS
The drug Sertraline HCl (SER) was obtained as a gift sample from Matrix Laboratories Ltd., Nashik
(MS, India). Acetonitrile, and Methanol of analytical grade were purchased from Priya Scientific Pvt. Ltd., Vapi. The HPLC was of Waters Alliance System equipped with DAD. The Dissolution Apparatus (Type II) was of ELECTROLAB, Model: TDT 06P. In addition an electronic balance (CONTECH), Digital pH meter (AE-MAX), Ultrasonicator (CITIZEN), Hot air oven (LABLINE) was used in this study. All the glass apparatus used in this study was of BOROSIL.
Preparation of Stock Solution and Dissolution Medium
Dissolve 136 gm of sodium acetate and 77 gm of ammonium acetate in water and dilute with water to 1000 ml. Add 250 ml of glacial acetic acid and mix. Stock solution was prepared by weighing 50 mg of SER. Transfer the weighed drug to 50 ml volumetric flask and make up the volume up to the mark with methanol to obtain solution containing 1000 µg/ml of SER. The solution was further diluted with dissolution medium to obtain final concentration of 10-60 µg/ml of SER.
Selection of Sampling Wavelength
Research Article ISSN 2250-0480 VOL 6/ ISSUE 4 /OCTOBER 2016
P - 23
Pharmaceutical Science Chemistry
(λ max) was observed at 274 nm and selected for
estimation. It is shown in Figure. 2
Linearity Study
Suitable aliquots of SER stock solution were taken in different 10 ml volumetric flask and diluted up to
the mark with dissolution medium to obtain final concentration of 10-60 µg/ml of SER. Chromatographic peak area was measured at 274 nm. Calibration curve were constructed by plotting Peak area versus Concentration as shown in Figure
3.
Instrument Analysis Condition For HPLC Instrument
Chromatographic Condition for Analysis
Instrument : Waters Alliance System (Software- Empower 3) Column : Eurosphere-100 C18, 2504.6 mm, particle size 5 m.
MobilePhase Acetonitrile:Methanol:Phosphate buffer pH 3 (20:50:30 V/V/V) Flow Rate : 1.0 ml/min.
Wavelength : 274 nm. Injection Volume : 20 l. Column temperature : Ambient
For Dissolution Apparatus
Apparatus : Electrolab USP, Type II (Paddle) Dissolution Medium : Acetate buffer pH 4.5 (900ml)
Speed : 75 rpm
Temperature : 37°C ±0.5°C
Time : 45 min (Profile 5, 10,15,30,45 min)
Analysis of Marketed Formulations
Prepare standard solution of
Sertraline Hydrochloride (SER) by dissolving 50 mg SER in 50 mL mobile phase in volumetric flask. Dilute 3 ml of this solution to 100 ml with dissolution medium in volumetric flask. Filter this solution through MDI syringe filter and fill up the sample cuvette. The 20 µl of standard solution is injected into the HPLC system and quantification was done from regression line equation of calibration curve.The tablets having 50mg of Sertraline Hydrochloride (SER) were studied in developed dissolution medium at 37 ± 0.5°C. Place one tablet in 900 ml dissolution medium and immediately run dissolution apparatus up to 45 min. The dissolution was carried out in USP apparatus II at 75 rpm. The samples withdrawn after time interval of 5, 10, 15, 30, 45 mins, diluted with mobile phase solutions as above, filtered through 0.45µm membrane filter. Measure the peak area of solution and quantification was done from regression line equation of calibration curve. The % of drug release is listed in Table 2 and the results were represented. The in vitro release profile of marketed formulation (Product-A, Product-B and Product-C) of Sertraline Hydrochloride (SER) is represented in Figures 4. The sample withdrawn after time interval of 45 mins chromatogram is shown in Figure 5.
Method Validation20-25
Research Article ISSN 2250-0480 VOL 6/ ISSUE 4 /OCTOBER 2016
P - 24
Pharmaceutical Science Chemistry
of 30 µg/ml of Sertraline Hydrochloride. After small changes in this parameter effect peak areas
were determined and mean and RSD of peak areas calculated.
a) Change in % organic phase of mobile phase by ± 5.0 %
b) Change in pH of buffer of mobile phase by ± 0.5 of set pH
c) Change in the flow rate of the mobile phase by ±10 % of the original flow rate.
d) Change in detection wavelength by ± 5.0 nm e) Change in column temperature by ± 5.0 ºC
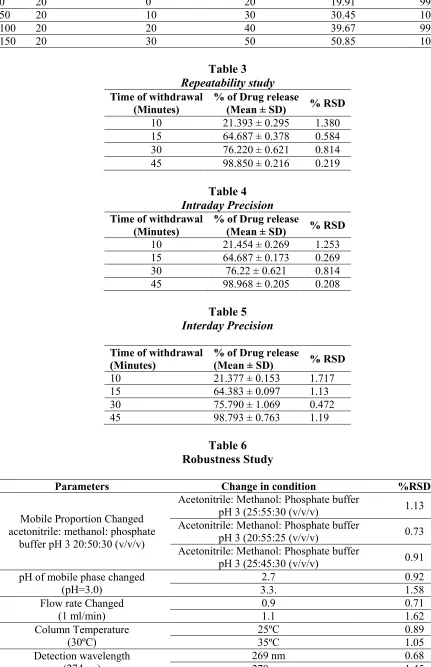
The method was found to be robust, as small but deliberate changes in method parameters have no detrimental effect on the method performance as shown in Table 6. The low value of percentage relative standard deviation indicates that the method is robust.Ruggedness of the proposed method is determined by analysis of aliquots from homogenous slot by different analyst.To ascertain its effectiveness, certain system suitability test parameters were checked by repetitively injecting the drug solution at the concentration level 30µg/ml for Sertraline Hydrochloride (SER), respectively to check the reproducibility of the system and results obtained are summarized in Table 8.
RESULT AND DISCUSSION
Drug solubility and solution stability are important properties to be considered when selecting the dissolution medium. SER stability in dissolution medium was evaluated at 37.0 ± 0.5ºC for 3 hours. No change in peak area after 3 hours indicates the stability of SER. In this study, 0.05M acetate buffer pH 4.5 is used as dissolution medium. An important aspect it simulates the environment in GI track which monitor biopharmaceutical characteristic of the drug product, 900 ml 0.05M acetate buffer pH4.5 provides sink condition for tablet containing
50 mg Sertraline Hydrochloride. USP Type II with
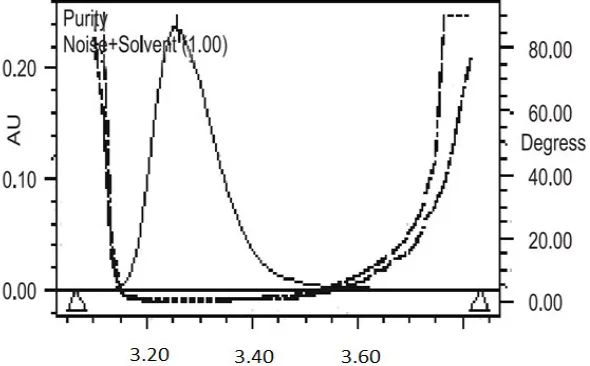
Paddle rotating at 75 rpm was selected as a dissolution apparatus was selected for the dissolution study.UV-spectra of SER showed that the drug absorbed appreciably at 274 nm, so this wavelength was selected as the detection wavelength. The calibration curve for SER was found to be linear over the range of 10-60 μg/ml. The data of regression analysis of the calibration curves is shown in Table 1. The proposed method was successfully applied for the estimation of SER in their tablet dosage form (Table 1, Fig 3).The accuracy expresses the agreement between the accepted value and the value found. The % Recovery was found between 99.17% – 101.7%, it proved that method is accurate (Table 2). The precision of the dissolution tests was evaluated through variation in the result in same day (intraday) and variation of the result between days (inter day). These results can demonstrate the good precision of the method for dissolution test (Table 3, 4 and 5).Limit of detection (LOD) for SER was found to be 2.1 μg/ml and Limit of quantification (LOQ) for SER was found to be and 6.93 μg/ml Specificity was examined by analyzing a solution of a placebo, which consisted of all the excipients the might be present in tablets except the drug. The excipients were lactose, dibasic calcium phosphate, maize starch, sodium starch glycolate, croscarmellose sodium, talc and magnesium stearate. Their concentrations were determined based in Handbook of Pharmaceutical Excipients and calculated for a medium weight of content. The peak purity index and HPLC chromatogram showed peaks of the drugs (Sertraline Hydrochloride) without any interfering peak and the estimation of the drug were found to be satisfactory (Fig. 6).The result of Ruggedness evaluation was shown in Table7.
Figure 1
Research Article ISSN 2250-0480 VOL 6/ ISSUE 4 /OCTOBER 2016
P - 25
Pharmaceutical Science Chemistry
Figure 2
UV-Spectra of Sertraline Hydrochloride in 0.05M Acetate buffer pH 4.5
Figure 3
Calibration curve for SER
Figure 4
Research Article ISSN 2250-0480 VOL 6/ ISSUE 4 /OCTOBER 2016
P - 26
Pharmaceutical Science Chemistry
Figure 5
HPLC Chromatogram of sample solution of Sertraline Hydrochloride (SER) after time interval of 45 minutes
Peak Purity of Sertraline Hydrochloride
Table 1
Linearity data of SER by HPLC Method
Parameters Sertraline Hydrochloride
Linear Range 10 – 60 µg/ml
Slope 15113
Intercept 53147
Regression Coefficient (r2) 0.998 Standard deviation of slope 15.452 Standard deviation of intercept 19.854
LOD (μg/ml) 2.1 µg/ml
Research Article ISSN 2250-0480 VOL 6/ ISSUE 4 /OCTOBER 2016
P - 27
Pharmaceutical Science Chemistry
Table 2
Accuracy Study
Sr.
No. Level
Amount of drug present in sample (µg/ml)
Amount of Std. drug added (µg/ml)
Total amount of Drug (µg/ml)
Amount of drug found (µg/ml)
% Recovery ± SD
1 0 20 0 20 19.91 99.55 ±0.661
2 50 20 10 30 30.45 101.5 ± 1.41
3 100 20 20 40 39.67 99.17 ±0.625
4 150 20 30 50 50.85 101.70±1.112
Table 3
Repeatability study
Time of withdrawal (Minutes)
% of Drug release
(Mean ± SD) % RSD
10 21.393 ± 0.295 1.380
15 64.687 ± 0.378 0.584
30 76.220 ± 0.621 0.814
45 98.850 ± 0.216 0.219
Table 4
Intraday Precision
Time of withdrawal (Minutes)
% of Drug release
(Mean ± SD) % RSD
10 21.454 ± 0.269 1.253
15 64.687 ± 0.173 0.269
30 76.22 ± 0.621 0.814
45 98.968 ± 0.205 0.208
Table 5
Interday Precision
Time of withdrawal (Minutes)
% of Drug release
(Mean ± SD) % RSD
10 21.377 ± 0.153 1.717
15 64.383 ± 0.097 1.13
30 75.790 ± 1.069 0.472
45 98.793 ± 0.763 1.19
Table 6 Robustness Study
Parameters Change in condition %RSD
Mobile Proportion Changed acetonitrile: methanol: phosphate
buffer pH 3 20:50:30 (v/v/v)
Acetonitrile: Methanol: Phosphate buffer
pH 3 (25:55:30 (v/v/v) 1.13
Acetonitrile: Methanol: Phosphate buffer
pH 3 (20:55:25 (v/v/v) 0.73
Acetonitrile: Methanol: Phosphate buffer
pH 3 (25:45:30 (v/v/v) 0.91
pH of mobile phase changed (pH=3.0)
2.7 0.92
3.3. 1.58
Flow rate Changed (1 ml/min)
0.9 0.71
1.1 1.62
Column Temperature (30ºC)
25ºC 0.89
35ºC 1.05
Detection wavelength (274nm)
269 nm 0.68
Research Article ISSN 2250-0480 VOL 6/ ISSUE 4 /OCTOBER 2016
P - 28
Pharmaceutical Science Chemistry
Table 7
Ruggedness Study
Sr. No. Time (Min)
Analyst I*
Conc. ± SD % CV
Analyst II*
Conc. ± SD % CV
1 10 15.84 ± 0.067 0.152 15.76 ± 0.031 0.148
2 15 23.62 ± 0.033 0.144 23.95 ± 0.029 0.098
3 30 42.83 ± 0.051 0.159 42.84 ± 0.075 0.173
Table 8
System Suitability Test Result
Sr.
No. Rt. (min) Peak area
Tailing factor
(T) No. of Theoretical plates (N)
Capacity factor (K’)
Selectivity (α)
1 3.21 526231 1.74 6261.4 2.05 2.11
2 3.25 530461 1.75 6387.35 2.09 2.13
3 3.22 523446 1.69 6378.73 2.12 2.14
4 3.33 526316 1.73 6290.03 2.11 2.07
5 3.27 541211 1.75 6269.98 2.14 2.12
Mean 3.256 529533 1.732 6317.498 2.102 2.114
S.D 0.05 6991.79 0.02 60.80 0.03 0.03
% RSD 1.47 1.32 1.44 0.96 1.63 1.28
CONCLUSION
The dissolution test developed and validated for SER tablets was considered satisfactory. The conditions that allowed the dissolution determination were 900 ml of 0.05M Acetate buffer pH 4.5 at 37.0 ± 0.5 ºC, paddle apparatus, 75 rpm stirring speed and filtration with quantitative filter. In these conditions, the SER stability was guarantee. The % drug delivery was higher than 90% in 45 minutes for all evaluated products. The High Performance Liquid Chromatography (HPLC) method was validated and showed to be specific,
linear, precise and accurate. Hence, the dissolution test developed was adequate for its purpose and could be employed for routine quality control of Sertraline Hydrochloride tablets.
ACKNOWLEDGEMENT
The authors would like to thanks Matrix Laboratories Ltd., Nashik (MS, India) for supply of standard drug and SGVU, Jaipur (RJ, India) for their support.
REFERENCES
1. Dressman J, Kramer J, Pharmaceutical dissolution Testing, Taylor & Francis Group, LLC, 2005.
2. British Pharmacopoeia, HMSO Publication: London; 2009, Vol.I and II, 5379.
3. Adams AIH; Bergold, AM Journal of Pharmaceutical and Biomedical Analysis, 2001, 26, 505–508.
4. Chen D, Jiang S, Chen Y, Hu Y. Journal of Pharmaceutical and Biomedical Analysis, 2004, 34:1, 239-245.
5. Jain DS, Sanyal M, Subbaiah G, Pande UC, Shrivastav P. Journal of Chromatography B, 2005, 829:1-2, 69-74.
6. Kim K. M, Jung B. H, Woo J. S, Paeng K. J, Chung B. C. Journal of Chromatography B:
Analytical Technologies in the Biomedical and Life Sciences, 2002, 769:2, 333-339. 7. Lories I, Bebawy LI, El-Kousy N, Suddik JK,
Shokry M. Journal of Pharmaceutical and Biomedical Analysis, 1999, 21, 133–142. 8. Lucangioli SE, Hermida LG, Tripodi VP,
Rodriguez VG, Lopez EE, Rouge PD, Carducci CN. Journal of Chromatography A, 2000, 871, 207–215.
9. Mandrioli R, Saracino MA, Ferrari S, Berardi D, Kenndler E, Raggi MA. Journal of Chromatography B, 2006, 836:1-2, 116-119. 10. Wiener HL. Journal of Chromatography,
1990, 527, 467-472.
Research Article ISSN 2250-0480 VOL 6/ ISSUE 4 /OCTOBER 2016
P - 29
Pharmaceutical Science Chemistry
12. Green JM. In; A Practical Guide to Analytical Method Validation, Anal.Chem. News & Features, May 1, 1996, 305A/309A.
13. Sivaiah Sangaraju, Rao BM, Shyam Kumar BM, Someswararao N. “Rasayan J. Chem.” 2009, Vol.2, No.1, 42-48
14. Rubel Ratnia, Virendra Yadav, Amit Kumar, “International Journal of Pharma Research and Health Sciences” 2015, Volume 3 (2), Page-616-620
15. B. Victoria Rani, Parthiban C, Sudhakar M., “Int J Pharm Pharm Sci.”, 2015, Vol 7, Issue 2, 465-468
16. Mohamed I Walash, Fathallah F Belal, Nahed M El-Enany and Heba Elmansi, “Chemistry Central Journal”, 2011, 5:61, 1-11
17. Sameena Kouser, Humera Reshma, “Der Pharmacia Sinica”, 2014, 5(6):36-46
18. E. Anka Rao, “Pharmanest: An International Journal of Advances In Pharmaceutical Sciences”, 2010, Vol.1 (2), 293-297
19. Zhang M, Gao F, Cui X, Zhang Y, Sun Y, Gu J. “J Chromatogr Sci.”, 2011;49(2):89-93 20. ICH / CPMP Guidelines Q2B, Validation of
Analytical Procedures Methodology, 1996. 21. ICH/CPMP guidelines Q2A, Text on
Validation of Analytical Procedures, 1994. 22. The United State Pharmacopoeia (USP 27),
National Publishing Philadelphia, Asian Edn., 2004, 2622-2624.
23. US FDA, General Principles of Validation, Rockville, MD, Center for Drug Evaluation and Research (CDER), May 1987.
24. US FDA, Guidelines for Submitting Samples and Analytical Data for Method Validation,Rockville, MD, Center for Drugs and Biologics Department of Health and Human Services, Feb. 1987.