Officinalis
Gaertn.) Slices Cv. Chakaiya Prior to Air Drying
M.S. Jadhav1,H.G. More2, C.A. Nimbalkar31
Associate Professor, Processing and Food Engineering, Dr. Annasaheb Shinde College of Agricultural Engineering, Mahatma Phule Krishi Vidyapeeth Rahuri 413722 (India)
2
Ex. Director of Extension Education, Mahatma Phule Krishi Vidyapeeth Rahuri 413722 (India), 3
Associate Professor, Department of Agricultural Statistics, Post Graduate Institute, Mahatma Phule Krishi Vidyapeeth, Rahuri, India-413722
Abstract
Investigation on osmotic dehydration of aonla slices of Chakaiya variety was carried out to remove
partial moisture prior to convective drying. Three sugar concentration levels (50, 60 and 70oBrix),
three temperatures levels of osmotic solution (40, 50 and 60oC) and constant solution to fruit ratio
of 6:1 (v/w) were employed and observations on water loss and solute gain were recorded at an interval of 15, 30, 60, 90, 120, 180 and 240 min. A two parameter mathematical model developed
by Azura et al. was used for describing the mass transfer kinetics during osmotic dehydration of
aonla slices. Effects of immersion time on mass transfer was studied and constants of two parameter model and final equilibrium points for water loss and solute gain were determined. Water loss from and solute gain by the aonla slices increased non-linearly with the duration of osmosis at all sugar concentrations and both were higher in the initial period of osmosis than the later period. Further, both the water loss and solute gain were increased with increasing sugar concentration. Model was able to predict mass transfer data of osmotic dehydration up to the equilibrium point using data of relatively short duration of osmosis.
Keywords-Aonla, Modeling, Water loss, Solute gain, Equilibrium water loss, Equilibrium solute
gain
I. INTRODUCTION
Osmotic dehydration (OD) is a process for the partial removal of water from plant tissues such as fruits and vegetables by immersion in an aqueous concentrated solution of soluble salts. A driving force for the diffusion of water from the tissue into the solution is provided by the difference in osmotic pressure or concentration gradient between the food and surrounding osmotic solution. A diffusion of water is accompanied by the simultaneous counter diffusion of solute from the osmotic solution into the tissue. Since the membrane responsible for the osmotic transport is not perfectly selective, other solutes such as sugar, organic acids, minerals, salts and vitamins present in the cells can also be leached into the osmotic solution (Giangiacomo et al. [8] and Tortoe et al. [19]). But this flow can be quantitatively neglected.
geometric considerations and can’t predict the end equilibrium point of the process. Several proposed equations based on Fick’s second law are not useful practically due to the fact that some of the assumptions are unrealistic and also because of complexity of equations. Mathematical modelling of mass fluxes during osmotic dehydration process gives invaluable information to have clearer understanding of dehydrated material composition and operational design. Azura et al. [2] recommended simpler empirical equation including parameters with physical meaning. This empirical equation has been used to model the rate of dehydration of different plant-based materials (Schmit et al. [6] and Mercali et al. [13]). However, in literature, the suitability of this equation to model the dehydration rate of aonla is scarce. Aonla is known for exceptionally high amount of ascorbic acid and is important fruit also highly valued among Indian medicines. Therefore, the present study was undertaken to investigate the effect of osmotic process parameters on mass transfer kinetics of aonla slices and to develop the mathematical model for water loss and solute gain in the form of Azura et al. [2].
II. MATERIALS AND METHODS
Fresh aonla fruits of variety Chakaiya (Neelam) were procured from an orchard of Department of Horticulture, Mahatma Phule Krishi Vidyapeeth, Rahuri (India). The aonla fruits were sorted for uniform size (32.5±1 mm), colour, maturity and physical damage; washed with potable water and then wiped with a muslin cloth to remove surface moisture. Fruits were blanched in boiling water for 5 min and cut to 5 mm thick uniform slices with specially designed radial type aonla cutter. Cut slices were separated with a sharp stainless steel knife and held in water until the entire batch was prepared to prevent enzymatic browning. Slices were then removed from the water and gently blotted with tissue paper prior to osmotic drying and determination of moisture content. Moisture content of the fresh as well as osmotically dehydrated aonla slices were determined by vacuum oven method. A pre weighed 3-5 g sample of aonla slices was kept in pre-dried and weighed petri-dishes. The petri-dishes with samples were placed in vacuum oven at 70oC maintaining vacuum between 85 to 100 mm of Hg till it attained constant weight. Petri-dishes were then cooled in desiccators for one hour and weighed. Average moisture content of three replicated samples was recorded (Ranganna [15]).
2.1 Preparation of sugar syrup as osmotic agent
Sugar syrups of three concentrations (50, 60 and 70oB) were prepared by dissolving known quantity of sugar in distilled water using glass rod as stirrer. Concentration of sugar syrup was checked by using hand refractometer (Erma, Japan make) of appropriate range (0-32, 28-62 and 58-92oB). Sugar was procured from local market and used as osmotic agent as it prevents food discolouration to a large extent and also imparts good taste to the final product.
2.2 Experimental procedure
2.3 Osmotic dehydration parameters
Water loss and solute gain were calculated using the equations given by Pokharkar and Prasad [14] :
x100 W X W X W WL i θ θ i i −
= … (1)
x100 W ) X (1 W ) X (1 W SG i i i θ
θ − − −
= ... (2)
where,
WL = Water loss (% or g per 100 g mass of sample) SG = Solute gain (% or g per 100 g mass of sample). Wθ = Mass of slices after time θ, g
Wi = Initial mass of slices, g
Xθ = Water content as a fraction of mass of slices at time θ.
Xi = Water content as a fraction of initial mass of slices, fraction.
2.4 Modelling of mass transfer kinetics
Azuara et al. [2] developed a two- parameter model for water loss and solute gain, which was able to estimate the equilibrium point using data, obtained during a relatively short period of osmosis and was successfully used to predict the entire osmotic dehydration process up to the equilibrium point. Further, the model could characterize osmotic dehydration of different types of foodstuffs without restrictions of geometric considerations. Therefore, it was decided to develop the mathematical model for osmotic dehydration of aonla slices in the form of equation proposed by Azuara et al. [2] based on experimental mean data of three replications for water loss and solute gain.
2.4.1 Water Loss
A two-parameter equation developed by Azuara et al. [2] for water loss could be written as,
t k 1 ) t(WL kt 1 ) kt(WL WLt + = +
= ∞ ∞ … (3)
where,
WLt = The fraction of water lost by sample at any time t (%)
k = The constant related to the rate of water diffusion out from the product t = Time (min)
WL∞ = The fraction of water lost by sample at equilibrium
During the osmotic dehydration of aonla slices, the constants k and water loss at equilibrium (WL∞) could be determined by linear regression, using experimental data. The linear form is
∞ ∞ + = WL t k WL 1 WL t t … (4)
2.4.2 Sugar gain
A two-parameter equation developed by Azuara et al. [2] for solute gain can be written as,
t k 1 ) t(SG kt 1 ) kt(SG SGt + = +
= ∞ ∞ … (5)
∞ ∞ + = SG t SG k 1 SG t t
(linear form) … (6)
where,
SGt = Solute gain fraction at any time (%)
k = The constant related to the rate of solute diffusion in the product t = Time (min)
SG∞ Fraction of solute gain by the sample at equilibrium
Furthermore, as the time (t) becomes much greater than the values of 1/k (i.e. t = ∞), the
water loss or the solute gain (WLt or SGt) approaches equilibrium value WL∞or SG∞ asymptotically.
Thus, if the experimental plot of t/WLt andt/SGt respectively against t shows linearity, then the
parameter values could be determined from the intercept and the slope. The model (Eq. 4 and 6) were used to predict the mass transfer kinetics.
1.5Verification of model for osmotic mass transfer kinetics
Model was validated by fitting the experimental water loss ratio (WLt /WL∞) expt. at different
immersion times to the water loss ratio (WLt /WL∞)pred. predicted by the proposed model. Model was
assessed for goodness of fit on the basis of highest coefficient of determination (R2), highest adjusted coefficient of determination (Adj. R2), lowest chi-square statistic (χ2), root mean square error (RMSE), mean bias error (MBE) and per cent error modulus. According to Deng and Zhao [5] a model with per cent error modulus less than 10 % is considered acceptable. Similar procedure was adopted in validating the solute gain ratio.
III. RESULTS AND DISCUSSION
3.1 Effect of osmotic dehydration process parameters on water loss
Average initial moisture content of fresh aonla fruits of variety Chakaiya was found 86.587 (% w. b.). Water loss and solute gain both were found in the range of 15.65 to 62.28 and 3.69 to 18.14 %, respectively during 4 h osmosis.
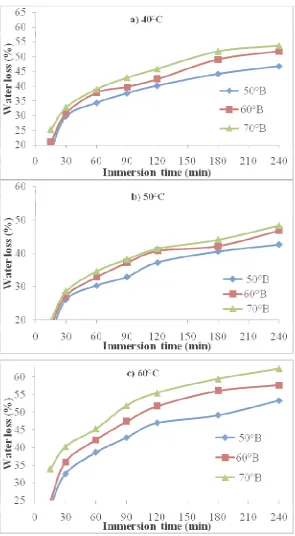
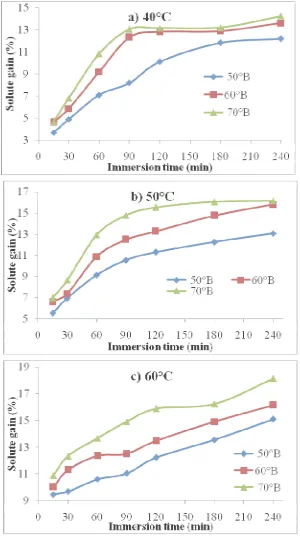
Data of water loss and solute gain as influenced by various sugar syrup concentrations, sugar syrup temperatures (40, 50 and 60oC) and immersion time (15, 30, 60, 90, 120, 180 and 240 min) during osmotic dehydration of aonla slices is plotted in Fig. 1 and 2. Water loss and solute gain increased non-linearly with immersion time at all concentrations (50, 60 and 70oB). Similar trends were also observed for other temperatures (40, 50 and 60oC). Water loss and solute gain were very fast at the beginning of the process and rate was gradually decreased with the increase of immersion time for all the treatment combinations. It can be further seen that as the immersion time increased, the water loss was increased; however, the equilibrium point could not be reached after short duration (4 h) of the osmotic dehydration process. This result is in confirmation with Lenart and Flink [12]; Jain et al. [10] and Alam and Singh [1].
This may be due to rapid water loss or solute uptake uptake near the surface in the beginning might have resulted in structural changes leading to compaction of these surface layers and increased mass transfer resistance for sugar uptake (Lenart and Flink [12]). Similar trends have been reported for other fruits and vegetables during osmosis by Sutar and Gupta [17] and Ertekin and Cakaloz [6].
3.2 Modelling of mass transfer on the basis of time
complicates any effort to study and understand the mass transport mechanisms of several interacting counter flows (water, osmotic solutes, soluble product solids). Further several factors like solution concentration, temperature, immersion time, sample size and shape, solution to sample ratio and applied pre-treatments affect the kinetics of mass transport.
Figure 2 Effect of immersion time and sugar concentration on solute gain (%) at 6:1 STFR during osmotic dehydration of aonla slices at a) 40; b) 50 and c) 60°C
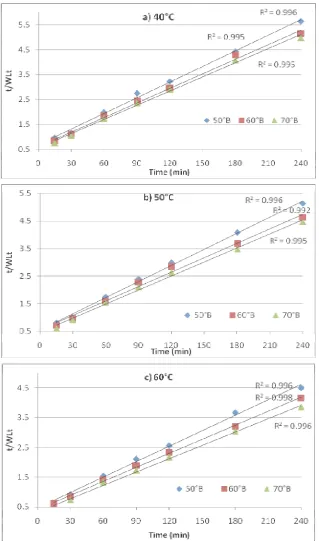
A two parameter equation based on mass balance developed by Azura et al. [2] was used to predict the dehydration kinetics during osmosis process and to determine final equilibrium point. This empirical equation have been used to model the water loss and solute gain obtained experimentally at temperatures (40, 50 and 60oC), concentrations (50, 60 and 70oB ) and immersion time (15, 30, 60, 90, 120, 180 and 240 min) at STFR 6:1 (v/w) during osmotic dehydration. Mean data of the three replications was fitted by regression analysis to this equation using statistical package SAS 9.3. The representative experimental graphs of t/WLt and t/SGt as calculated from the
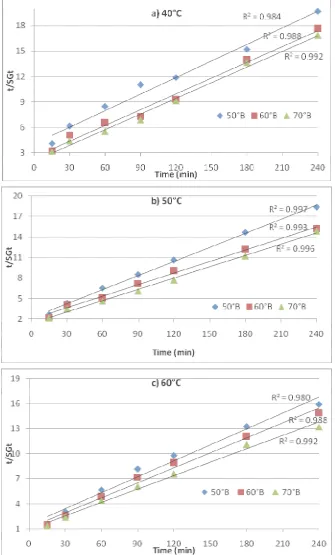
plotted against immersion time as shown in Fig. 3 and 4 respectively. A linear trend was observed in all the cases. Therefore, linear regression fitted the straight line, the parameter values were determined from the intercept and the slope. Parameter values of k and WL∞for water loss kinetics
and k and for solute gain kinetics were estimated from intercept and slope of the respective plots and presented in Table 1 and 2 including regression diagnostic criteria.
Figure 4 Linear plots of Azura et al. model for determination of SG∞ and k at different sugar syrup concentrations at 6:1 STFR during osmotic dehydration of aonla slices at a) 40; b) 50 and c) 60°C
3.3 Predictions by proposed model
The proposed model was able to predict mass transfer kinetics up to the equilibrium point using data for relatively short period of osmosis. Model was validated by fitting the experimental water loss ratio (WLt/WL∞)exp at different immersion time to the water loss ratio(WLt/WL∞)pred by
3.4 Evaluation and validation of model for water loss
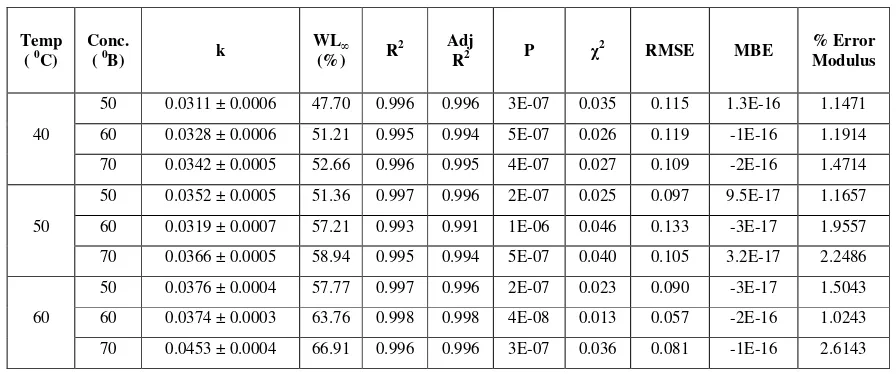
Model parameters k and WL∞and criteria for goodness of fit are presented in Table 1. The
value of constant k is function of immersion time and rate of water loss. Value of k was increased with increase in concentration at constant temperature except for few treatments hence did not show any specific trend w.r.t. temperature and concentration. Equilibrium water loss (WL∞) was increased
with increase in temperature at constant concentration and also with increase in concentration at constant temperature. Estimated equilibrium water loss variedfrom 47.70 to 66.91% for different temperature-concentration combinations. Further, high R2 (0.993 to 0.998), high adjusted R2 (0.991 to 0.998), lowest probability (4x10⁻⁸ to 1x10⁻⁶), lowest χ2 (0.013 to 0.046), lowest RMSE (0.0566 to 0.0), MBE (3.2 x10⁻¹⁷ to 2.2 x10⁻¹⁶ ) and per cent error modulus (1.0243 to 2.2486) between experimental and predicted values were found suggesting Azura et al. [2] model fulfilled regression diagnostics criteria for all the treatment combinations. Per cent error modulus between experimental and predicted value is less than 10 per cent also revealed the model could be used successfully to predict the entire osmotic dehydration process up to the equilibrium point for water loss.
Table 1 Azura et al. model parameters and goodness of fit for water loss
Temp
( 0C)
Conc.
( 0B) k
WL∞
(%) R
2 Adj
R2 P χ
2 RMSE MBE % Error
Modulus
40
50 0.0311 ± 0.0006 47.70 0.996 0.996 3E-07 0.035 0.115 1.3E-16 1.1471
60 0.0328 ± 0.0006 51.21 0.995 0.994 5E-07 0.026 0.119 -1E-16 1.1914
70 0.0342 ± 0.0005 52.66 0.996 0.995 4E-07 0.027 0.109 -2E-16 1.4714
50
50 0.0352 ± 0.0005 51.36 0.997 0.996 2E-07 0.025 0.097 9.5E-17 1.1657
60 0.0319 ± 0.0007 57.21 0.993 0.991 1E-06 0.046 0.133 -3E-17 1.9557
70 0.0366 ± 0.0005 58.94 0.995 0.994 5E-07 0.040 0.105 3.2E-17 2.2486
60
50 0.0376 ± 0.0004 57.77 0.997 0.996 2E-07 0.023 0.090 -3E-17 1.5043
60 0.0374 ± 0.0003 63.76 0.998 0.998 4E-08 0.013 0.057 -2E-16 1.0243
70 0.0453 ± 0.0004 66.91 0.996 0.996 3E-07 0.036 0.081 -1E-16 2.6143
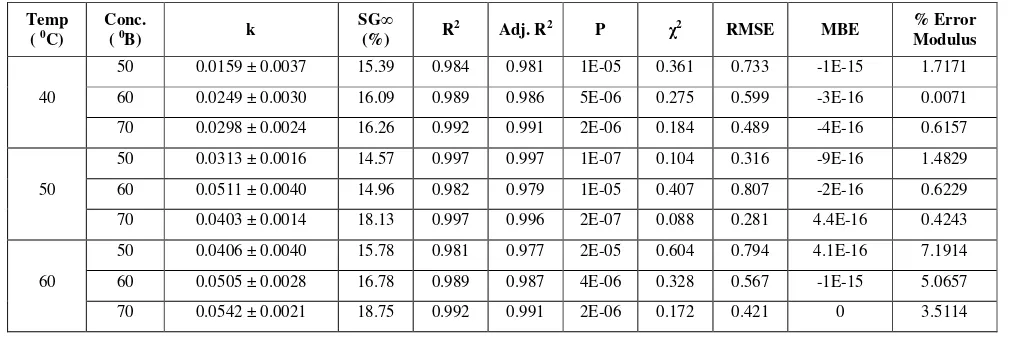
3.5 Evaluation and validation of model for solute gain
Equation parameters k and and regression diagnostic criteria for goodness of fit are presented in Table 2. The value of constant k is function of immersion time and rate of solid gain. Value of k was increased with increase in concentration at constant temperature for all the treatments except for treatment (50⁰C -70⁰B). Equilibrium solid gain (SG∞) was increased with increase in
Table 2 Azura et al. model parameters and goodness of fit for solute gain
Temp
( 0C)
Conc.
( 0B) k
SG∞
(%) R
2 Adj. R2 P
χ2 RMSE MBE % Error
Modulus
40
50 0.0159 ± 0.0037 15.39 0.984 0.981 1E-05 0.361 0.733 -1E-15 1.7171
60 0.0249 ± 0.0030 16.09 0.989 0.986 5E-06 0.275 0.599 -3E-16 0.0071
70 0.0298 ± 0.0024 16.26 0.992 0.991 2E-06 0.184 0.489 -4E-16 0.6157
50
50 0.0313 ± 0.0016 14.57 0.997 0.997 1E-07 0.104 0.316 -9E-16 1.4829
60 0.0511 ± 0.0040 14.96 0.982 0.979 1E-05 0.407 0.807 -2E-16 0.6229
70 0.0403 ± 0.0014 18.13 0.997 0.996 2E-07 0.088 0.281 4.4E-16 0.4243
60
50 0.0406 ± 0.0040 15.78 0.981 0.977 2E-05 0.604 0.794 4.1E-16 7.1914
60 0.0505 ± 0.0028 16.78 0.989 0.987 4E-06 0.328 0.567 -1E-15 5.0657
70 0.0542 ± 0.0021 18.75 0.992 0.991 2E-06 0.172 0.421 0 3.5114
IV. CONCLUSION
Water loss from and solute gain by aonla slices increased non-linearly with duration of osmosis at all concentrations and both increased at faster rate in the initial period of osmosis than laterlater stage.Water loss and solute gain both increased with increasing sugar concentration and temperature. They can lose 15.65 to 62.28 % water and gain 3.69 to 18.14 % sugar depending upon the sugar syrup concentration (50-70oBrix) and temperature (40-60oC) in 4 h duration of osmosis. The two parameter model developed by Azura et al. can describe the mass transfer kinetics in the osmotic dehydration process of aonla slices at any time satisfactorily when other conditions of osmosis are kept constant. Model can predict the equilibrium points on the basis of short duration of osmosis without conduction of experiments for several hours.
BIBLIOGRAPHY
[1] Alam, M.S. and Singh, A. 2008. Modelling of mass transfer in osmotic dehydration of aonla slices. Journal of Agricultural Engineering, 45: 38-44.
[2] Azuara, E.; Cortes, R.; Garcia, H.S. and Bersian, C.I. 1992. Kinetic model for osmotic dehydration and its relationship with Fick’s second law. International Journal of Food Science and Technology, 27: 239-242.
[3] Beristain C.I.; Azuara, E.; Cortes R. and Garcia, H.S. 1990. Mass transfer during osmotic osmotic dehydration of pineapple rings. . International Journal of Food Science and Technology, 25, 63-66.
[4] Chenlo, F.; Moreira, R.; Fernandez, H.C. and Vazques, G. 2006. Experimental results and modelling of the osmotic dehydration of chestnut with glucose solutions. Journal of Food Engineering, 74: 324-334.
[5] Deng, Y. and Zhao, Y. 2008. Effects of pulsed-vacuum and ultrasound on the osmodehydration kinetics and microstructure of apples (Fuji). Journal of Food Engineering, 85: 84-93.
[6] Ertekin, F.K. and Cakoloz, T. 1996. Osmotic dehydration of peas: I. Influence of process variables on mass transfer. Journal of Food processing and Preservation, 20: 87-95.
[7] Ganjloo, A.; Rahman, R.A.; Bakar, J.; Osman, A. and Bimakar, M. 2011. Mathematical modelling of mass transfer during osmotic dehydration of seedless guava (Pisidium guajava L.). International Food Research Journal, 18(3), 1105-1110.
[8] Giangiacomo, R.; Torreggiani, D. and Abbo, E. 1987. Osmotic dehydration of fruit. Part I :Sugar exchange between fruit and extracting syrup. Journal of Food processing and Preservation, 11: 183-195.
[9] Herman-Lara, E.; Martinez-Sanchez, C.E.; Pancheco-Angulo, H.; Carmona-Garcia, R.; Espinosa, H. and Ruiz-Lopez, I.I. 2012. Mass transfer modelling of equilibrium and dynamic periods during osmotic dehydration of radish in NaCl solutions. Food and Bioproducts Processing, http://dx.doi.org /10.1016/jbp.2012.10.001
[10] Jain, S.K.; Verma, R.C.; Murdia, L.K. and Dashora, H.K. 2011. Optimisation of process parameters for osmotic dehydration of papaya cubes. Journal of Food Science and Technology, 48: 211-217.
[11] Kaur, K. and Singh, A.K. 2013. Mass transfer kinetics and optimization during osmotic dehydration of beetroot (Beta vulgaris L.). International Journal of Scientific and Research Publications, 3: 1-7. www.ijsrp.org.
[13] Mercali, G.D.; Marczak, L.D.F.; Tessaro, I.C. and Norena, C.P.Z. 2010. Evaluation of water sucrose and NaCl diffusivities during osmotic dehydration of banana (Musa sapientun, shum ). LWT- Food Science and Technology, 2:123-128.
[14] Pokharkar, S.M. and Prasad, S. 1998. Mass transfer during osmotic dehydration of banana slices. Journal of Food Science and Technology, 30: 336-338.
[15] Ranganna, S. 2005. Handbook of Analysis and Quality Control for Fruits and Vegetable Products. Tata McGraw Hill Publishing Co. Ltd., New Delhi.
[16] Schmidt, F.C.; Carciofi, B.A.M. and Laurindo, J.B. 2009. Application of diffusive models to hydration, dehydration and salt gain during osmotic treatment of chicken breast cuts. Journal of Food Engineering, 91: 553-559.
[17] Sutar, P.P. and Gupta, D.K. 2007. Mathematical modelling of mass transfer in osmotic dehydration of onion slices. Journal of Food Engineering, 78: 90-97.
[18] Tortoe, C.; Orchard, J. and Beezer, A. 2007. Comparative behaviour of cellulosic and starchy plant materials during osmotic dehydration. Journal of Science, Food and Agriculture, 87: 1284-1291.