Osman et al. World Journal of Pharmaceutical and Life Sciences
VALIDATION OF A FORCED DEGRADATION UPLC METHOD FOR ESTIMATION OF
GLIBENCLAMIDE
IN ORAL DOSAGE FORM
Dr. Osman Ahmed*1, Mohd. Kareem Ahmed1 and Dr. Anas Rasheed2
1Department of Pharmaceutical Analysis, Deccan School of Pharmacy, Hyderabad. 2CSO, Gaelib Medications Private Limited, Hyderabad.
Article Received on 20/08/2019 Article Revised on 10/09/2019 Article Accepted on 30/09/2019
INTRODUCTION
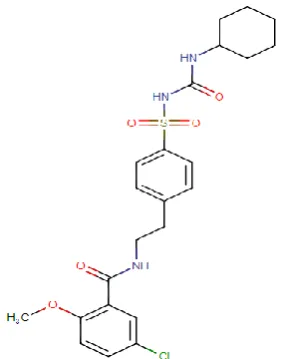
Glibenclamide compound belongs to the class of organic compounds known as benzenesulfonamides. These are organic compounds containing a sulfonamide group that is S-linked to a benzene ring.
Category: Sulfonylurea Compounds.
Glibenclamide
Fig. 1: Structure of Glibenclamide.
Nomenclature: 5-chloro-N-[2-(4 {[(cyclohexylcarbamoyl) amino] sulfonyl} phenyl) ethyl]-2-methoxybenzamide
Molecular formula: C23H28ClN3O5S
Molecular weight: 494.004
Solubility: Water solubility: 4 mg/L (at 25 °C), pKa (Strongest Acidic) 4.32, pKa (Strongest Basic) - 1.2
Mechanism of action
Sulfonylureas such as Glibenclamide bind to ATP-sensitive potassium channels on the pancreatic cell surface, reducing potassium conductance and causing depolarization of the membrane. Depolarization stimulates calcium ion influx through voltage-sensitive calcium channels, raising intracellular concentrations of calcium ions, which induces the secretion, or exocytosis, of insulin.
Half life: 1.4-1.8 hours. Generic Name: Glibenclamide Brand Names: Daonil
Validation of Analytical Methods (USP/ICH)
Method validation, according to the United States Pharmacopeia (USP), is performed to ensure that an analytical methodology is accurate, specific,
World Journal of Pharmaceutical and Life Sciences
WJPLS
www.wjpls.org
SJIF Impact Factor: 6.129*Corresponding Author: Dr. Osman Ahmed
Department of Pharmaceutical Analysis, Deccan School of Pharmacy, Hyderabad.
ABSTRACT
A selective, precise, accurate and stability indicating UPLC method is validated for estimation of Glibenclamide in oral dosage form. The method employed, with Hypersil C18 (100 mm x 2.1 mm, 1.7 μm) column in gradient mode, with mobile phase of Methanol and Acetonitrile in the ratio of 80:20 %v/v. The flow rate was 1.2 ml/min and effluent was monitored at 272nm. Retention time was found to be 8.623±0.11 min. The method was validated in terms of linearity, accuracy, precision, limit of detection (LOD), limit of quantification (LOQ) etc. in accordance with ICH guidelines. Linear regression analysis data for the calibration plot showed that there was good linear relationship between response and concentration in the range of 2- 10μg/ml respectively. The LOD and LOQ values for were found to be 0.19543(μg/ml) and 0.59223 (μg/ml) respectively. No chromatographic interference from excipients and degradants were found. The proposed method was successfully used for estimation of Glibenclamide in oral dosage form.
reproducible, and rugged over the specified range that an analyte will be analyzed. Regulated laboratories must perform method validation in order to be in compliance with FDA regulations. In a 1987 guideline (Guideline for Submitting Samples and Analytical Data for Methods
Validation), the FDA designated the specifications in the current edition of the USP as those legally recognized when determining compliance with the Federal Food, Drug and Cosmetic Act can be referred to as the ―eight steps of method validation‖
Experimental Materials
Equipments Source
Ultra Pressure Liquid Chromatography (UPLC) Acquity UPLC Systems, Waters Laboratories Electrospray ionization and MS-MS Mass Spectrometer PE Sciex Model: API 3000
Chromatographic data software Empower
Column C18 column (250 ×4.6 mm id)—ACE Generix
Detector PDA
Injector Automated
Electronic Balance Eagle
Sonicator Band Line Sonerex
pH Meter Lab India pH meter
METHODOLOGY Method Validation
The analytical procedure refers to the way of performing the analysis. It should describe in detail the steps necessary to perform each analytical test. This may include but is not limited to: the sample, the reference standard and the reagents preparations, use of the apparatus, generation of the calibration curve, use of the formulae for the calculation, etc. The described method extensively validated in terms of specificity, system suitability, linearity, accuracy, precision, limit of detection, limit of quantification and robustness.
Forced degradation studies of our selected pharmaceutical drugs.
In order to establish the analytical method for a stability indicating method, the drugs are subjected to various stress conditions to conduct forced degradation studies. Stress studies were carried out under the conditions of acid/base hydrolysis, oxidation, reduction, in accordance with ICH Q1A (R2). Several trials with different severity of each stressed condition are to be conducted, so that upto 10-30% degradation is to be achieved.
RESULTS Glibenclamide
Preparation of Standard Stock Solution Preparation of Diluent
In order to achieve the separation under the optimized conditions after experimental trials that can be summarized. Stationary phase like Hypersil BDS C18 (100 mm x 2.1 mm, 1.7 μm) column was most suitable one, since it produced symmetrical peaks with high resolution and a very good sensitivity and with good resolution. The flow rate was maintained 1 mL min-1 shows good resolution. The PDA detector response of
The mixture of two solutions Chloroform and Acetonitrile in the ratio of 60:40 %v/v‖ with gradient programming was used as mobile phase at 1 mL/min was found to be an appropriate mobile phase for separation of Glibenclamide. The column was maintained at ambient temperature.
Preparation of internal standard solution
Weighed accurately about 10 mg of D-Phenylalanine working standard and transfer to 100 ml volumetric flask, add 50 ml of mobile phase and sonicate to dissolve it completely and then volume was made up to the mark with mobile phase to get 100 µg/ml of standard stock solution of working standard. Then it was ultrasonicated for 10 minutes and filtered through 0.20 μ membrane filter.
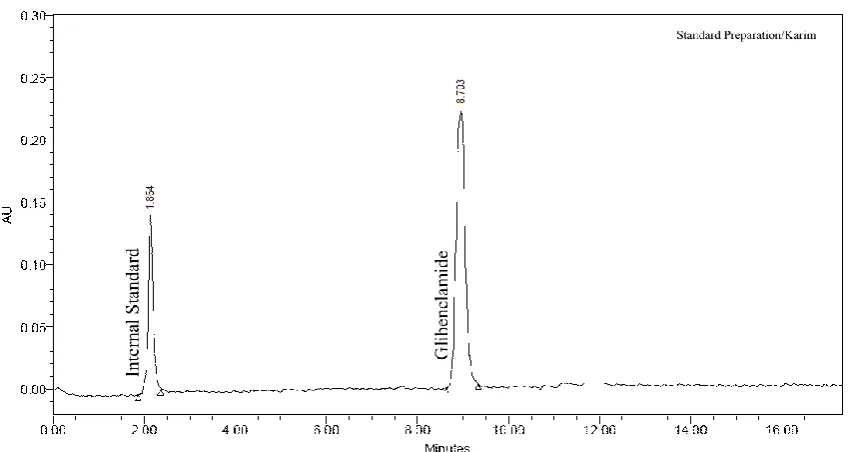
Chromatogram of standard preparation of Glibenclamide.
Accuracy
Table 1: Results of Accuracy Study (Glibenclamide).
Glibenclamide Level % Amount added
(μg/ml)
Amount found (μg/ml)
%
Recovery Mean Recovery (%) Std.Dev % RSD
50 02.06 02.05 99.51
99.28 0.3897 0.39%
100 04.12 04.10 99.50
150 06.18 06.17 98.83
System Precision Procedure
The parameters, retention time (RT), theoretical plates (N), tailing factor (T), peak asymmetry (As) and repeatability were evaluated at a concentration of 4μg/mL (Glibenclamide).
Table 2: Results of System Precision (Glibenclamide).
Parameters Glibenclamide
Retention time (min) ± % RSD 8.775 ± 0.04 Theoretical plates ± % RSD 2377.56 ± 0.50
Asymmetry ± % RSD 1.08 ± 0.05
Repeatability (% RSD) 0.11
Table 3 Results of Method Precision (Glibenclamide)
Replicate Glibenclamide
S.No. Concentration Taken (μg/ml) Area %LC
1
04.00
26138 99.99%
2 26141 99.98%
3 26139 99.98%
4 26134 99.99%
5 26140 99.98%
6 26142 99.97%
Average 99.98%
Std.Dev 0.00752
% RSD 0.01%
Standard weight 4mcg
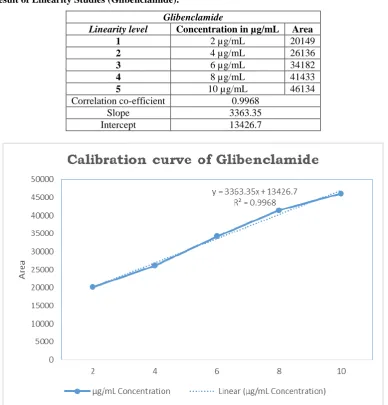
Linearity
Procedure: The linearity of the method was determined at five concentration levels ranging from 2-10 μg/mL for Glibenclamide.‖
Table 4: Result of Linearity Studies (Glibenclamide).
Glibenclamide
Linearity level Concentration in µg/mL Area
1 2 µg/mL 20149
2 4 µg/mL 26136
3 6 µg/mL 34182
4 8 µg/mL 41433
5 10 µg/mL 46134
Correlation co-efficient 0.9968
Slope 3363.35
Intercept 13426.7
Fig. 1: Calibration curve of Glibenclamide.
Robustness
Table 5: Result of Robustness Studies (Glibenclamide). Robustness Studies
Parameter Value Peak Area % RSD
Flow Rate Low 27548 0.13%
Actual 27592
Plus 27619
Temperature Low 27563 0.16%
Actual 27646
Plus 27629
Ruggedness
Table 6: Result of Ruggedness Studies (Glibenclamide.
Glibenclamide Ruggedness
Parameter Peak Area % RSD %LC
Intraday precision
27158
0.11%
99.77%
27212 99.97%
27164 99.79%
Inter day precision
27145
0.15%
98.72%
27229 99.96%
27182 99.86%
Instrument:1
Acquity UPLC Waters,2695H
27118
0.04%
99.62%
27139 99.70%
27121 99.63%
Instrument:2
Agilent Technologies,1290
27117
0.04%
99.62%
27134 9 9 . 6 8 %
27117 9 9 . 6 2 %
Average 9 9 . 6 6
Std. Dev 0 . 3 2 2
% R S D 0 . 3 2 %
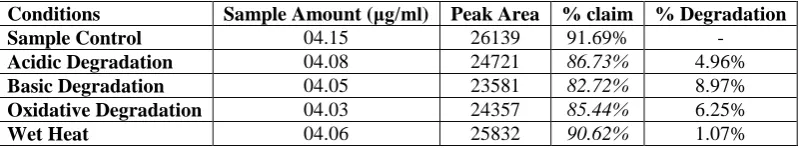
Forced Degradation Studies
Sample Control: An accurate 10 ml of the prepared pure drug stock solution of working standard was transferred to a clean and dry RBF. The volume of the sample was
100µg/ml. It was injected into the UPLC system against a blank of Methanol and Acetonitrile in the ratio of 80:20 %v/v after optimizing the mobile phase composition, chromatogram was recorded.
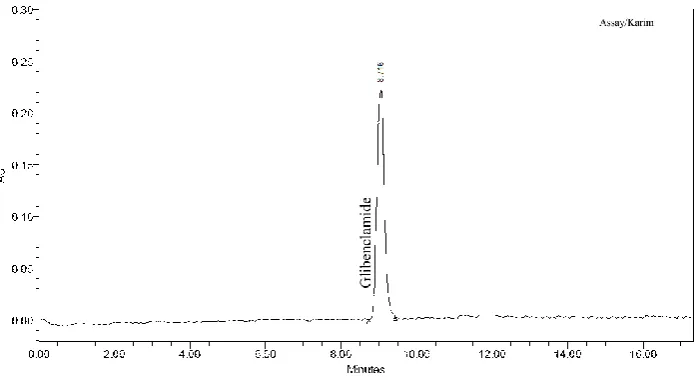
Assay of Glibenclamide (Sample Control)
a. Acidic Degradation
An accurate 10 ml of pure drug sample solution was transferred to a clean and dry round bottom flask (RBF). 30 ml of 0.1 N HCl was added to it. It was refluxed in a water bath at 60°C for 4 hours. Drug became soluble after reflux which was insoluble initially. Allowed to cool at room temperature. The sample was then neutralized using 2N NaOH solution and final volume of the sample was made up to 100ml with water to prepare 100ppm solution. It was injected into the UPLC system against a blank of Methanol and Acetonitrile in the ratio of 80:20 %v/v after optimizing the mobile phase
Chromatogram showing the degraded products in Acidic degradation
b. Basic Degradation
An accurate 10 ml of pure drug sample solution was transferred to a clean and dry RBF. 30 ml of 0.1N NaOH was added to it. It was refluxed in a water bath at 60°C for 4 hours. Drug became soluble after reflux which was insoluble initially. It was allowed to cool at room temperature. The sample was then neutralized using 2N
HCl solution and final volume of the sample was made up to 100ml with water to prepare 100ppm solution. It was injected into the UPLC system against a blank of Methanol and Acetonitrile in the ratio of 80:20 %v/v after optimizing the mobile phase composition, chromatogram was recorded and shown in Chromatogram.‖
Chromatogram showing the degraded products in Basic degradation
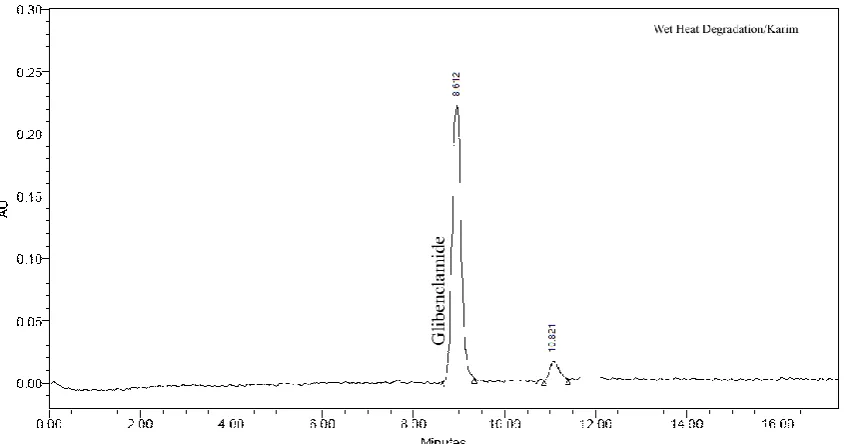
c. Wet heat degradation
Accurate 10 ml of pure drug sample was transferred to a clean and dry RBF. 30 ml of HPLC grade water was added to it. Then, it was refluxed in a water bath at 60°C for 6 hours uninterruptedly. After the completion of reflux, the drug became soluble and the mixture of drug and water was allowed to cool at room temperature.
Chromatogram showing the degraded products in Wet heat degradation
d. Oxidation with (3%) H2O2
Approximately 10 ml of pure drug sample was transferred in a clean and dry 100 ml volumetric flask. 30 ml of 3% H2O2 and a little methanol was added to it to
make it soluble and then kept as such in dark for 24
hours. Final volume was made up to 100 ml using water to prepare 100 ppm solution. The above sample was injected into the UPLC system. The chromatogram was recorded and shown in Chromatogram.
Chromatogram showing the degraded products in Oxidative degradation
Table 7: Summary of Forced Degradation Studies (Glibenclamide).
Nature of Stress Degradation condition Time(h) Number of degradation products (Rt)
Acidic 60°C 3 1 (0.728)
Basic 60°C 9 2 (12.731, 13.211)
Oxidative RT 48 1 (5.724)
EVALUATION OF METHODS Forced Degradation Studies Analysis of Glibenclamide
Table 8: Results of Forced Degradation Assays (Glibenclamide).
Conditions Sample Amount (μg/ml) Peak Area % claim % Degradation
Sample Control 04.15 26139 91.69% -
Acidic Degradation 04.08 24721 86.73% 4.96%
Basic Degradation 04.05 23581 82.72% 8.97%
Oxidative Degradation 04.03 24357 85.44% 6.25%
Wet Heat 04.06 25832 90.62% 1.07%
Calculation formula for Glibenclamide
Whereas,‖
AT = Average area of test preparation, 26139‖ AS = Average area of standard preparation, 28358‖ W1 = Weight taken of reference standard (μg), 04.15‖ W2 = Weight taken of test sample (μg), 04.25‖ AW = Average weight of sample (μg), 3057‖ LC = Label claim (μg), 3000‖
P = Potency of reference standard (%), 99.98%‖
Sample Control (Glibenclamide)
% Assay = 26139
28358 × 04.15
100 × 1 25 ×
100 04.25 ×
25
1 ×
Error!
×99.98 = 91.69%
Acidic Degradation (Glibenclamide)
% Assay = 24721
28358 ×
04.15
100 ×
1
25 ×
100
04.25 ×
25
1 ×
Error!
×99.98 = 86.73%
Basic Degradation (Glibenclamide)
% Assay = 23581
28358 ×
04.15
100 ×
1
25 ×
100
04.25 ×
25
1 ×
Error!
×99.98 = 82.72%
Oxidative Degradation (Glibenclamide)
% Assay = 24357
28358 ×
04.15
100 ×
1
25 ×
100
04.25 ×
25
1 ×
Error!
×99.98 = 85.44%
Wet Heat (Glibenclamide)
% Assay = 25832 ×04.15 × 1 × 100 ×25 ×
Error!
×CONCLUSION
A selective, precise, accurate and stability indicating UPLC method is validated for estimation of Glibenclamide in oral dosage form. The method employed, with Hypersil C18 (100 mm x 2.1 mm, 1.7 μm) column in gradient mode, with mobile phase of Methanol and Acetonitrile in the ratio of 80:20 %v/v. The flow rate was 1.2 ml/min and effluent was monitored at 272nm. Retention time was found to be 8.623±0.11 min. The method was validated in terms of linearity, accuracy, precision, limit of detection (LOD), limit of quantification (LOQ) etc. in accordance with ICH guidelines. Linear regression analysis data for the calibration plot showed that there was good linear relationship between response and concentration in the range of 2- 10μg/ml respectively. The LOD and LOQ values for were found to be 0.19543(μg/ml) and 0.59223 (μg/ml) respectively. No chromatographic interference from excipients and degradants were found. The proposed method was successfully used for estimation of Glibenclamide in oral dosage form.
BIBLIOGRAPHY
1. Burrows GW, Evertts VL. High performance liquid chromatographic determination of chlophedianol hydrochloride in ―jung fei‖, a complex tablet formulation. Journal of Chromatographic Science, 1985; 37-8.
2. C.F. Poole, S.K. Poole. Chromatography Today.
ELSEVIER, 1991.
3. Glenn A Jacobson and Gregory M Peterson. High-performance liquid chromatographic assay for the simultaneous determination of ipratropium bromide, fenoterol, salbutamol and terbutaline in nebulizer solution. Journal of Pharmaceutical and Biomedical
Analysis, 1994; 825-32.
4. Nuran Ercal, Serdar Oztezcan, Terese C. Hammond, Richard H. Matthews, Douglas R. Spitz. High-performance liquid chromatography assay for N-acetylcysteine in biological samples following derivatization with N-(1-pyrenyl)maleimide. Journal
Of Chromatography B: Biomedical Applications,
1996; 329-334.
6. Shuguang Hou, Michael Hindle, Peter R. Byron. A stability-indicating HPLC assay method for budesonide. Journal of Pharmaceutical and
Biomedical Analysis, 2001; 371–380.
7. Singh SS, Bakshi M. Development of Validated Stability Indicating Assay. J Pharm Biom Anal, 2002; 1011 – 40.
8. Bertil Andersson, T.-B. C. United States Patent No.
US6598603 B1, 2003.
9. Chunhua Yin, Cui Tang, Xiaoying Wu. HPLC determination of aminophylline, methoxyphenamine hydrochloride, noscapine and chlorphenamine maleate in compound dosage forms with an aqueous-organic mobile phase. Journal of
Pharmaceutical and Biomedical Analysis, 2003;
39-43.
10. Skoog DA, Holler FJ, Nieman TA. Fundamentals of
analytical chemistry (5th ed.). Thomson