The Randomized Causation Coefficient
David Lopez-Paz∗ [email protected]
Max-Planck-Institute for Intelligent Systems, Spemannstrasse 38, 72076 T¨ubingen, Germany
Krikamol Muandet [email protected]
Max-Planck-Institute for Intelligent Systems, Spemannstrasse 38, 72076 T¨ubingen, Germany
Benjamin Recht [email protected]
Department of EECS, University of California Berkeley, 387 Soda Hall, Berkeley, CA 94720
Editor:Isabelle Guyon and Alexander Statnikov
Abstract
We are interested in learning causal relationships between pairs of random variables, purely from observational data. To effectively address this task, the state-of-the-art relies on strong assumptions on the mechanisms mapping causes to effects, such as invertibility or the existence of additive noise, which only hold in limited situations. On the contrary, this short paper proposes to learn how to perform causal inference directly from data, without the need of feature engineering. In particular, we pose causality as a kernel mean embedding classification problem, where inputs are samples from arbitrary probability distributions on pairs of random variables, and labels are types of causal relationships. We validate the performance of our method on synthetic and real-world data against the state-of-the-art. Moreover, we submitted our algorithm to the ChaLearn’s “Fast Causation Coefficient Challenge” competition, with which we won the fastest code prize and ranked third in the overall leaderboard.
Keywords: causality, cause-effect inference, kernel mean embeddings, random features
1. Introduction
According to Reichenbach’s common cause principle (Reichenbach, 1956), the dependence between two random variablesXandY implies that eitherX causesY (denoted byX →Y), or that Y causes X (denoted by Y →X), or thatX andY have a common cause. In this note, we are interested in distinguishing between these three possibilities by using samples drawn from the joint probability distribution P on (X, Y).
Two of the most successful approaches to tackle this problem are the information geometric causal inference method (Daniusis et al., 2012; Janzing et al., 2014), and the additive noise model (Hoyer et al., 2009; Peters et al., 2014). First, the Information Geometric Causal Inference (IGCI) is designed to infer causal relationships between variables related by invertible, noiseless relationships. In particular, assume that there exists a pair of functions or mapping mechanisms f andg such that Y =f(X) andX =g(Y). The IGCI method
decides that X → Y if ρ(P(X),|log(f0(X))|) < ρ(P(Y),|log(g0(Y))|), where ρ denotes Pearson’s correlation coefficient. IGCI decidesY →X if the opposite inequality holds, and abstains otherwise. The assumption here is that the cause random variable is independently generated from the mapping mechanism; therefore it is unlikely to find correlations between the density of the former and the slope of the latter. Second, the additive noise model (ANM) assumes that the effect variable is equal to a nonlinear transformation of the cause variable plus some independent random noise, i.e.,Y =f(X) +NY. If X⊥⊥NY, then there
exists no model of the formX =g(Y) +NX for which Y ⊥⊥NX. As a result, one can find
the causal direction by performing independence test between the input variable and residual variable in both directions. Specifically, the algorithm will conclude thatX→Y if the pair of random variables (X, NY) are independent but the pair (Y, NX) is not. The algorithm
will concludeY →Xif the opposite claim is true, and abstain otherwise. The additive noise model has been extended to study post-nonlinear models of the formY =h(f(X) +NY),
where h a monotone function (Zhang and Hyv¨arinen, 2009). The consistency of causal inference under the additive noise model was established by Kpotufe et al. (2013) under some technical assumptions.
As it becomes apparent from the previous exposition, there is a lack of a general method to infer causality without assuming strong knowledge about the underlying causal mechanism. Moreover, it is desirable to readily extend inference to other new model hypotheses without incurring in the development of a new, specific algorithm. Motivated by this issue, we raise the question:
Is it possible to automatically learn patterns revealing causal relationships between random variables from large amounts of labeled data?
2. Learning to Learn Causal Inference
Unlike the methods described above, we propose adata-driven approach to build a flexible causal inference engine. To do so, we assume access to some set of pairs {(Si, li)}ni=1, where the sample Si = {(xij, yij)}nj=1i are drawn i.i.d. from the joint distribution Pi of
the two random variables Xi and Yi, which obey the causal relationship denoted by the
label li. To simplify exposition, the labelsli = 1 denotes X → Y andli =−1 stands for
Y →X. Using these data, we build a causal inference algorithm in two steps. First, an m-dimensional feature vector mi is extracted from each sampleSi, to meaningfully represent
the corresponding distribution Pi. Second, we use the set {(mi, li)}ni=1 to train a binary classifier, later used to predict the causal relationship between previously unseen pairs of random variables. This framework can be straightforwardly extended to also infer the “common cause” and “independence” cases, by introducing two extra labels.
Our setup is fundamentally different from the standard classification problem in the sense that the inputs to the learners are samples from probability distributions, rather than real-valued vectors of features (Muandet et al., 2012; Szab´o et al., 2014). In particular, we place two assumptions. First, the existence of aMother distribution M(P,{−1,+1}) from which all paired probability distributionsPi ∈ P on (Xi, Yi) and causal labels li ∈ {−1,+1}
the distributions Pi. While these assumptions may not hold in generality, our experimental
evidence suggests their wide applicability in real-world data.
The rest of this paper is organized as follows. Section 3 elaborates on how to extract the m−dimensional feature vectorsmi from each causal sample Si. Section 4 provides empirical
evidence to validate our methods. Section 5 closes the exposition by commenting on future research directions.
3. Featurizing Distributions with Kernel Mean Embeddings
Let P be the probability distribution of some random variableZ taking values inRd. Then,
thekernel mean embedding of P associated with the positive definite kernel functionk is
µk(P) :=
Z
Rd
k(z,·)dP(z)∈ Hk, (1)
whereHkis the reproducing kernel Hilbert space (RKHS) endowed with the kernelk(Berlinet and Thomas-Agnan, 2004; Smola et al., 2007). A sufficient condition which guarantees the existence ofµk is that the kernel k is bounded, i.e., supz∈Zk(z, z)<∞. One of the most attractive property of µk is that it uniquely determines each distribution P when k is a
characteristic kernel (Sriperumbudur et al., 2010). In another words,kµk(P)−µk(Q)kHk = 0 iff P =Q. Examples of characteristic kernels include the popular squared-exponential
k(z, z0) = exp −γkz−z0k22
, forγ >0, (2)
which will be used throughout this work.
However, in practice, we do not have access to the true distributionP, and consequently to the true embedding µk. Instead, we often have access to a sample S = {zi}ni=1 drawn i.i.d. fromP. Then, we can construct the empirical measure PS = n1
Pn
i=1δ(zi), where δ(z) is the Dirac mass atz, and estimate (1) by
µk(PS) :=
1 n
n
X
i=1
k(zi,·)∈ Hk. (3)
Though it can be improved (Muandet et al., 2014), the estimator (3) is the most common due to its ease of implementation. We can essentially view (1) and (3) as the feature representations of the distribution P and its sampleS, respectively.
For some kernels such as (2), the feature maps (1) and (3) do not have a closed form, or are infinite dimensional. This translates into the need of kernel matrices, which require at least O(n2) computation. In order to alleviate these burdens, we propose to compute a low-dimensional approximation of (3) using random Fourier features (Rahimi and Recht, 2007). In particular, if the kernel k is shift-invariant, we can exploit Bochner’s theorem (Rudin, 1962) to construct a randomized approximation of (3), with form
µk,m(PS) =
1 n
n
X
i=1
cos(w01zi+b1), . . . ,cos(w0mzi+bm)
0
∈Rm, (4)
can be approximated in this fashion when setting wi ∼ N(0,2γI). These features can be
computed in O(mn) time and stored inO(1) memory. Importantly, the low dimensional representationµk,mis amenable for the off-the-shelf use with any standard learning algorithm,
and not only kernel-based methods.
Using the assumptions introduced in Section 1, the data{(mi, li)}ni=1 :={(µk,m(PSi), li)}
n i=1 and a binary classifier, we can now pose causal inference as a supervised learning problem.
4. Numerical Simulations
We conduct an array of experiments to test the effectiveness of a simple implementation of the presented causal learning framework1. Given the use of random embeddings (4) in our classifier, we term our method theRandomized Causation Coefficient (RCC). Throughout our simulations, we featurize each sampleS ={(xi, yi)}ni=1 as
ν(S) = (µk,m(PSx), µk,m(PSy), µk,m(PS)), (5)
where the three elements forming (5) stand for the low-dimensional representations (4) of the empirical kernel mean embeddings of {xi}n
i=1, {yi}ni=1, and {(xi, yi)}ni=1, respectively. This representation is motivated by the typical conjecture in causal inference about the existence of asymmetries between the marginal and conditional distributions of causally-related pairs of random variables (Sch¨olkopf et al., 2012). Each of these three embeddings has random features sampled to approximate the sum of three Gaussian kernels (2) with hyper-parameters 0.1γ,γ, and 10γ, where γ is set using the median heuristic. In practice, we set m= 1000, and observe no significant improvements when using larger amounts of random features. To classify the embeddings (5) in each of the experiments, we use the random forest implementation from Python’s sklearn-0.16-git. The number of trees forming the forest is chosen from the set{100,250,500,1000,5000}, via cross-validation.
4.1 T¨ubingen Data
The T¨ubingen cause-effect pairs is a collection of heterogeneous, hand-collected, real-world cause-effect samples2. Given the small size of this data set, we resort to the synthesis of some Mother distribution to sample our training data from. To this end, assume that sampling a synthetic cause-effect sample ˆSi:={(ˆxij,yˆij)}nj=1 equals the following generative process:
1. Acausevector (ˆxij)nj=1is sampled from a mixture of Gaussians withccomponents. The mixture weights are sampled fromU(0,1), and normalized to sum to one. The mixture means and standard deviations are sampled fromN(0, σ1), and N(0, σ2), respectively, accepting only positive standard deviations. The cause vector is standardized.
2. A noise vector (ˆij)nj=1 is sampled from a centered Gaussian, with variance sampled from U(0, σ3).
1. The source code of our experiments is available at https://github.com/lopezpaz/causation_ learning_theory.
3. The mapping mechanism fˆi is a spline fitted using an uniform grid of df elements
from min((ˆxij)nj=1) to max((ˆxij)nj=1) as inputs, and df normally distributed outputs.
4. An effect vector is built as (ˆyij := ˆfi(ˆxij) + ˆij)nj=1, and standardized. 5. Return the cause-effect sample ˆSi :={(ˆxij,yˆij)}nj=1.
To choose a θ= (c, σ1, σ2, σ3, df) that best resembles the unlabeled test data, we minimize
the distance between the embeddings ofN synthetic pairs and the T¨ubingen samples
arg min
θ
X
i
min
1≤j≤Nkν(Si)−ν( ˆSj)k
2 2,
overc, df ∈ {1, . . . ,10}, andσ1, σ2, σ3 ∈ {0,0.5,1, . . . ,5}, where the ˆSj is sampled using the
generative process described above, the Si are the T¨ubingen cause-effect pairs, andν is as
in (5). This strategy can be thought of as transductive learning, since we have access to the test inputs (but not their underlying causal relation) at the training time.
We set n= 1000, and N = 10,000. Using the generative process described above, and the best found parameter vector θ= (3,2,2,2,5), we construct the synthetic training data
{{ν({(ˆxij,yˆij)}nj=1),+1)}Ni=1, {ν({(ˆyij,xˆij)}nj=1),−1)}Ni=1},
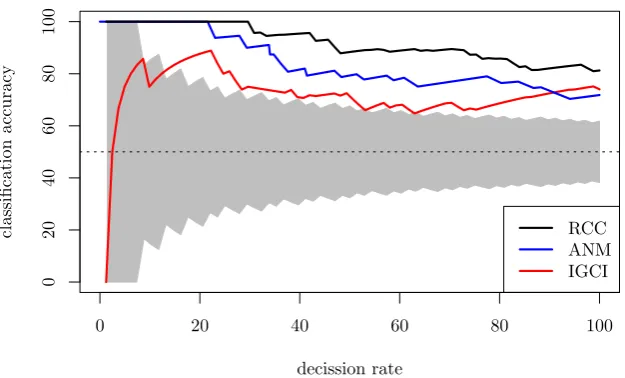
where {(ˆxij,yˆij)}nj=1 = ˆSi, and train our classifier on it. Figure 1 plots the classification
accuracy of RCC, IGCI (Daniusis et al., 2012), and ANM (Mooij et al., 2014) versus the fraction of decisions that the algorithms are forced to make out of the 82 scalar T¨uebingen cause-effect pairs. To compare these results to other lower-performing methods, refer to Janzing et al. (2012). Overall, RCC surpasses the state-of-the-art in these data, with a classification accuracy of 81.61% when inferring the causal directions on all pairs. The confidence of RCC is computed using the random forest’s output class probabilities.
4.2 ChaLearn’s “Fast Causation Coefficient” Challenge
We tested RCC at the ChaLearn’sFast Causation Coefficient challenge (Guyon, 2014). We trained a Gradient Boosting Classifier (GBC), with hyper-parameters chosen via a 4-fold cross validation, on the featurizations (5) of the training data. In particular, we built two separate classifiers: a first one to distinguish between causal and non-causal pairs (i.e.,X−Y vs {X → Y, X ← Y}), and a second one to distinguish between the two possible causal directions on the causal pairs (i.e., X→Y vsX←Y). The final causation coefficient for a given sampleSi was computed as
score(Si) =p1(Si)·(2·p2(Si)−1),
where p1(x) andp2(x) are the class probabilities output by the first and the second GBCs, respectively. We found it easier to distinguish between causal and non-causal pairs than to infer the correct direction on the causal pairs.
0 20 40 60 80 100
0
20
40
60
80
100
decission rate
classification
accuracy
RCC ANM IGCI
Figure 1: Accuracy of RCC, IGCI and ANM on the T¨ubingen cause-effect pairs, as a function of decision rate. The grey area depicts accuracies not statistically significant.
competition, we obtained a bidirectional AUC of 0.73 on the test pairs in two minutes of test-time (Guyon, 2014). On the other hand, the winning entry of the competition, which made use of hand-engineered features, took a test-time of 30 minutes, and achieved a bidirectional AUC of 0.82. Interestingly, the performance of IGCI on the 20,000 training pairs is barely better than random guessing. The computational complexity of the additive noise model (usually implemented as two Gaussian Process regressions followed by two kernel-based independence tests) made it unfeasible to compare it on this data set.
5. Conclusions and Future Research
To conclude, we proposed to learn how to perform causal inference between pairs of random variables from observational data, by posing the task as a supervised learning problem. In particular, we introduced an effective and efficient featurization of probability distributions, based on kernel mean embeddings and random Fourier features. Our numerical simulations support the conjecture that patterns revealing causal relationships can be learnt from data.
References
A. Berlinet and C. Thomas-Agnan. Reproducing kernel Hilbert spaces in probability and statistics. Kluwer Academic Publishers, 2004.
P. Daniusis, D. Janzing, J. Mooij, J. Zscheischler, B. Steudel, K. Zhang, and B. Sch¨olkopf. Inferring deterministic causal relations. UAI, 2012.
I. Guyon. Chalearn fast causation coefficient challenge, 2014. URLhttps://www.codalab.org/ competitions/1381.
P. O. Hoyer, D. Janzing, J. M. Mooij, J. R. Peters, and B. Sch¨olkopf. Nonlinear causal discovery with additive noise models. NIPS, 2009.
D. Janzing, J. Mooij, K. Zhang, J. Lemeire, J. Zscheischler, P. Daniuˇsis, B. Steudel, and B. Sch¨olkopf. Information-geometric approach to inferring causal directions. Artificial Intelligence, 2012.
D. Janzing, B. Steudel, N. Shajarisales, and B. Sch¨olkopf. Justifying information-geometric causal inference. arXiv prepring arXiv:1402.2499, 2014.
S. Kpotufe, E. Sgouritsa, D. Janzing, and B. Sch¨olkopf. Consistency of causal inference under the additive noise model. ICML, 2013.
D. Lopez-Paz, P. Hennig, and B. Sch¨olkopf. The Randomized Dependence Coefficient. NIPS, 2013.
D. Lopez-Paz, K. Muandet, B. Sch¨olkopf, and I. Tolstikhin. Towards a learning theory of causation. ICML, 2015.
J. M. Mooij, J. Peters, D. Janzing, J. Zscheischler, and B. Sch¨olkopf. Distinguishing cause from effect using observational data: methods and benchmarks. arXiv preprint arXiv:1412.3773, 2014.
K. Muandet, K. Fukumizu, F. Dinuzzo, and B. Sch¨olkopf. Learning from distributions via support measure machines. NIPS, 2012.
K. Muandet, K. Fukumizu, B. Sriperumbudur, A. Gretton, and B. Sch¨olkopf. Kernel mean estimation and Stein effect. ICML, 2014.
J. Peters, Joris M. M., D. Janzing, and B. Sch¨olkopf. Causal discovery with continuous additive noise models. JMLR, 2014.
A. Rahimi and B. Recht. Random features for large-scale kernel machines. NIPS, 2007.
H. Reichenbach. The direction of time. Dover, 1956.
W. Rudin. Fourier analysis on groups. Wiley, 1962.
B. Sch¨olkopf, D. Janzing, J. Peters, E. Sgouritsa, K. Zhang, and J. M. Mooij. On causal and anticausal learning. InICML, 2012.
A. J. Smola, A. Gretton, L. Song, and B. Sch¨olkopf. A Hilbert space embedding for distributions. In ALT. Springer-Verlag, 2007.
B. K. Sriperumbudur, A. Gretton, K. Fukumizu, B. Sch¨olkopf, and G. Lanckriet. Hilbert space embeddings and metrics on probability measures. JMLR, 2010.
Z. Szab´o, A. Gretton, B. P´oczos, and B. Sriperumbudur. Two-stage sampled learning theory on distributions. arXiv preprint arXiv:1402.1754, 2014.