http://www.sciencepublishinggroup.com/j/ijefm doi: 10.11648/j.ijefm.20180605.14
ISSN: 2326-9553 (Print); ISSN: 2326-9561 (Online)
Study on the Current Status of China’s Food Security Based
on Multiple Dimensions Measurement
Fang Min
1, Xin Qinghua
21
Shandong Zibo Experimental High School, Zibo, China
2
School of Economics, Shandong University of Technology, Zibo, China
Email address:
To cite this article:
Fang Min, Xin Qinghua. Study on the Current Status of China’s Food Security Based on Multiple Dimensions Measurement. International Journal of Economics, Finance and Management Sciences. Vol. 6, No. 5, 2018, pp. 224-234. doi: 10.11648/j.ijefm.20180605.14
Received: September 20, 2018; Accepted: October 19, 2018; Published: November 12, 2018
Abstract:
As a large agricultural country, food security is of vital importance to the national economy and people's livelihood.In recent years, food production has been constantly restricted in order to meet the needs of urbanization and economic development. And problems such as resource compression, cost increase and insufficient investment in science and technology have gradually surfaced. In order to guarantee the food production safety, this paper comprehensively analyzes the status of China's food security from four aspects: food availability, food access, food utilization and the stability of food security. Through comparative analysis, it is known that the overall situation of China's food security has been significantly improved. It is better than the average level of developing countries. China also has advantages when compared with other developing countries with large populations, but there is still a certain gap with the average level of developed countries. China's food security situation is not balanced in different dimensions. The food availability situation measured by indicators such as per capita food output and average dietary energy supply has significantly improved. The food access measured by per capita GDP, domestic food price index, prevalence of undernourishment and so on, enhances continuously. The global hunger index was significantly reduced in food utilization, and the condition of food utilization measured by clean drinking water sources and good sanitation facilities was significantly improved. The lower stability index of political stability, the higher domestic food price volatility and per capita food production variability are not conducive to the stability of food security.
Keywords:
Food Security, Food Availability, Food Access, Food Utilization, Stability1. Introduction
From 2004 to 2015, China's food output achieved "the twelfth consecutive increase", from a macro perspective; China's food availability has been relatively abundant. However, China’s food security issue should not be relaxed because it includes food availability as well as food access, food utilization and the stability of food security. Therefore, food security is a complex and comprehensive problem. It is not necessary to study food security from one side, but to carry out comprehensive systematic research from multiple dimensions.
In fact, the study of food security has undergone a process of evolving from the focus on food availability to the attention to food access from the country and region as the research subject to the family and the individual [1]. The Amartya Sen (1981) earlier extended the focus of food security research
have used the countermeasure of anti-food crisis and the frequency of adoption of this measure in the event of food insecurity as a measure [3]; Smith (2000) [4], Kropf (2007) et al [5] have used the physical health check indicators as a measure; Doocy (2005) [6], Shaikh (2007) et al [7] have use food consumption as well as a family's actual food access capacity to meet the basic physiological needs of their family members as a measure. In terms of comprehensive indicators, FAO proposed the Dietary Energy Supply (DES) index; The International Food Policy Research Institute (IFPRI) has compiled the Global Hunger Index (GHI). Household Consumption and Expenditure Surveys (HCES) can be used to estimate food consumption patterns at the household level, assess poverty and household economic status, and calculate consumer price indices [8]. However, the limitations to HCES include that they are mainly estimates of food acquisition and not consumption per se; and cannot be administered frequently and consistently due to the time needed to collect the information [9]. Experienced-based food insecurity scales (EBFIS) have been used for over two decades to measure household level food security. EBFIS are the only indicators that directly measure food security based on the food deprivation process that food security households experience. The limitations of EBFIS are that they do not include questions on issues related to infant feeding, water access and food/water safety; and they do not assess more complex psychological feelings that may be associated with food insecurity such as uncertainty, deprivation, and social unacceptability [10]. The Household Dietary Diversity Score (HDDS) is an indicator used to measure household-level food access using food group consumption in the previous 24 hours [10]. Therefore, the measurement of food security can be divided into macro-national level and micro-household level. The indicators at the macro level are mainly Prevalence of Undernourishment (PoU), Global Hunger Index, Dietary Energy Supply (DES) index. The Global Food Security Index (GFSI) and so on. The indicators at the micro level are mainly Global Food Security Index (GFSI), Dietary intake, Dietary diversity (DD), Coping Strategies Index (CSI), Experienced-based food insecurity scales (EBFIS) and so on. Taking into account policy makers to improve their targeting and monitoring efforts,Pérez-Escamilla R (2017) et al believed that FI is an effective indicator of food security governance, and analyzed the selection problem of the best fi indicator, in order to find a real and effective decision-making tool for improving food security governance [11].
Food security is affected by many factors. UI Ahmed, et al. (2017) have revealed that family size, monthly income, food prices, health expenses and debt were main factors influencing the food security status of rural households, furthermore, the market accessibility factors (road distance and transportation cost) did significantly affect the small farming household food security [12]. Ritchie, et al. (2018) have mapped the Indian food system from crop production to household-level availability across three key macronutrients categories of ‘calories’, ‘digestible protein’ and ‘fat’ [13]. Their analysis indicated severe shortfalls in availability of all macronutrients
across a large proportion of the Indian population. Dharmaraju et al. (2018) have studied the determinants and trends of household food security in Indian urban slum, and they concluded that low socioeconomic status and presence of debt were the major risk factors for food insecurity [14]. Haroon Yousaf, et al. (2018) have examined the food security status of farmer and non-farmer rural households of the Punjab, Pakistan using DIA (Dietary Intake Assessment), HFIAS (Household Food Insecurity Access Scale) and HDDS (Household Dietary Diversity Score) [15]. They concluded that farmer households were more food secure than non-farmer households, and determinants of food security also varied for farmer and non-famer households but monthly income, family size and family structure were important determinants for both type of households.
In 2015, Gong Maogang put forward the multi-dimensional measurement indicators of China's food security from four aspects: food availability, food access, food utilization and food security stability. [16]. However, the literature on multi-dimensional analysis of China's food security situation using these indicators has not been found. In this paper, the multi-dimensional measurement of China's food security situation will make a more comprehensive and objective judgment on China's food security situation, and provide a factual basis for the development of China's food security work.
2. Food Availability Dimension
Food availability plays a decisive role in food security, and adequate food availability to specific population is a prerequisite for ensuring access to food. Indicators that measure the state of the food availability are mainly include total food output, per capita food output, food output structure, per capita protein supply, average dietary energy supply adequacy, food self-sufficiency rate and so on.
2.1. Total Food Output and Structure, Per Capita Food Output
In terms of total food output, since 2004 to 2015, China's food output achieved 12 consecutive increases. Although the total food output in 2017 decreased to 617.93 million tons, 10.904 million tons more than in 2014. Figure 1 shows the growth trend of China's food output and the composition of the total food1. In China, food includes cereals, potatoes and beans, and cereals contain rice, wheat, corn, sorghum, millet and other miscellaneous cereals. Figure 1 shows that cereals account for the vast majority of China’s total food output, accounting for an average of about 90%, with high years reaching 92.1% and low years at 86.9%. Because of the different nutritional value and the amount of calories provided, different food output structures mean different levels of food security. The food output structure in China is dominated by cereal, which has a higher level of food security than the food
structure based on potato, because the cereal has higher nutritional value. Per capita food output can more accurately measure people's food security level. The higher per capita food output, the more secure people's food security will be. As
can be seen from figure 1, per capita food output in China has reached 452.1 kg in 2015, and has been on a continuous growth trend since 2003. The per capita food output is 446.9 kg in 2017 with a small decrease.
Figure 1. China's total food output and its composition (10,000 tons) and per capita food output (kg) in 1995-2017.
2.2. Per Capita Protein Supply
Figure 2. China's protein supply quantity and comparison with other countries in 1990-2016 (g/capita/day).
As various types of food provide different protein and heat, it is not accurate enough to measure food security by simply using food availability, the food protein and energy supply situation should be considered comprehensively. Figure 2 shows the comparison between China's per capita daily protein supply and the average level of developing countries, developed countries and the world2. It can be seen that the daily supply of protein per capita in China has continued to increase, and the supply of protein per capita in 2014-2016 has increased by 50.8% compared with 1990-1992, reaching 98 grams/person/day. There is still a certain gap compared with the average level of developed countries, but the gap is gradually narrowing; Compared with the average level of developing countries and the world, China's per capita protein supply is significantly higher with an increasingly larger degree.
2.3. Average Dietary Energy Supply
Food and Agriculture Organization of the United Nations proposed the Dietary Energy Supply (DES) indicators which is a more comprehensive measure of food availability. It is generally believed that food safety level is higher when DES exceeds 2,200 kcal; DES between 1800 and 2200 kcal, for mild food insecurity; 1600 to 1800 kcal for moderate food insecurity; less than 1,600 kcal for extreme food insecurity. Figure 3 shows the comparison of the dietary energy supply in China with the
2 The data is calculated on an average of three years, from FAO database (http://www.fao.org/faostat/en).
average level of developing countries, developed countries and the world3. Obviously, China's dietary energy supply has continued to increase, from 2,475 kcal per person per day in 1990-1992 to 3,146 kcal in 2014-2016. China's dietary energy supply has exceeded the world average level since the mid-1990s and has been maintained until now. Since the early 1990s, China's dietary energy supply has been higher than the average level of developing countries, from 2.5% in 1990-1992 to 13% in 2014-2016, the higher degree increasing year by year. Compared with the average level of developed countries, there is still a certain gap, but the gap is gradually narrowing, from only 76% of developed countries in 1990-1992 to 92.6% in 2014-2016. Average dietary energy supply adequacy ratio is the proportion of per capita dietary energy supply to per capita dietary energy demand, which is a comprehensive measure of food security through comparison of supply and demand. The larger the ratio, the better the food availability, the food security situation is much more adequate. Figure 4 depicts the comparison between China's average dietary energy supply adequacy ratio and the developing and developed countries3. It can be seen that in the early 1990s, China's average dietary energy supply adequacy ratio was not only far lower than the developed countries, but also lower than the average level of developing countries. However, since then, China's average
dietary energy supply adequacy ratio has increased significantly, not only exceeds the average level of developing countries, but also gradually approaches to the average level of developed
countries. China's dietary energy supply adequacy ratio is 129 in 2014-2016, which is higher than 120 in developing countries, but lower than 136 in developed countries.
Figure 3. China's dietary energy supply and comparison with other countries in 1990-2016 (kcal/person/day).
Figure 4. China's dietary energy supply adequacy ratio and comparison with other countries in 1990-2016 (%).
Figure 5. China's cereal, soybean self - sufficiency rate and comparison with other countries in 1990-2017(%).
2.4. Food Self-Sufficiency Rate
In open economy, food imports become an important source of food availability, but conflicts of interest between countries will have an adverse impact on food trade, therefore, ensuring a certain degree of self-sufficiency is the important prerequisite of a country's food security. In general, the higher the rate of food self-sufficiency or the lower the dependence on food trade, the higher the level of food security in a country; And vice versa. The food self-sufficiency rate is expressed as the proportion of total food output in one year to the total demand. It is generally believed that the food self-sufficiency rate is greater than 100%, indicating that food is completely self-sufficient; Food self-sufficiency rate is between 95% and 100%, indicating that it is basically self-sufficient; The food
self-sufficiency rate increased significantly, which is higher than China. From the perspective of soybean self-sufficiency rate, before 1997, China's soybean self-sufficiency rate was more than 90%, and in most years it exceeded 100%. However, after 1997, the self-sufficiency rate of soybeans continued to decline rapidly, only 14.3% in 2017, and the external dependence reached a super high level. This is mainly because at the beginning of this century, some of the world's big food dealer bought and sold in the soybean futures market and manipulated the futures price, which had adversely affected the soybean planting in China and seriously damaged the interests of soybean farmers. Planting has rapidly decreased, while foreign-owned soybeans with lower prices and better quality have occupied China's soybean market, making China's soybean dependence on foreign countries rise rapidly. However, it can be seen from Figure 1, the main component of China’s food is cereals, while soybeans account for a small proportion of China's total food availability, accounting for only 3~4%, moreover, soybeans are mainly used as fried oil and feed, so it has little impact on food security.
It can be seen from the above analysis that at the level of food availability, China's food security has a good guarantee, but there is still a certain gap with developed countries, fortunately the gap is shrinking.
3. Food Access Dimension
Adequate food availability is the fundamental guarantee of food security. But having enough food availability does not guarantee that everyone will get food, only everyone has enough food to further ensure the full realization of food security. In China, people can obtain food in two ways, namely the market purchase and the self-production. The rural population mainly uses the latter method as a way to obtain
food, and this is actually the food availability dimension, which has already been discussed. The following will be mainly from the market purchase way to analyze China's food access situation. Access to food through market purchases is mainly affected by two aspects, one is the purchasing power, the second is the transport and storage conditions. Purchasing power also depends on people's income and food prices. The higher the income, the lower the price of food, the stronger the purchasing power.
3.1. The Purchasing Power
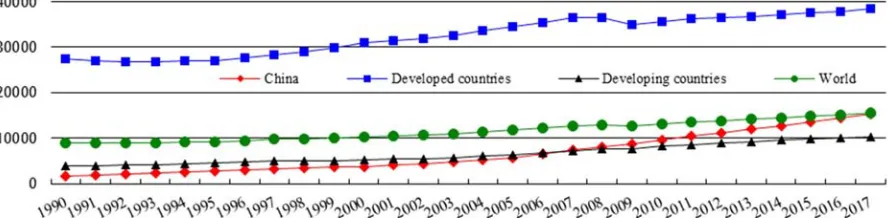
Income levels can be expressed in terms of per capita gross domestic product. Figure 6 shows the comparison of China's per capita GDP at purchasing power parity with the average level of developing countries, developed countries and the world4. It can be seen that China's per capita GDP increased from US $ 1653.5 in 1990 to US $ 15308.7 in 2017, with an average annual growth rate of 8.6%. China's per capita GDP has been lower than the world average, but the gap is narrowing. In 1990, it was only 18% of the world's average, but by 2017, it had reached 99% of the world's average level. Before 2007, China's per capita GDP was lower than the average level of developing countries, but since 2007, China's per GDP exceeded the average level of developing countries, and higher increase year by year, reaching 1.49 times of the average level of developing countries by 2017. Nevertheless, the gap between China and the developed world is still large, In 1990, it was only 6% of the average level of developed countries. By 2017, this proportion was 39.7%. However, in terms of the change in the proportion, the gap between China's per capita GDP and developed countries is narrowing. As a result, the purchasing power of people, measured in terms of income, is increasing year by year.
Figure 6. China's per capita GDP in terms of purchasing power parity and comparison with other countries in 1990-2017 (US $).
Food is a necessity of life, and the price elasticity of its demand is relatively low. When the price of food goes up, people's demand does not decrease too much, but in the case of income level are limited, the higher the price, the less food people actually buy and the lower the level of food security. Due to different kinds of food prices vary widely, the food price index can reflect the average food price level more comprehensively. At the same time, in order to carry out international comparisons, this paper uses the domestic food price level index to measure the price of food, which is based
on 2011 as the base, calculated based on the comparison of the purchasing power parity and the American food price, so the United States food prices are 1. Figure 7 shows the domestic food price level index, as well as the comparison with the average level of developed countries, developing countries and the world4. It can be seen that China's domestic food price index is basically consistent with the world average, slightly lower than the world average before 2007, slightly higher than
the world average after 2007. In the long run, China's domestic food prices has obvious growth trend. But compared with developed countries, China's domestic food price level is significantly higher, about twice that. However, China's domestic food price level is significantly lower than that of
developing countries. Taking into account the per capita income level and food price of China, China's food purchasing power is significantly lower than that of developed countries, but higher than that of developing countries.
Figure 7. China's domestic food price index and comparison with other countries in 2000-2016.
3.2. The Transport and Storage Conditions
Another important factor affecting food access is the transport and storage of material conditions, it determines whether food can be transported smoothly from production to food purchasers, including the infrastructure and tools of land, sea and air transport. After years of infrastructure construction, China's transportation conditions have been greatly improved, but in the concentrated contiguous areas of cold, poor and border areas, transportation condition is still bad and need to further strengthen the road construction.
The above two points are the analysis of food security from the perspective of food access, and the result of food access is a concrete embodiment of people's food access situation, as well as an important aspect reflecting the situation of food security. The number of food shortage people and the incidence of food shortage can reflect the result of food access for people throughout the country. The incidence of food shortage is the proportion of the number of food shortage people to the total population, which is less than 5%, indicating low food insecurity, between 5 and 10%, for moderate food insecurity; between 10 and 20% for more severe food insecurity; between 20 and 35% for severe food insecurity; greater than or equal to 35% for extremely severe food unsafe. Figure 8 shows the number of food shortage
people and incidence of food shortage[This data is based on a three-year average, data from the FAO database]4, from which we can see that the number of food shortage people in China is decreasing, from 289 million in 1990-1992 to 124.5 million in 2015-2017. However, due to the impact of reduced food production during the local period, the population of food shortage has been slow to decrease, and there has been a temporary increase, such as in the early 1990s and in the early years of this century. The incidence of food shortage in China is consistent with the general trend of change of the food shortage population, from 23.9% in 1990-1992 to 8.7% in 2015-2017, indicating that China is still in moderate food insecurity. Compared with the average level of developing countries, the incidence of food shortage in China is lower than that of developing countries except in the early 1990s. In 2015-2017, it was 4.3 percentage points lower than that of developing countries, indicating that China's food security is better than the average level of developing countries. Before 2009-2011, the incidence of food shortage in China was always higher than the world average, and since then it has been lower than the world average, indicating that China's food security situation is better than the world average in recent years. The incidence of food shortage in developed countries has been less than 5%, and China is still far behind.
4. Food Utilization Dimension
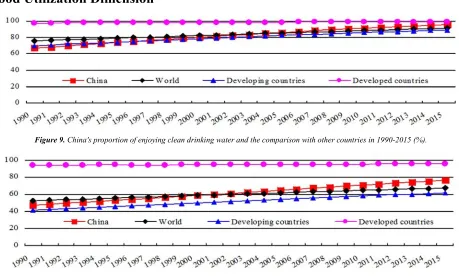
Figure 9. China's proportion of enjoying clean drinking water and the comparison with other countries in 1990-2015 (%).
Figure 10. China's proportion of sanitation and its comparison with other countries in 1990-2015 (%).
Adequate food availability and have the ability to access enough food do not mean that people have good food security status. Because only the food they have accessed can be fully utilized to meet people's nutritional needs, food security will be realized. Food utilization contains the conditions for determining the extent of food utilization and the results of the utilization of food. Good water source and good sanitation are important factors influencing the adequacy of food utilization. Access to clean drinking water and good sanitation is essential for cooking clean and healthy food and maintaining human health. Figure 9 and figure 10 shows the proportion of China's population with clean drinking water and sanitation and its comparison with developing countries, developed countries and the world5. It can be seen that the proportion of China's population with clean drinking water and sanitation is increasing year by year, which increasing from 66.9% and 47.5% in 1990 to 95.5% and 76.5% by 2015 respectively. Compared with the world average, both were below the world average before 2004 and 2000, but have gradually higher than the world average since. Compared with the average level of developing countries, the proportion of people in China who have access to sanitation has been higher than that of developing countries since 1990, and the gap has widened gradually. The proportion of people with pure drinking water also began to exceed that of developing countries in 1997. But compared with the developed countries, both are significantly lower, the gap of the proportion of the population with pure drinking water is relatively small, while the proportion of the population with access to health facilities is still a big gap, but the difference between the degree of view, both gradually narrowing.
5 The data comes from the world bank database (http://www.govindicators.org)
The above is a measure of the conditions that determine the extent of food utilization, and the results of food utilization are reflected in a series of anthropometric indicators. The nutritional health status of individuals is determined by the comparison between nutrient intake and nutrient demand as well as the body's ability to digest absorb and utilize nutrients. Therefore, it is an important embodiment of the effect of food utilization. The better the nutritional health status indicates that food availability is adequate, food access and utilization are effective and food security is high; And vice versa. The indicators used by the United Nations food and agriculture organization (FAO) to reflect the health of nutrition include the proportion of emaciated children under five years old, the proportion of stunted growth, the proportion of anemia, and the mortality rate. The International Food Policy Research Institute (IFPRI) has compiled a composite index containing the above indicators, known as the Global Hunger Index (GHI). Its calculation formula
is: GHI PUN CUW CM 3
+ +
= , PUN means the incidence of
Global hunger index: The inequalities of hunger”. The GHI in 1992, 2000, 2008, 2016 and 2017 were calculated respectively from 1990-1994, 1998-2002, 2006-2010, 2011-2016 and 2012-2017. As can be seen from figure 11, the GHI in China has decreased from 26.4 in 1992 to 7.5 in 2017. Although the level of food security has been significantly improved, it is still in moderate food insecurity. Compared with the other six most populous developing countries, China's GHI is significantly higher than the other five countries except Brazil, but there is a gap with Brazil. In 2017, Brazil's GHI has been 5.4, which is at the same level as that of developed countries. Although the gap still exists, GHI declined rapidly in China and the gap is narrowing, which reduced from 10.3 in 1992 to only 2.1 higher now.
Figure 11. The global hunger index of the seven most populous developing countries in 1992-2017.
5. Food Security Stability Dimension
The stability of the food security is caused by the vulnerability of food security, and food insecurity is aggravated by uncertainties such as natural disasters, conflict
wars, diseases, economic crises, and food price fluctuations, etc., so food security has certain fragility. Food crisis and famine are important manifestations of food security instability. The Bengal famine in South Asia in 1943, the great famine during the three-year natural disaster in China from 1959 to 1961, and the famine in the Sahara region from 1968 to 1973 are important manifestations of food security instability and vulnerability. The stability of the food security problem is closely linked to food availability, food access and food utilization. It is precisely because of external uncertainties that lead to the instability of these three aspects and thus the instability of food security. For food security stability measurement, we can start from the following aspects: the political stability indicators provided by the World Bank, the proportion of effective irrigated areas that measure the stability of food availability, the frequency of natural disasters, the volatility of food prices, the volatility of food production, as well as the above mentioned food dependence on imports and so on. In recent years, the frequent occurrence of extreme natural disasters has strengthened the link between food security vulnerabilities and extreme climate change, and unpredictable weather has led to a significant decline in food output and people's income in fragile areas, the risk of food insecurity has increased dramatically. Although FAO believes that the impact of international food price volatility on domestic food prices may be less than expected, the rise in international food prices in 2007-2008 has led to food crises and social unrest in some African countries, fully demonstrating the instability of food security and vulnerability.
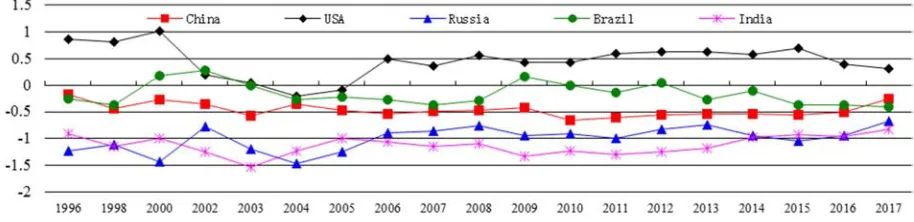
Figure 12. China's political stability index and comparison with other countries in 1996-2017.
The political stability index is an indicator of a country's political stability calculated by the world bank. The index is between -2.5 and 2.5, and the larger the value, the more stable the political situation. Figure 12 shows the political stability index of China and its comparison with other countries in 1996-20156. It can be seen that China's political stability index is around -0.5, which is significantly lower than that of the United States, and lower than that of Brazil, which is also a developing countries, but higher than Russia and India. From the perspective of food security stability predicted by the political stability index, there are great risks of food insecurity in China. The greater the proportion of effective irrigation in cultivated land, the stronger the ability to cope with natural
disasters caused by inclement weather, and the higher the stability of food security. Figure 13 shows the proportion of effective irrigation in China's cultivated land and its comparison with the world average and other countries6. It can be seen that the proportion of effective irrigation in cultivated land in China is growing. At present, 2/3 of cultivated land can be effectively irrigated. The proportion of effective irrigation in China's cultivated land is obviously higher than the world average, and it has obvious advantages over developing countries such as India and Brazil. In spite of the rain is
abundant in some countries in the world, such as tropical rainforest countries like Brazil, food production basically needs no artificial irrigation and can be completely depending on the weather. However, rain water resources in China are distributed unevenly and have large seasonal differences. Therefore, good irrigation conditions can better guarantee the stability of food security. The domestic food price volatility index can measure the degree of fluctuation of the relative price of food in a country. The larger the index is, the higher the price volatility. Figure 14 shows China's domestic food price volatility index and its comparison with the overall level of developed countries and developing countries6. It shows that China's domestic food price volatility index significantly higher than the world average and the average level of developed countries, and it is also significantly higher than the average level of developing countries except 2007. and this is
the same case when compared with India except 2014. Thus it can be seen that China's food price volatility is relatively large, which is obviously not conducive to the stability of food security. The per capita food output variation index reflects the fluctuation of food output. As can be seen from fig.156, the fluctuation of China's food output is higher than the average level of the world and developing countries, indicating high food availability instability, but lower than the average of developed countries. Due to the strong purchasing power and high self-sufficiency rate in developed countries, the fluctuation of food output has little impact on food security. Before 2002, China's food output fluctuated more than India, but then significantly lower than India. Compared with Brazil, China's food output fluctuation is also significantly lower, indicating that the food output stability of China is higher than that of the large population in developing countries.
Figure 13. China's proportion of effective irrigation in cultivated land and comparison with other countries in 1961-2014 (%).
Figure 14. China's food price volatility index and comparison with other countries in 2000-2014.
Figure 15. China's per capita food production variability and comparison with other countries in 1990-2015.
6. Conclusion and Implications
Through the above analysis, the conclusions and
implications of this paper have three main points.
developing countries and also has certain advantages compared with other populous country in the developing world. But it still lags behind the average of developed countries. Although the overall situation of food security in China has improved significantly, it is not balanced in the performance of different dimensions and indicators.
Second, in the food availability dimension, China's total food output, per capita food output continued to increase over the long term; Protein supply, dietary energy supply and its adequacy ratio continued to increase, and higher than the average level of developing countries, but lower than the average level of developed countries; Cereal has basically achieved full self-sufficiency, consistent with several populous developing countries, lower than developed countries, but the soybean self-sufficiency has declined significantly. In terms of food access dimensions, China's per capita GDP, which is calculated at purchasing-power parity, has continued to grow faster than the average level of developing countries, but is still below the average level of the world and developed countries. China's domestic food price index has been relatively stable in recent years, consistent with the world average, below the average level of developing countries, but higher than that of developed countries. Both the number of food shortage people and the incidence of food shortage have declined significantly, which is already lower than the average of developing countries and the world, but it still has a certain gap with developed countries. In the dimension of food utilization, the proportion of people with access to clean drinking water and sanitation has increased significantly, which is already higher than that of developing countries and the world average, but still lower than that of developed countries. The global hunger index has dropped significantly, ranking second among the most populous countries in the developing world, only higher than Brazil, but there is a gap with the developed countries. In the stability dimension of food security, China's political stability index is still low, and there is a greater risk of food insecurity; the proportion of effective irrigation in cultivated land is obviously higher than that of the world average and other developing countries, which can better ensure the stability of food output. China's food price volatility index is higher than the average level of developed and developing countries, which is not conducive to the stability of food availability and food access; China's per capita food production variability index is slightly higher than the world average level, indicating that the food availability is not stable.
Third, China's policy measures to ensure food security should be made from four aspects: food availability, food access, food utilization and food security stability. In terms of food availability, we will continue to increase food output and increase the per capita food output. Improve people's protein and dietary energy supply; Maintain food self-sufficiency rate and so on. Increase per capita income level for food access, stabilize domestic food prices, improve food storage and access means. Improve the quality of drinking water and sanitation facilities for food utilization; Improve people's
physical health. In terms of food security and stability, improve agricultural infrastructure, enhance agricultural productivity and capacity to respond to risks, maintain the long-term stability of the country, and improve natural climate conditions.
References
[1] Davis C G, Thomas C Y, Amponsah W A. (2001). Globalization and Poverty: Lessons from the Theory and Practice of Food Security. American Journal of Agricultural Economics, 83(3): 714-721.
[2] Amartya Sen. (1983). Poverty and Famines: An Essay on Entitlement and Deprivation. Oxford University Press, , Oxford, UK, 1981: 45-89.
[3] Gilligan D O, Hoddinott J. (2007). Is There Persistence in the Impact of Emergency Food Aid? Evidence on Consumption, Food Security and Assets in Rural Ethiopia. American Journal of Agricultural Economics, 89 (2): 225-242.
[4] Smith L C, El Obeid A E, Jensen H H. (2000). The geography and causes of food insecurity in developing countries. Agricultural Economics, 22 (2): 199-215.
[5] Kropf L, Holben D H, Holcomb J P, et al. (2007). Food security status and produce intake and behaviors of Special Supplemental Nutrition Program for Women, Infants, and Children and Farmers' Market Nutrition Program participants. Journal of the American Dietetic Association, 107(11): 1903-1908.
[6] Doocy S, Teferra S, Norell D, Burnham G. (2005). Credit program outcomes: coping capacity and nutritional status in the food insecure context of Ethiopia. Social Science & Medicine, 60: 2371-2382.
[7] Shaikh F M. (2007). Determinants of Household Food Security and Consumption Pattern in Rural Sindh: An Application of Non-Separable Agricultural Household Model. Conference Paper, Spain.
[8] Jones, A. D, Ngure, F. M., Pelto, G., Young, S. L. (2013). What are we assessing when wemeasure food security? A compendium and review of current metrics. Advances in Nutrition, 4 (5): 481–505.
[9] Carletto, C., Zezza, A., Banerjee, R. (2013). Towards better measurement of household food security: harmonizing indicators and the role of household surveys. Global Food Security, (2): 30–40.
[10] Leroy J L, Ruel M, Frongillo E A, et al. (2015). Measuring the Food Access Dimension of Food Security: A Critical Review and Mapping of Indicators. Food & Nutrition Bulletin, 36(2): 167-195.
[11] Pérez-Escamilla R, Gubert M B, Rogers B, et al. (2017). Food security measurement and governance: Assessment of the usefulness of diverse food insecurity indicators for policy makers. Global Food Security.
[13] Ritchie H, Reay D, Higgins P. (2018). Sustainable food security in India-Domestic production and macronutrient availability. Plos One, 13(3): 1-17.
[14] Dharmaraju N, Mauleshbhai SS, Arulappan N, et al. (2018). Household food security in an urban slum: Determinants and trends. Journal of Family Medicine & Primary Care, (7): 819-822.
[15] Haroon Yousaf, Muhammad Iqbal Zafar, Farkhanda Anjum and Sultan Ali Adil. (2018). Food security status and its determinants: a case of farmer and non-farmer rural households of the Punjab, Pakistan. Pakistan Journal of Agricultural Sciences, 55(1): 217-225.