INTRODUCTION
Energy plays a vital role in the social, economic, industrial and agricultural growth and comprehensive development of a country. World wide per capita energy consumption is increasing due to rapid industrialization, urbanization and growth in transport and service sector. There is a need to maintain a balance between power generation and environmental health. Power production through fossil fuels particularly coal often leads to environmental pollution. Electricity produced from coal emits CO2 gas at an average rate of 0.98 kg/kWh [1]. It is estimated that 55% electricity generated is from coal based thermal power plants. The combustion of coal in thermal power plants is a major cause of increase in the CO2 concentration levels in the atmosphere2. 41% share of all emissions is from coal generated electricity3. Several studies have shown that plants
Projection of Carbon Dioxide (CO
2) Emissions
in Coming Decades in Indian Context
I. NAWAZ
Department of Mechanical Engineering, Faculty of Engineering and Technology, Jamia Millia Islamia, Jamianagar, New Delhi - 110 025 (India).
(Received: May 09, 2012; Accepted: June 28, 2012)
ABSTRACT
Every observable movement involves energy. Hence, energy is obviously an important determinant in the development of a nation. To be specific, the standard of living is directly related to the per capita energy consumption in the region. The per capita energy consumption is mostly due to consumption of electricity. Therefore, electric power is one of the key factors in development of a country. The combined effect of population growth and increase in industrial, domestic and agricultural activities are inevitable and the basic reason for the increase in the worldwide energy demand. Particularly in the Indian context, the power demand is likely to increase by 7% per annum in the next few decades; assuming a GDP growth of 9%. The major resources of electricity generation are the conventional fossil fuels: coal, oil and natural gas. At present, 55% of electricity generated in India is from coal. However, use of coal for electricity generation results in increase of CO2 concentration in atmosphere. In this study, an attempt has been made to estimate the increase in CO2 emission on the basis of statistical analysis using the available data of power production and projected population growth.
Key words: Per capita energy consumption, Development, Power demand, CO2 emissions, Population growth.
Sources of CO2 emission
CO2 emission arises by two factors namely; a. Natural sources include: volcanic out gassing, the combustion and decaying of organic matter and also the respiration process of living aerobic organisms and b. Man-made sources include: the burning of
fossil fuels, for heating, power generation, transport, industrial processes, domestic activities and agriculture as well as deforestation and other sources. They have greatly increased CO2 concentration in atmosphere. In this study, CO2 emission only through coal-based thermal power plants is considered.
Prediction of CO2 emission for coming decades On the basis of “best parabolic fit” we can predict the population, electricity demand as well as CO2 emissions from coal-based power plants for the next few decades in India.
P = az2 + bz + c ...(1)
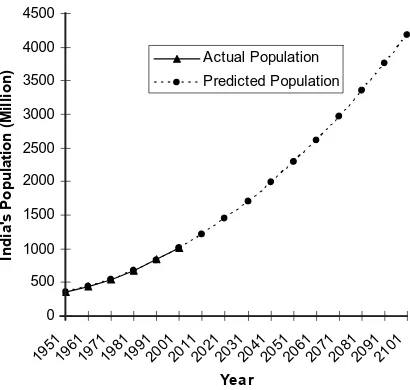
where, P denotes the expected population and z denotes the year. The regression equation for population growth is given by [8].
P = 0.124z2 + 6.64z + 353 ...(2) where, z = Year-1950
Equation (2) has been computed up to the end of 21st century of India is shown in Figure (1). Methodology
Equations (1) and (2) have been used to estimate the population growth as shown in Figure (1). The power demand is expected to be proportional to population. Following assumptions have been made:
(i) Migration of CO2 emitted in India has not been allowed to other countries and vice versa for Indian context;
(ii) Yearly CO2 emitted by thermal power plants is uniformly distributed in atmosphere (no stratification of CO2 in the atmosphere) 11-km above mean sea level [9];
(iii) 50% of yearly CO2 emitted is absorbed by photosynthesis and sea surface [10];
(iv) Electrical energy produces 0.98 kg /kWh of CO2 in the atmosphere from coal [1]. Power demand up to 2100
The electric power generated at the generation end does not completely reach to the consumer end. Rather only a part of it is able to arrive at the consumer end. If the energy consumption per capita (E) is known, the actual power generation per capita (E1) required, can be estimated as;
...(1)
Energy is expressed in kWh and the power generation capacity of plants is expressed in MW, (1kWh is equivalent to 0.114 MW).
Considering plant load factor (PLF) 75% [10] and Transmission & distribution losses (TDL) 23% [11], the actual power generation per capita can be estimated as;
...(4)
Similarly, the actual power generation (E2) for whole population (P) for India can be expressed as;
E2 = E1×P ...(5)
Using the Equations (2) and (5), the predicted population and actual power generation capacity is given in Table 1.
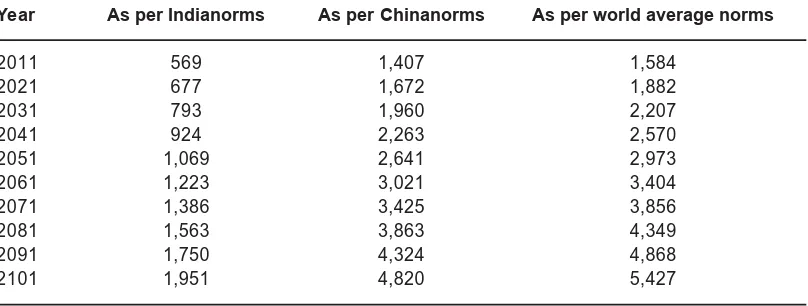
CO2 emissions
As mentioned earlier that 55% electricity generated from coal based power plants. So, we calculate 55% of column 3, 4 and 5 respectively.
...(6)
The net CO2 emission (Mt) = 0.5×(expression of
Equation 6) ...(7)
Where Mt = million ton
RESULTS
Table (2) shows the net CO2 emissions due to electricity generation from coal based thermal power plants of present century in India.
CO2 Concentration (ppm): In Indian context The geographical area of India is known
to be 32, 87,263 km2 [12]. Assuming height of atmosphere to be 11 km, above mean sea level9, the atmospheric value above the territory of India is;
3.29×11×1015 m3
The CO2 concentration is expected to increase with CO2 emissions from coal burnt for electricity generation. The ppm value is related to the mass of CO2 emitted according to the following equation [13].
Table 1: Predicted population and actual power generation capacity Year Population Actual power generation capacity (MW)
(million) As per India As per China As per world
norms norms average norms
2011 122 2,40,634 5,95,094 6,69,992
2021 145 2,86,233 7,07,284 7,96,302
2031 170 3,35,584 8,29,229 9,33,596
2041 198 3,90,857 9,65,808 10,87,365
2051 229 4,52,052 11,17,020 12,57,608
2061 262 5,17,195 12,77,988 14,38,836
2071 297 5,86,286 14,48,712 16,31,047
2081 335 6,61,299 16,34,069 18,39,733
2091 375 7,40,260 18,29,182 20,59,403
2101 418 8,24,143 20,38,928 22,95,547
Table 2: CO2 emissions due to electricity generation from coal
Year As per Indianorms As per Chinanorms As per world average norms
2011 569 1,407 1,584
2021 677 1,672 1,882
2031 793 1,960 2,207
2041 924 2,263 2,570
2051 1,069 2,641 2,973
2061 1,223 3,021 3,404
2071 1,386 3,425 3,856
2081 1,563 3,863 4,349
2091 1,750 4,324 4,868
2101 1,951 4,820 5,427
0 500 1000 1500 2000 2500 3000 3500 4000 4500
195119611971198
1
199120012011202120312041205120612071208
1
20912101
Year
Indi
a'
s P
opul
at
ion (
M
illio
n
) Actual Population
Predicted Population
Fig. 1: Population versus year ...(8)
The annual net increase of CO2 concentration has been evaluated by using the following expression.
...(9)
= 0.216 ppm per year (as per India norms)
Effects of CO2
It is a well known fact that carbon dioxide is a green house gas whose increased concentration is a possible outcome of global warming. The global warming will increase with time, and could have disastrous consequences. These might include;
´ Sea level rise
´ Negative impact on agricultural productivity ´ Spread of diseases
´ Change in ecosystem
´ Climate change
´ Significant change in the world’s rainfall pattern
´ Rise in global temperature ´ Increased extreme weather
The average global temperature has increased by more than 0.70C over the past century, and the present warming rate is 0.20C per decade. If continued, this trend will lead to a temperature rise of about 30C by the end of this century [6]. However, it is certain that the dynamic equilibrium among the major CO2 reservoirs of the biosphere has been disturbed, and the effects of such disastrous are a matter of considerable and immediate concern.
Environmental Implications
Remedial measures
Since power is and has always been an essential part of human life, we cannot possibly reduce the power requirement. Hence, there is a strong need to control the increase of CO2 concentration in atmosphere by
a) Control of the population growth b) Plantation of more trees
c) Reduction of dependency on fossil fuels d) Development of alternative fuel such as
hydrogen
e) Search for alternative sources of energy and f) Greater role of renewable energy sources.
All these measures become important. A balance must be maintained between human activities and environmental health. The last two suggestions in the above list deserve particular attention.
CONCLUSION
The Equation (8) shows the net increase of CO2 concentration 19.4 ppm due to power
generation only from coal. The annual net increase of CO2 is 0.216 ppm as per India’s energy consumption norms. However, the CO2 emission from India is only about 4% of the global emission. On the bases of the current energy mix and present day technologies for electricity generation the CO2 emission from India alone could become as much as half of the present of global emission in a few decades from now.
It is apparent that CO2 emission in atmosphere is unavoidable. Further it is increasing steadily with population and the increasing energy demand. There is a strong need for greater role of renewable energy in particular of solar energy, wind energy and hydro electric power. They do not emit CO2. A simultaneously proper policy regarding population growth and growth of more trees is indicated. These measures are obvious but have been largely ignored by policy planners. In view of the possibility of irreversible damage to the environment, wakeup call has become necessary. Greater public awareness would lead to better planning which is urgently needed.
REFERENCES
1. Watt M., Johnson a., Ellis M. and Quthred H. Life cycle air emission from PV power system. Progress in Photovoltaic: Research Application 1998.
2. Power sector at a glance All India. http:// www.powermin.nic.in indian_electricity_ scenario/introduction.htm
3. IEA statistics, International Energy Agency (IEA),CO2 emission from coal combustion, Highlights-2011,Edition. http://www.iea.org/ co2highlights/co2highlights.pdf.
4. Trends in atmospheric carbon dioxide-NOAA. Earth System Research Laboratory. Global Monitoring Division, Mauna Loa, Hawai. http;//www.esrl.noaa.gov/ghg/ccgg/ trends/
5. Bihar use least power, Delhi the most-Bihar Times http://www.bihartimes.in/Newsbihar/ 2011/Aug/newsbihar15Aug/html
6. 14th International Exhibition & Conference “power India 2012”, Bombay Exhibition
Centre, Goregaon, Mumbai, India. http://www. Indiapowershow.com/
7. 3 Degree opf warming-Global warming. http:/ / w w w . g l o b a l g r e e n h o u s e . c o m / 3 -degree.html
8. Nawaz I., Khan R. A., Khan M. Emran and Tiwari G. N. optimization of clean environment parameters through renewable energy sources. Int. Journal of Ambient Energy, Ambient Press Ltd. 24(3): 67-74 (2003).
9. The Earth’s atmosphere. Clouds R vUs.com-Weather Features http://www.rch27.dial. pipex.com/cloudsrus/atmosphere.html 10. All India plant load factor. http://
www.cea.nic.in/reports/monthly/executive_ rep/jul11/7.pdf.
11. Transmission and distr ibution losses (power) http://www.teriin.org/upfiles/pub/ papers/ft33.pdf
www.thecoloursofindia.com
13. Rao C.S. Environmental Pollution Control
Engineering. Wiley Easter Ltd. New Delhi, p 30-35 (1999).
Appendix-1 Conversion of μg/m3 to ppm
The concentration of a pollutant is customarily expressed in volumetric terms. At present, gaseous concentration are expressed with mixed units of mass per unit volume such as µg/m3. The relationship between ppm (by volume) and µg/m3 depends on the density of the pollutant, which, in turn depends on its pressure and temperature as well as its molecular weight (mol wt). Thus one can write:
CO2 Conc. (ppm) =
)
(
)
(
.
.
10
/
3 2
3
2
m
volume
c
Atmospheri
g
CO
of
Mass
wt
mol
gm
CO
for
mole
litre
×
μ
×
...(A-1)For CO2, liter/mole = 22.4* and
gm mol weight = 44** Hence Eq. (1) becomes
CO2 Conc. (ppm) =
)
(
10
.)
(
.
10
44
4
.
22
3 18 2
3
m
volume
c
Atmospheri
Mt
emitted
CO
of
Mass
×
×
×
... (A-2)=
)
(
.)
(
10
09
.
5
3 2 14
m
volume
c
Atmospheri
Mt
CO
of
Mass
×
×
...(A-3)