Twenty years of ecosystem services: How far have we come and how far
do we still need to go?
Robert Costanza
a,⇑, Rudolf de Groot
b, Leon Braat
c, Ida Kubiszewski
a, Lorenzo Fioramonti
d, Paul Sutton
e,
Steve Farber
f, Monica Grasso
ga
Crawford School of Public Policy, Australian National University, Australia
bEnvironmental Systems Analysis Group, Wageningen University & Research, The Netherlands c
Egmond aan Zee, The Netherlands d
Centre for the Study of Governance Innovation, University of Pretoria, South Africa e
Department of Geography and the Environment, University of Denver, United States f
University of Pittsburgh, United States g
National Oceanic and Atmospheric Administration (NOAA), United States
a r t i c l e i n f o
Article history:
Received 4 June 2017
Received in revised form 15 August 2017 Accepted 19 September 2017
a b s t r a c t
It has been 20 years since two seminal publications about ecosystem services came out: an edited book by Gretchen Daily and an article inNatureby a group of ecologists and economists on the value of the world’s ecosystem services. Both of these have been very highly cited and kicked off an explosion of research, policy, and applications of the idea, including the establishment of this journal. This article traces the history leading up to these publications and the subsequent debates, research, institutions, policies, on-the-ground actions, and controversies they triggered. It also explores what we have learned during this period about the key issues: from definitions to classification to valuation, from integrated modelling to public participation and communication, and the evolution of institutions and governance innovation. Finally, it provides recommendations for the future. In particular, it points to the weakness of the mainstream economic approaches to valuation, growth, and development. It concludes that the sub-stantial contributions of ecosystem services to the sustainable wellbeing of humans and the rest of nature should be at the core of the fundamental change needed in economic theory and practice if we are to achieve a societal transformation to a sustainable and desirable future.
Ó2017 Elsevier B.V. All rights reserved.
Contents
1. Introduction . . . 2
1.1. Scope and ambition. . . 2
1.2. A short history of ecosystem services and natural capital pre-1997 . . . 2
2. Definitions . . . 3
2.1. Ecosystem services . . . 3
2.2. Natural capital . . . 3
2.3. Do we need a cascade? . . . 5
3. Classification systems . . . 6
4. To value or not to value: That isNOTthe question . . . 7
4.1. What is value anyway?. . . 7
4.2. Conventional approaches to ES valuation . . . 9
4.3. Aggregating values to larger scales . . . 9
4.4. Challenges for valuation . . . 9
5. Research, applications, and policy since 1997 . . . 10
5.1. Research. . . 10
https://doi.org/10.1016/j.ecoser.2017.09.008 2212-0416/Ó2017 Elsevier B.V. All rights reserved.
⇑ Corresponding author.
E-mail address:[email protected](R. Costanza).
Contents lists available atScienceDirect
Ecosystem Services
5.2. Integrated modelling. . . 10
5.3. Main institutions and programmes . . . 11
6. Institutional evolution and governance innovations . . . 11
6.1. Property rights. . . 11
6.2. Scale and distribution . . . 12
6.3. Information and evidence-based policy . . . 12
7. Lessons learned . . . 13
7.1. Integrated measurement, modelling, valuation, and decision support . . . 13
7.1.1. Trade-offs . . . 13
7.1.2. Accounting and assessment . . . 13
7.1.3. Modelling and scenario planning . . . 13
7.1.4. Bundling . . . 13
7.1.5. Scaling . . . 13
8. Conclusion: A new economic paradigm that puts ‘nature’ at the core . . . 13
Acknowledgements . . . 14
References . . . 14
1. Introduction
1.1. Scope and ambition
Twenty years ago, two seminal publications about ecosystem services came out: an edited book by GretchenDaily (1997)and an article inNatureon the value of the world’s ecosystem services (Costanza et al., 1997). These publications kicked off an explosion of research, policy, and applications of the idea, including the establishment of the journal Ecosystem Services (Braat and de Groot, 2012). This article first traces the history leading up to these publications and the subsequent debates, research, institutions, policies, on-the-ground actions, and controversies they triggered (Section 1.2). It then summarises and evaluates a set of publica-tions on key issues: definipublica-tions (Section 2), classification (Sec-tion 3), valua(Sec-tion (Sec(Sec-tion 4), research topics (Sec(Sec-tion 5.1), integrated modelling (Section 5.2), institutions and programmes (Section 5.3), and the evolution of institutions and governance innovation (Section 6). Finally, it provides recommendations for the future (Section 7). The major thread connecting the sections is the ‘‘evolutionary history” of the topics. Given this scope, the paper is of necessity a hybrid. It combines elements of a research review, stock taking, and our opinions about the way forward. We have identified where we voice our opinions versus the results of research. In particular, we have focused on what we think are the weaknesses of the mainstream economic approaches to valua-tion, growth, and development.
1.2. A short history of ecosystem services and natural capital pre-1997
The term ‘nature’s services’ first appeared in the academic liter-ature in a 1977 paper inScienceby Walter Westman titled ‘How Much Are Nature’s Services Worth?’ (Westman, 1977). The syn-onymous term ‘ecosystem services’ first appeared inEhrlich and Ehrlich (1981) and more systematically in Ehrlich and Mooney (1983). However, related ideas had been brewing in the academic literature for decades, and one could argue that the idea that nat-ural systems provide benefits that support human wellbeing is as old as humans themselves.Gómez-Baggethun et al. (2010)provide a more detailed history of the ecosystems services concept, focus-ing on its economic roots.Braat and De Groot (2012)summarised the history of the concept tracing the disciplinary backgrounds, both in economics and ecology and the synthesis in ecological economics.
What changed in the second half of the 20th century was that the loss of these ecosystem services became much more apparent, as natural capital was quickly being depleted (Beddoe et al., 2009).
There was also a growing understanding of ecology, especially the ecology of whole ecosystems, and of the non-market value of nat-ural amenities. Seminal publications in the 1960–1980 period include:Boulding (1966), Daly (1968), Ayres and Kneese (1969), Odum (1971), andFreeman et al. (1973).
For some time, these two streams of work proceeded in parallel, with limited contact and cross-fertilization: the ecosystem ecology community, on the one hand, and the environmental and resource economics community, on the other. Then, in the 1980 s, a new transdisciplinary field known as ‘ecological economics’ was estab-lished (Jansson, 1984; Costanza, 1989) with a view to bridging the gap between these two communities, while also embracing other strands of research, including psychology, political science, and earth system sciences as well as connecting academic work with practice and traditional knowledge (de Groot 1987; Braat 1992; de Groot 1992). Ecosystem services were an explicit part of the research agenda of ecological economics from the beginning (Costanza et al., 1991).
A key event in the history of ecosystem services was a meeting in October 1995 of Pew Scholars in Conservation and the Environ-ment in New Hampshire. This group included Jane Lubchenco, Ste-phen Carpenter, Paul Ehrlich, Gretchen Daily, Hal Mooney, Robert Costanza, and others. The meeting was organized around the idea of producing an edited book on ecosystem services. Gretchen Daily was invited to be the editor and twenty-one chapters were assigned to over thirty authors. This book was eventually pub-lished asNature’s services: societal dependence on natural ecosystems
(Daily, 1997). The chapters covered definitions, history, economic valuation, overarching services like climate and biodiversity, ser-vices from specific biomes including marine, freshwater, forests, and grasslands, and case studies in specific ecosystems including wetlands and South African fynbos.
hectare for each of the biomes. The results were eventually pub-lished inNature(Costanza et al., 1997), with a companion ‘news and views’ piece byPimm (1997). This is from the abstract:
For the entire biosphere, the value (most of which is outside the market) is estimated to be in the range of US$16–54 trillion (1012) per year, with an average of US$33 trillion per year. Because of the nature of the uncertainties, this must be considered a minimum estimate.
This quantity was significantly larger than global gross domes-tic product (GDP) at the time. The magnitude of this result shocked some people. Some were surprised because they thought the esti-mate was too low (an ‘underestiesti-mate of infinity’ by one account), others because they thought it was too high (how could it be larger than the entire world’s GDP?), and others because they thought it was a profane and vulgar thing to do in the first place (how can you put a price on nature?). However, most people understood our point in making this admittedly crude estimate: to demonstrate that ecosystem services were much more important to human wellbeing than conventional economic thinking had given them credit for. For example, conventional economic accounting only valued (and still does) ecosystems when their products were har-vested and sold in markets. Trees cut for timber were counted and valued but the services of regulating climate, controlling flood-ing and erosion, and providflood-ing recreational and aesthetic opportu-nities, were not. As a result, their crucial contribution to human wellbeing was ignored in development policy. In contrast, we wanted to show that standing, intact, functioning ecosystems pro-duce many valuable services, which are often more significant than what results from their extraction and exploitation. We also wanted to show that it was possible to at leastestimatetheir value in units comparable to other services that people knew and cared about (i.e., in monetary units). Of course, individual estimates for the value of specific ecosystem services in specific biomes had been done before. The authors of the 1997 paper merely synthe-sized all of these studies to assemble a global total.
The paper got a huge amount of positive press coverage, includ-ing in Science (Roush, 1997), The Chronicle of Higher Education
(McDonald, 1997),the New York Times(Stevens, 1997),Newsweek, Science News, National Public Radio, and the BBC. It was even included as one ofDiscovermagazine’s Top 100 Science stories of 1997 (Zimmer, 1998).
It also sparked controversy and criticism due to its methods and results, including Hueting et al. (1998), Norgaard et al. (1998), Pearce (1998), andBockstael et al. (2000). We address some of these issues further on. However, it is clear that theNaturepaper had the effect the authors hoped for. As they concluded in the paper:
Given the huge uncertainties involved, we may never have a very precise estimate of the value of ecosystem services. Neverthe-less, even the crude initial estimate we have been able to assemble is a useful starting point (we stress again that it is only a starting point). It demonstrates the need for much additional research and it also indicates the specific areas that are most in need of additional study. It also highlights the relative importance of ecosystem services and the potential impact on our welfare of con-tinuing to squander them. (pp. 259).
TheNature paper, combined with the appearance at approxi-mately the same time of Daily’s edited volume that described many of the ecosystem services in detail, sparked an explosion of research1and policy interest in ecosystem services. We summarize, highlight, and evaluate some of this in the following sections. But first, a bit about definitions.
2. Definitions
2.1. Ecosystem services
‘Ecosystem services’ (ES) are the ecological characteristics, func-tions, or processes that directly or indirectlycontribute to human wellbeing: that is, the benefits that people derive from functioning ecosystems (Costanza et al., 1997; Millennium Ecosystem Assessment (MEA), 2005). This simple and seemingly straightfor-ward definition has been the subject of much debate in the twenty years since 1997, so some clarification may be needed. First, it is important to distinguish between ecosystem processes and func-tions, on the one hand, and ecosystem services on the other (see also Table 1). Ecosystem processes and functions contribute to ecosystem services but they are not synonymous. Ecosystem pro-cesses and functions describe biophysical relationships that exist regardless of whether or not humans benefit. By contrast, ecosys-tem services are those processes and functions that benefit peo-ple2, consciously or un-consciously, directly or indirectly. They only exist if they contribute to human wellbeing and cannot be defined independently (Braat, 2013). The concept of ‘ecosystem dis-services’ denotes the processes and functions that affect humans in ‘negative’ ways, causing damage and costs (Shapiro and Báldi, 2014; Sandbrook and Burgess, 2015).
However, the connections between ecosystem processes and functions and human wellbeing are complex and the various path-ways are still not well understood, so we have to take a pluralistic and precautionary approach to assessing these connections and to valuation of the benefits. There is not one right way to assess and value ecosystem services. There is however a wrong way, that is, not to do it at all.
Some have argued (Thompson and Barton, 1994; McCauley, 2006), that the concept of ecosystem services represents a very ‘anthropocentric’, instrumental, or utilitarian view of nature – that nature only exists to ‘service’ humans. Firstly, we do not agree with this simplified view of the concept of ecosystem services. In our view, the notion of ecosystem services implies recognition that humans depend for their wellbeing and their very survival on the rest of nature and thatHomo sapiensis an integral part of the cur-rent biosphere. Secondly, these critics ignore the fact that humans are a biological species and, like all other species, they ‘use’ the resources in their environment to survive and thrive. Unless we recognize our interdependence with the rest of nature we are put-ting our species’ wellbeing at risk, and at the same time we blindly endanger global ecosystems. So, rather than implying that humans are theonly thingthat matters, the concept of ecosystem services makes it clear that the whole system matters, both to humans and to the other species we are interdependent with. If anything, the ecosystem services concept is a ‘whole system aware’ view of humans embedded in society and embedded in the rest of nature. ‘Centric’ with any prefix doesn’t really describe this complex interdependence.
2.2. Natural capital
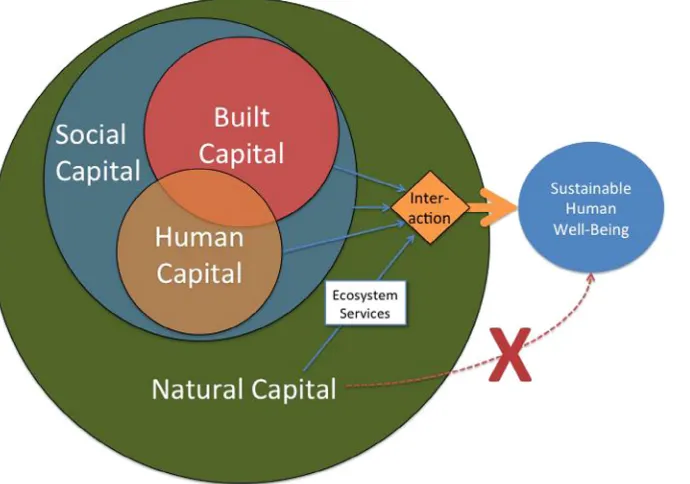
The ecosystems that provide the services are sometimes referred to as ‘natural capital,’ using the general definition of cap-ital as a stock that yields a flow of services over time (Costanza and Daly, 1992). Here the term ‘capital’ is useful to reconnect the human economy with its ecological dimensions. In order for these benefits to be realized, natural capital (which does not require human activity to build or maintain) must interact with other
1 As of March, 2017, theNaturepaper had been cited in Google Scholar over 17,000
times and the Daily book had been cited over 6,000 times, making them among the most highly cited works in the environment/ecology area to date.
2
forms of capital thatdorequire human agency to build and main-tain. These include: (1) built or manufactured capital; (2) human capital; and (3) social or cultural capital (Fig. 1).
These four general types of capital are all required in complex combinations to produce any human benefits. Ecosystem services thus refer to the relative contribution of natural capital to the
Table 1
Classification of ecosystem services and functions used in: (Costanza et al., 1997).
# Ecosystem service* Ecosystem functions Examples
1 Gas regulation Regulation of atmospheric chemical composition CO2/O2balance, O3for UVB protection, and SOxlevels
2 Climate regulation Regulation of global temperature, precipitation, and other biologically mediated climatic processes at global or local levels
Green-house gas regulation, DMS production affecting cloud formation
3 Disturbance regulation
Capacitance, damping, and integrity of ecosystem response to environmental fluctuations
Storm protection, flood control, drought recovery, and other aspects of habitat response to environmental variability mainly controlled by vegetation structure
4 Water regulation Regulation of hydrological flows Provisioning of water for agricultural (e.g., irrigation) or industrial (e.g., milling) processes or transportation
5 Water supply Storage and retention of water Provisioning of water by watersheds, reservoirs, and aquifers 6 Erosion control
and sediment retention
Retention of soil within an ecosystem Prevention of loss of soil by wind, runoff, or other removal processes, storage of silt in lakes and wetlands
7 Soil formation Soil formation processes Weathering of rock and the accumulation of organic material 8 Nutrient cycling Storage, internal cycling, processing, and acquisition of
nutrients
Nitrogen fixation, N, P, and other elemental or nutrient cycles
9 Waste treatment Recovery of mobile nutrients and removal or breakdown of excess or xenic nutrients and compounds
Waste treatment, pollution control, detoxification
10 Pollination Movement of floral gametes Provisioning of pollinators for the reproduction of plant populations 11 Biological control Trophic-dynamic regulations of populations Keystone predator control of prey species, reduction of herbivory by top
predators
12 Refugia Habitat for resident and transient populations Nurseries, habitat for migratory species, regional habitats for locally harvested species, or over wintering grounds
13 Food production That portion of gross primary production extractable as food
Production of fish, game, crops, nuts, fruits by hunting, gathering, subsistence farming, or fishing
14 Raw materials That portion of gross primary production extractable as raw materials
The production of lumber, fuel, or fodder
15 Genetic resources Sources of unique biological materials and products Medicine, products for materials science, genes for resistance to plant pathogens and crop pests, ornamental species (pets and horticultural varieties of plants)
16 Recreation Providing opportunities for recreational activities Eco-tourism, sport fishing, and other outdoor recreational activities 17 Cultural Providing opportunities for non-commercial uses Aesthetic, artistic, educational, spiritual, and/or scientific values of
ecosystems
*We include ecosystem ‘‘goods” along with ecosystem services.
production of various human benefits, in interaction with the other forms of capital. These services do not simply flow to human well-being without these crucial interactions. As a consequence, under-standing, modelling, measuring, and managing ecosystem services requires a very transdisciplinary approach.
2.3. Do we need a cascade?
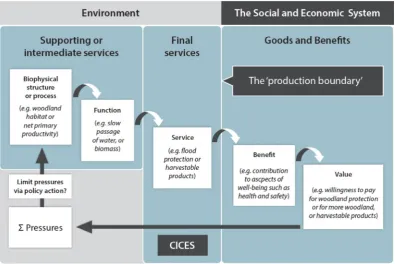
Some have argued (Potschin and Haines-Young, 2017) that there is a ‘cascade’ from ecosystem functions, to ecosystem ser-vices to benefits and then to value (Fig. 2). We think that this is at the same time an oversimplification of a complex reality and an unnecessary complication of what is essentially a very straight-forward definition as described above. Ecosystem services are
definedas the functions and processes of ecosystems that benefit humans, directly or indirectly, whether humans perceive those benefits or not. Given this definition, is there a difference between ecosystem services and benefits? Potschin and Haines-Young (2017)use this distinction: ‘The difference between a service and a benefit in the cascade model is that benefits are the things that people assign value to.’ Perhaps the distinction being sought here is betweenperceivedandunperceived(or poorly perceived) bene-fits. The cascade approach appears to follow conventional eco-nomic thinking, which limits its definition of value only to elements that people perceive to have direct benefits and are will-ing to pay for. However, we think that this is far too narrow a con-ceptualization of benefits and value, as we elaborate below. In addition, we highlight that the connections between ecosystem processes, functions, and benefits to humans are complex, non-linear, and dynamic. These complex connections are poorly repre-sented by a linear ‘cascade’, which assumes simple linkages and effects, as shown inFig. 2(see alsoCostanza, 2008).
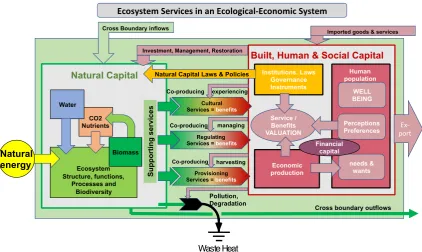
Fig. 3is a better representation, because it recognizes that ser-vices equal benefits (by definition) and that complex interactions and feedbacks are required among built, human, social, and natural capital in order to produce ecosystem services.
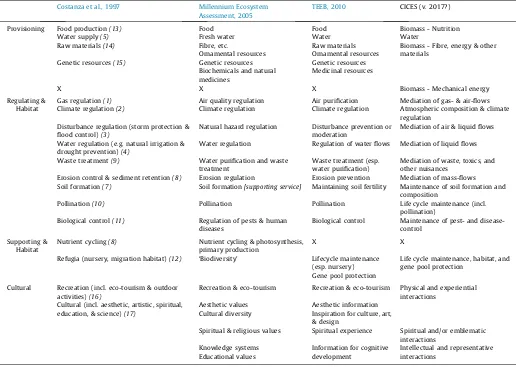
The following categorization of ecosystem services into four broad types was proposed by the Millennium Ecosystem Assessment (2005), adopted but changed in The Economics of Ecosystems and Biodiversity project (TEEB, 2010) and constitutes the core of most other recent classifications (see Table 2). Here we emphasize the interaction between natural, social, built, and human capital necessary to produce these services:
a)Provisioning services– ecosystem services that combine with built, human, and social capital to produce food, timber, fibre, or other ‘‘provisioning” benefits. For example, fish delivered to people as food require fishing boats (built cap-ital), fisher-folk (human capcap-ital), and fishing communities (social capital).
b)Regulating servicescombine with the other three capitals to produce flood control, storm protection, water regulation, human disease regulation, water purification, air quality maintenance, pollination, pest control, and climate control. For example, storm protection by coastal wetlands requires built infrastructure, people, and communities to be pro-tected. Regulating services, in general, are not well perceived by individuals.
c)Cultural services combine with built, human, and social capital to produce recreation, aesthetic, scientific, cultural identity, sense of place, or other ‘cultural’ benefits. For example, a recreational benefit requires a beautiful natural asset (a lake), in combination with built infrastructure (a road, trail, dock, etc.), human capital (people able to appreciate the lake experience), and social capital (family, friends and institutions that make the lake accessible and safe). Even ‘existence’ and other ‘non-use values’ require people (human capital) and their cultures (social and built capital) to appreciate.
This category of ecosystem services was the least developed one, when theMEA (2005)andTEEB (2010)were published. Since then, an avalanche of papers on cultural ecosystem
services, and associated cultural values, has been published. A diverging range of definitions, conceptual models and val-uation approaches, has been applied in a global spread of case studies. Convergence is not yet clearly visible. A sample that shows the diversity includes: general framework (Kai et al., 2012), Sweden and Indonesia (Tengberg et al., 2012), Germany (Bieling, 2014), Israel (Ghermandi et al., 2015), South Africa (Blignaut et al., 2016), Sweden (Blicharska et al., 2017), Denmark (Turner et al., 2014), and Hong Kong (Chen and Hua, 2017).
d)Supporting servicesdescribe the basic ecosystem processes such as soil formation, primary productivity, biogeochem-istry, nutrient cycling and provisioning of habitat. These ecosystem functions contributeindirectlyto human wellbe-ing by maintainwellbe-ing the processes and functions necessary for provisioning, regulating, and cultural services. The dis-tinction is crucial in some types of economic accounting as double counting might occur if this category is valued in addition to the category it is supporting. However, it is sometimes necessary to use supporting services as proxy measures for services that cannot be measured otherwise or as well. TEEB replaced this category withHabitat Services
or refugia service (as it was called in Costanza, 1997) to highlight the importance of ecosystems to provide habitat for migratory species (e.g., as nurseries) and gene-pool ‘‘tectors” (e.g., natural habitats allowing natural selection pro-cesses to maintain the vitality of the gene pool).
Ecosystems are multidimensional and the distinction between direct and indirect contributions to human wellbeing is complex and not completely understood. It is important to remember that ecosystem functions (like biodiversity and primary production) underlie all other services and are thus critical to the supply of all services. In fact, one approach to valuing ecosystem services uses net primary production (NPP) as a proxy measure, because NPP is the basis for many ecosystem functions and processes (Costanza et al., 1989; Costanza et al., 1998; Costanza, 2004). In
light of the direct vs. indirect distinction, NPP would be an indirect service used as an alternative proxy to measuring some direct ser-vices, not in addition to them.Costanza et al. (1997)included some NPP based value estimates in the synthesis for comparison with the total value estimates based on provisioning, regulating, and cultural services and found that they ‘showed fairly close agree-ment’ (pp. 258). After that,Costanza et al. (1998)plotted this rela-tionship and found good correlations for terrestrial and marine systems. This connection needs to be further explored, since NPP is relatively easy to measure with remote sensing over space and time: if it turned out to be a good proxy for some ecosystem ser-vices it could greatly simplify quantitative assessments.
3. Classification systems
To make the concept of natural capital and ecosystem services (ES) more specific, classification systems were needed to enable discussions, assessments, modelling, and valuation. What specific ecosystem functions or processes contribute to human wellbeing? Daily (1997)included a list of thirteen services while Costanza et al. (1997)included seventeen (Table 1).
Since then, various classifications have been developed for scientific analysis, economic valuation, and policymaking (Millennium Ecosystem Assessment (MEA), 2005); Haines-Young and Potschin, 2013; Landers and Nahlik, 2013; US Environmental Protection Agency, 2015) (seeTable 2).
The MEA, launched in 2001, was a predominantly ecological project under the United Nations Environmental Programme (UNEP) umbrella. After that, The Economics of Ecosystems and Bio-diversity project (TEEB), initiated by Germany and the European Commission and later adopted by UNEP, added more of the eco-nomic aspects of ecosystem services. The Common International Classification of Ecosystem Services (CICES) was developed to pro-vide a hierarchically consistent and science-based classification to be used for natural capital accounting purposes. The Final Ecosys-tem Goods and Services Classification SysEcosys-tem (FEGS) and National
Ecosystem Services Classification System (NESCS) classifications were developed by the U.S. Environmental Protection Agency to provide a classification system for final ecosystem services, that is generally similar to CICES.Table 2compares four of the main ecosystem services classification systems used worldwide and their differences and similarities. One can see fromTable 2that, while there are differences in the details, these classification sys-tems are broadly very similar and do not deviate significantly from the original list inTable 1and column 1 inTable 2.
4. To value or not to value: That isNOTthe question
Even without any subsequent valuation, the very process of list-ing all the services derived from an ecosystem can help ensure their recognition in public policy. This makes the analysis of eco-logical systems more transparent and can help inform decision-makers of the relative merits of different options. However, valua-tion is often useful, because many decisions involve trade-offs between ranges of things that affect human wellbeing differently. In these cases, we do not really have a choice.
The decisions we make as a society about ecosystems imply val-uations (although not necessarily expressed in monetary terms). We can choose to make these valuations explicit or not; we can do them with an explicit acknowledgement of the huge uncertain-ties involved or not; but as long as we are forced to make choices,
we are going through the process of valuation (Costanza et al., 1997, pp. 255).
In democratic decision processes, transparency is critical and explicit valuations of ecosystem services and their benefits have, therefore, been a topic of research that has attracted much atten-tion. Some have continued to argue that valuing ES and NC is inap-propriate and we should preserve and protect nature strictly ‘for its own sake’, for its ‘intrinsic value’ (Chee, 2004; McCauley, 2006). Our point is that this perspective is itself an implicit valuation. It is simply arguing that nature is more valuable than any possible alternative. While in many cases this may be true, society has made decisions that imply it is not always the case (Russell-Smith et al., 2015). Every time we build homes, schools, and hospi-tals, which are essential for human wellbeing, we appropriate ecosystems and impact our natural capital. Thus, being more expli-cit about the value of ES and NC can help society make better deci-sions in the many cases in which trade-offs exist (de Groot et al., 2010; Braat and de Groot, 2012).
If we agree that valuation is inevitable, then the question becomes: what kind of valuation is most appropriate? That’s where we turn now.
4.1. What is value anyway?
The Oxford Dictionary defines valuation as ‘an estimation of the worth of something.’ To estimate worth is a mental process that
Table 2
Comparison of four of the main ecosystem services classification systems used worldwide and their differences and similarities.
Costanza et al., 1997 Millennium Ecosystem Assessment, 2005
TEEB, 2010 CICES (v. 2017?)
Provisioning Food production(13) Food Food Biomass - Nutrition
Water supply(5) Fresh water Water Water
Raw materials(14) Fibre, etc. Raw materials Biomass - Fibre, energy & other materials
Ornamental resources Ornamental resources Genetic resources(15) Genetic resources Genetic resources
Biochemicals and natural medicines
Medicinal resources
X X X Biomass - Mechanical energy
Regulating & Habitat
Gas regulation(1) Air quality regulation Air purification Mediation of gas- & air-flows Climate regulation(2) Climate regulation Climate regulation Atmospheric composition & climate
regulation Disturbance regulation (storm protection &
flood control)(3)
Natural hazard regulation Disturbance prevention or moderation
Mediation of air & liquid flows
Water regulation (e.g. natural irrigation & drought prevention)(4)
Water regulation Regulation of water flows Mediation of liquid flows
Waste treatment(9) Water purification and waste treatment
Waste treatment (esp. water purification)
Mediation of waste, toxics, and other nuisances
Erosion control & sediment retention(8) Erosion regulation Erosion prevention Mediation of mass-flows Soil formation(7) Soil formation[supporting service] Maintaining soil fertility Maintenance of soil formation and
composition
Pollination(10) Pollination Pollination Life cycle maintenance (incl. pollination)
Biological control(11) Regulation of pests & human diseases
Biological control Maintenance of pest- and disease-control
Supporting & Habitat
Nutrient cycling(8) Nutrient cycling & photosynthesis, primary production
X X
Refugia (nursery, migration habitat)(12) ‘Biodiversity’ Lifecycle maintenance (esp. nursery)
Life cycle maintenance, habitat, and gene pool protection
Gene pool protection Cultural Recreation (incl. eco-tourism & outdoor
activities)(16)
Recreation & eco-tourism Recreation & eco-tourism Physical and experiential interactions
Cultural (incl. aesthetic, artistic, spiritual, education, & science)(17)
Aesthetic values Aesthetic information Cultural diversity Inspiration for culture, art,
& design
Spiritual & religious values Spiritual experience Spiritual and/or emblematic interactions
Knowledge systems Information for cognitive development
Intellectual and representative interactions
Educational values
a)Costanza et al. (1997)did not make a division into main categories; numbers (1–17) refer toTable 1
involves the assessment of situations, comparing it to some refer-ence value and making decisions on whether to act or refrain from action. All people, and many animals, do it all the time, mostly unconsciously, in view of so-called desirable ends (Farley, 2012). Most of the assigned values to goods, services, people, or cultural achievements have to do with the survival of humans as individu-als, many with the wellbeing of individuals and social groups, and some with the ethical considerations humans make about other people’s and other species’ rights to live. When major changes in ecosystems and ecosystem services are at stake with intended or expected change in wellbeing, for example, as a consequence of land use change or economic or environmental policy, then struc-tured and transparent valuations are appropriate, also in view of desirable ends, but at a societal rather than individual level and in the proper temporal and spatial contexts.
The term valuation is also used by people to express generic appreciation. For example, when museum visitors use the term ‘value’ in appreciating a painting, they generally do not intend to put a quantitative or monetary value on it. Similarly, people may use the term value for appreciating a nice landscape, while this does not reflect any intention to make a trade-off in terms of giving up some of their income to conserve that landscape. On the other hand, appreciation may be the first step in what is called an eco-nomic valuation, when options are traded off and decisions on allo-cation of other (often financial) resources are made (Braat et al., 2014).
Economic value is often defined in strict economic terms as aggregate willingness-to-pay for the stream of services or to accept compensation for their loss (e.g., from an ecosystem). Hence, the narrowly defined economic value of an ecosystem func-tion or service relates only to the contribufunc-tion it makes to ‘human welfare’, where human welfare is measured in terms of each indi-vidual’s own assessment of his or her wellbeing (Bockstael et al., 2000; Freeman, 2003).
We think that such a definition is far too narrow (Farber et al., 2002). As we have argued above, ES are the direct and indirect con-tributions to sustainable human wellbeing, which is more than the aggregate of individual, self-assessed welfare. This is true because sustainable human wellbeing also depends on the welfare of the community or society, and on the sustainability of the ecological life support system (i.e., natural capital). Also, individual humans do not adequately perceive all the things that contribute to their wellbeing (Fioramonti, 2014). For the interested reader, there is a large volume of critical discussions of the utilitarian willingness-to-pay model, which is reviewed inPascual et al. (2010). Another useful essay on this topic was provided by Parks and Gowdy (2013).
Costanza and Folke (1997)described three types of value for ES and NC, based on the three sub-goals for sustainable wellbeing first articulated byDaly (1992)as (1) sustainable scale; (2) fair distribu-tion; and (3) efficient allocation. Conventional economic ‘willing ness-to-pay” approaches are focused on the third of these goals using current individual preferences. But valuation with respect to the fairness and sustainability goals need very different approaches that are more in line with community or societal preferences and whole system sustainability issues (Table 3). In
addition, individual tastes and preferences are not fixed and given, as is usually assumed in conventional economic valuation (Norton et al., 1998), and individuals do not possess perfect information or appropriate processing abilities about the relationship between ES and their wellbeing, as is also assumed (Kahneman, 2011). There is therefore much additional work that needs to be done in valuing ES and NC, in individual, social, community, and group contexts. Conventional approaches can only get us part of the way.
Progress in this area is being made, often under the name of ‘integrated valuation’, and ‘participatory valuation’ where combinations of valuation methods are used to address the full set of values (Braat et al., 2014; Brown and Fagerholm, 2015; Jacobs et al., 2016;Kenter, 2016). The value of ES can be expressed in monetary units, time units, labour units or in relative terms using a variety of indicators (Fioramonti, 2014). These indicators can be used to prioritize and compare ecosystems and their services on the basis of their relative contribution to individual or social objectives. The indicators may include the number of people who benefit from these services, their preferences, the cost of gaining/keeping access to the service, and the availability and cost of substitutes.
Until recently, policy proposals such as road construction and land use change were formally evaluated based on a narrow finan-cial cost-benefit analysis only, in which the costs of development as well as the benefits recognized in the market were included. Informally, other values often played a role as well, but in most of these cost-benefit analyses, costs of loss and benefits of convation of nonmarket benefits, as most regulating ecosystems ser-vices produce, were ignored (Fioramonti, 2014).
New formal valuation approaches acknowledge the variety of individual and group dimensions on the valuator side and incorpo-rate the dynamics of natural capital and ecosystem services at mul-tiple geographical and temporal scales. This type of policy or project assessment generally includes identifying and mapping and modeling the properties and values of landscapes and ecosys-tems, eliciting social preferences, deliberative processes, ranking, and quantifying the potential benefits of the proposed policy. This so-called total system approach implies estimating the value of ecosystems and their services, including the causal mechanisms in the service-producing ecological systems and the contributions by human action to make potential services actual and in the appropriate spatial and temporal scales (Boumans et al., 2002; Gómez-Baggethun et al., 2010;Braat et al., 2014).
The understanding of the complexity of economic, cultural, and social values is increasingly (but still not generally) embedded in decision-making. The broader approach, which explicitly includes nonmarket values, mostly from regulating and cultural services, is now being elaborated in many places with the aim to integrate the objectives of ecological sustainability, social justice, and economic efficiency into the public and private decision-making process (Farley, 2012;Jacobs et al., 2016).
Most provisioning services refer to ‘private goods’. Most regulating services are ‘public goods’ and most cultural services consist of a mix of private and public goods. Public goods are non-excludable and multiple users can simultaneously benefit from using them. This creates circumstances where aggregating
Table 3
Valuation of ecosystem services based on the three primary goals of efficiency, fairness, and sustainability (Costanza and Folke, 1997).
Goal or Value Basis Who Votes Preference Basis Level of Discussion Required
Level of Scientific Input Required
Specific Methods
individual choices needs to be supplemented with other approaches. Some form of community or group choice process or modelling approach may be needed, as discussed above, leading to so called ‘‘shared values” (Kenter, 2016).
4.2. Conventional approaches to ES valuation
There are textbooks and useful reviews (Pascual et al., 2010) of conventional economic valuation approaches. In this section, we summarize the main characteristics of these approaches. In the conventional economic approach there are two main methods for estimating values: revealed and stated preferences. Both of these typically involve the use of sophisticated statistical methods to tease out the values (Haab and McConnell, 2002). Revealed prefer-ence methods involve analyzing individuals’ choices in real-world settings and inferring value from those observed choices. Examples of such methods include production-oriented valuation that focuses on changes in direct use values from products actually extracted from the environment (e.g., fish). This method may also be applicable to indirect use values, such as the erosion control benefits forests provide to agricultural production. Other revealed preference methods include replacement costs or hedonic or sha-dow pricing, which infer ecosystem service values from closely linked, parallel markets, like real estate. For example, urban forest ecosystems and wetlands may improve water quality, which may be (partially) captured in property values (Phaneuf et al., 2008). Valuation of ecosystem services in urban environments presents a powerful example of how the spatial interaction of human, nat-ural, built, and social capital can make very large contributions to human wellbeing. An assessment of the ecosystem service value of Central Park in New York City suggests the ‘revealed’ public good value of Central Park is roughly $70 million/hectare per year (Sutton and Anderson, 2016).
Stated preference methods rely on individuals’ responses to hypothetical scenarios involving ecosystem services and include contingent valuation and structured choice experiments (Fioramonti, 2014). Contingent valuation utilizes a highly struc-tured survey methodology that acquaints survey respondents with ecosystem improvements (e.g., better stream quality) and the ecosystem services they will generate (e.g., increased salmon stocks). Respondents are then asked to value ecosystem improve-ments usually using a referendum method (Boardman et al., 2006). Choice experiments, such as conjoint analysis, present respondents with scenarios that represent combinations of ecosys-tem services and monetary costs and asks for the most preferred combinations. Based on these choices, ecosystem service values are inferred (Ryffel et al., 2014; Chaikaew et al., 2017).
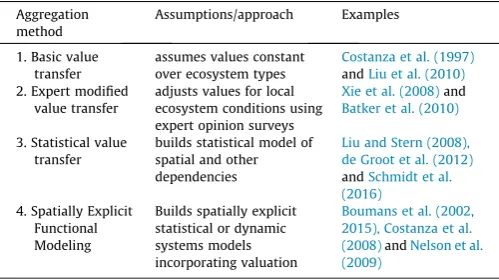
4.3. Aggregating values to larger scales
When ecosystem services research began in full swing, a major problem was to find empirical economic valuation data in various contexts and spatial scales. One approach is the ‘value transfer’ or ‘benefit transfer’ method, (Table 4, method 1) which transposes value estimates from one location to another, adjusting for differ-ences in ecological and economic contexts (Kubiszewski et al., 2013a). The ‘unit value’ method, based on this approach, adopts average values per unit area, aggregated over all valuation studies for a particular ecosystem.Costanza et al. (2014b)used such global average ‘unit values’, which were updated byde Groot et al. (2012) as part of the TEEB study.Xie et al. (2008)produced a similar set of unit values for China, based on expert knowledge of a large group of Chinese researchers (Table 4, method 2).
De Groot et al. (2012)present an analysis of global unit values from the database which was developed during the TEEB project. The paper estimated ecosystem service unit values of 10 main
biomes expressed in monetary units. In total, over 320 publications were screened covering over 300 case study locations. A selection of 665 value estimates were used for the analysis. Acknowledging the uncertainties and contextual nature of any valuation, the anal-ysis shows that the total value of ecosystem services is consider-able and ranges between 490 $/ha/year for the total bundle of ecosystem services that can potentially be provided by an ‘average’ hectare of open oceans to almost 350,000 $/ha/year for the poten-tial services of an ‘average’ hectare of coral reefs. More impor-tantly, their results show that most of this value is outside the market and best considered as non-tradable public benefits.
Building on this database,Schmidt et al. (2016), present global value transfer functions by using a meta-analytic framework for the synthesis of 194 case studies capturing 839 monetary values of ES (Table 4, method 3). For 12 ES the variance of monetary val-ues could be explained with a subset of 93 study- and site-specific variables by utilizing boosted regression trees. This provides a glo-bal quantification of uncertainties and transferability of monetary valuations. Their analysis represents a stepping stone to a stan-dardized integration of and reporting on uncertainties for benefit transfer as an important component for decision support.
The valuation of ecosystem services can have many potential uses, at multiple time and space scales. Confusion can arise, how-ever, if one is not clear about the distinctions between these uses and the appropriate valuation methods and level of precision required.Table 5lists some of the potential uses of ecosystem ser-vices valuation, ranging from simply raising awareness to detailed analysis of various policy choices and scenarios (Kubiszewski et al., 2013a). For example, the paper by Costanza et al. (1997) was clearly an awareness raising exercise with no specific policy or decision in mind. As its citation history verifies, it was very suc-cessful for this purpose. ES values can be useful for several of the other purposes listed in Table 5, and there have been thousands of subsequent studies addressing the full range of uses listed in Table 5.
For example, local decision processes with very specific ecolog-ical and social-economic contexts may require more dynamic, spa-tially explicit information and more community involvement in the valuation process (Hedden-Dunkhorst et al., 2015). No valua-tion technique is perfect, and one must balance the requirements of the analysis with the data and resources available, remembering that uncertainty will always be an issue.
4.4. Challenges for valuation
A key challenge in any valuation is imperfect information. Indi-viduals might, for example, place no value on an ecosystem service
Table 4
Four levels of ecosystem service value aggregation (Kubiszewski et al. 2013a).
Aggregation method
Assumptions/approach Examples
1. Basic value transfer
assumes values constant over ecosystem types
Costanza et al. (1997) andLiu et al. (2010) 2. Expert modified
value transfer
adjusts values for local ecosystem conditions using expert opinion surveys
Xie et al. (2008)and Batker et al. (2010)
3. Statistical value transfer
builds statistical model of spatial and other dependencies
Liu and Stern (2008), de Groot et al. (2012) andSchmidt et al. (2016)
4. Spatially Explicit Functional Modeling
Builds spatially explicit statistical or dynamic systems models incorporating valuation
if they do not know the role that the service is playing in affecting their wellbeing (Norton et al., 1998). Here is an analogy. If a tree falls in the forest and there is no one around to hear it, does it still make a sound? The answer to this old question obviously depends on how one defines ‘‘sound.” If ‘‘sound” is defined as the perception of sound waves by people, then the answer is No. If ‘‘sound” is defined as the pattern of physical energy in the air, then the answer is yes. In this second case, choices in both revealed and stated pref-erence models would not reflect the true benefit of ecosystem ser-vices. Another key challenge is accurately measuring the functioning of the system to correctly quantify the amount of a given service derived from that system (Boumans et al., 2002; Barbier et al., 2008; Koch et al., 2009).
But recognizing the importance of information does not obviate the limitations of human perception-centered valuation. As the tree analogy demonstrates, perceived value can be a quite limiting valuation criterion, because natural capital can provide positive contributions to human wellbeing which are either never (or only vaguely) perceived or may only manifest themselves at a future time. A broader notion of value allows a more comprehensive view of value and benefits, including, for example, valuation relative to alternative goals/ends, like fairness and sustainability as discussed above, within the broader goal of human wellbeing (Costanza and Folke, 1997;Costanza, 2000). Whether these values are perceived or not and how well or accurately they can be measured are sepa-rate (and important) questions.
In practice, decision-making often takes place at the local or regional level, and the valuation process needs to involve many stakeholders. Mixes of monetary and non-monetary, deliberative valuation processes are needed to provide sustainable outcomes (Kenter et al., 2016). In these decision processes, resilience, uncer-tainty, and risk of provision of ecosystem services are beginning to get attention as well (Kubiszewski et al., 2013c;Hamel and Bryant, 2017). We recognise that social power relations affect the way trade-offs are imposed in society, and thus the way values for ecosystem services become institutionalized (Berbés-Blázquez et al., 2016).
5. Research, applications, and policy since 1997
5.1. Research
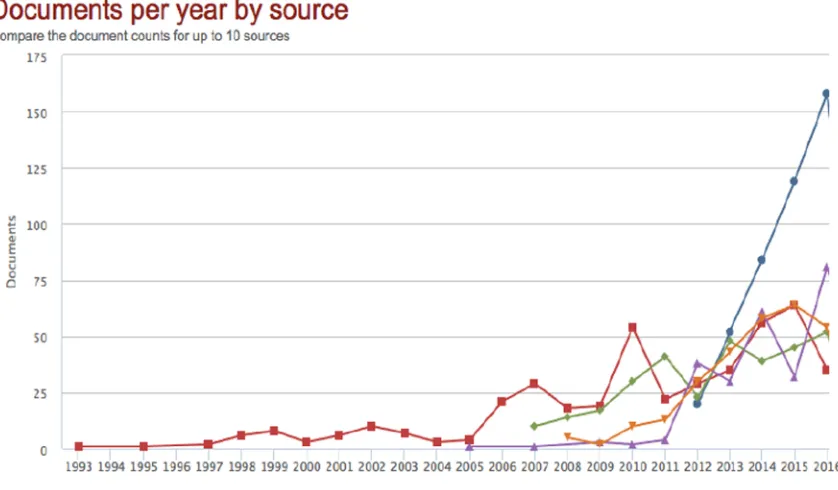
Since 1997, a great many academic research papers have been published on ecosystems services (Costanza and Kubiszewski, 2012). A search of SCOPUS in April, 2017 showed a total of over 17,000 papers published with the term ‘‘ecosystem services” in the title, abstract or keywords – over 2,800 in 2016 alone. In 2012, the journalEcosystem Serviceswas launched by Elsevier.
Since its launch,Ecosystem Serviceshas published 405 research, review, and commentary papers, making it the largest single venue for papers on ecosystem services, followed closely by Ecological Economics (Fig. 4). Valuation is the single largest category of papers, being the main topic in 118 papers (29%) (Braat, 2017). The geographical range in the Journal publications is wide, with 110 papers addressing case studies in Europe, 54 in Asia (including Middle East), 35 in North America, 47 in Latin America, 26 in Africa, 16 in Australia, New Zealand, and Fiji, and 1 in Antarctica. Another 29 studies addressed cases at global scale or multiple countries. A total of 324 of the 405 papers deal with case studies.
The papers cover a wide range of ecosystems: marine (including beach, coral reef, seagrass meadow, mangrove, coastal) (54), forest (42), freshwater (including rivers, lakes and watersheds) (32), wet-lands (including peat wet-lands) (16), urban (29), agro-(forest) ecosystems (33), multiple ecosystems (71), mountains (13), and 1 case in drylands, soils and quarries. Not all the papers address deal with the ecosystems that produce the services so the total here is 293.
5.2. Integrated modelling
Integrated, dynamic, spatially explicit computer modelling is increasingly being used as a tool to address the complexity of interactions that lead to ecosystem services production (Higgins et al., 1997; Boumans et al., 2002; Costanza and Voinov, 2003; Bagstad et al., 2013; Boumans et al., 2015; Turner et al., 2016). One advantage of this approach is that it can potentially incorpo-rate both perceived and non-perceived benefits in a dynamic way that allows for the evaluation of a range of policy scenarios.
One interesting recent example that provides an indication of the complexity and scale of what can be developed is a model of the ancient Maya civilization (Heckbert et al., 2014). This model was developed as part of an NCEAS participatory working group. The MayaSim model describes how anthropogenic and biophysical processes changed over time and space over a 600 year time period in the Yucatan peninsula. The model is a spatially explicit, hybrid, process-based, network, and agent-based model implemented in NetLogo. MayaSim depicts individual settlements as ‘agents’ located in a landscape represented as a grid of cells. Settlement agents manage agriculture and forest harvesting over a set of local cells, and establish trade with neighbours, allowing trade networks to emerge. Agents, cells, and networks represent elements of the historical Maya civilisation, including demographics, trade, agriculture, soil degradation, provisioning of ecosystem services, climate variability, hydrology, primary productivity, and forest succession. Simulating these in combination allows patterns to emerge at the landscape level, effectively growing the
Table 5
Range of Uses for Ecosystem Service Valuation (Costanza et al., 2014b).
Use of Valuation Appropriate values Appropriate spatial scales Precision Needed Raising Awareness and
interest
Total values, macro aggregates Regional to global low
National Income and Wellbeing Accounts
Total values by sector and macro aggregates National medium
Specific Policy Analyses Changes by policy Multiple depending on policy medium to high Urban and Regional Land Use
Planning
Changes by land use scenario Regional low to
medium Payment for Ecosystem
Services
Changes by actions due to payment Multiple depending on system medium to high Full Cost Accounting Total values by business, product, or activity and changes by
business, product, or activity
Regional to global, given the scale of international corporations
social-ecological system from the bottom up. The MayaSim model was able to reproduce spatial patterns and timelines mimicking what we know about ancient Maya history, such as the general location of important capital cities, the maximum overall popula-tion, and eventual collapse. Importantly, it modelled the interac-tion of natural capital and ecosystem services with climate, economic production, trade, human population, and overall well-being. The model was also used to see what interventions might have allowed the Maya to avoid collapse.
In addition, integrated models can potentially become the basis for computer games that can engage players in decisions that can be the basis for understanding and valuation (Costanza et al., 2014a). Since the integrated models can embed the trade-offs between, for example, better ecosystem services and more popula-tion and urban land use, the choices the players make will reflect how they value these trade-offs, in a dynamic way that will depend on initial conditions, and, in some games, interactions among play-ers. This is like a conventional choice experiment (Wilson and Carpenter, 1999; Colombo et al., 2013), except that it allows the players to create their own scenarios, rather than presenting them with a fixed set. It also allows preferences to emerge as a result of learning about the system by playing it and though interactions with other players. By playing the game, they are also becoming informed about the trade-offs in a much more tangible way than simply being told about them. The system thus connects the best of choice experiments, social interaction, and dynamic modelling. By recording each player’s behaviour in the system, one can also build computer agents that behave more like real people.
5.3. Main institutions and programmes
There are several intuitional initiatives and large-scale projects around ecosystem services and natural capital that have developed since 1997.Table 6presents some of the more well know exam-ples, but recognizes that this is far from a comprehensive list.
Intergovernmental Science-Policy Platform on Biodiversity and Ecosystem Services (IPBES) is currently the largest global effort in
establishing a synthesis of ecosystem services and biodiversity knowledge (see above intable 5). IPBES redefines ecosystem ser-vices as nature’s contributions to people. It presents the valuation approach as stressing ‘‘pluralism” (Pascual et al., 2017). The ele-ments of this pluralistic valuation approach are biophysical, social-cultural, economic, health, and holistic valuations integrated into policies based on shared responsibilities. It is too early to eval-uate the effectiveness of the approach and the acceptance by policy-makers, but initial results are presented by Jacobs et al. (2017), who call this approach ‘‘integrated valuation” (see also Table 3).
6. Institutional evolution and governance innovations
Given that pervasive uncertainty always exists in ecosystem service measurement, monitoring, modelling, valuation, and man-agement, we should continuously gather and integrate appropriate information regarding ES, with the goal of learning, adapting and better inform policy. To do this we should constantly evaluate the impacts of existing systems and design new systems with stakeholder participation as experiments from which we can more effectively quantify performance and learn ways to manage such complex systems.
6.1. Property rights
Given the public goods nature of most ecosystem services, we need institutions that can effectively deal with this characteristic using a sophisticated suite of property rights regimes. We need institutions that employ an appropriate combination of private, state, and common property rights systems to establish clear prop-erty rights over ecosystems without privatizing them.
Systems of payment for ecosystem services (PES) and common asset trusts can be effective elements in these institutions (Sattler and Matzdorf, 2013). PES is defined as payments to land owners or managers to provide or protect ecosystem services (PES is the main topic in 49 papers inEcosystem Servicesfrom 2012 to 2016, out of a
total of out of 414). When a resource is non-rival, excludable pri-vate property rights are inappropriate, but lack of property rights eliminates private sector incentives to provide the resource (Kubiszewski et al., 2010). One solution is common investment and common use. Common asset trusts (CATs) are one institution that can assign property rights to the commons on behalf of the community, using trustees as protectors of the asset (Barnes et al., 2008; Farley et al., 2015). The CAT can charge for damages to the common asset and invest in the provision of non-rival ecosystem services and in green technologies that help provide and protect the asset. Everyone would be free to use the non-rival ecosystem services, but not to degrade the ecosystem struc-ture that sustains them. Resources for investing in non-rival resources can be obtained from auctioning off access to rival resources. For example, society could auction off the right to green-house gas absorption capacity and then invest the revenue in carbon-free energy technologies.
6.2. Scale and distribution
The spatial and temporal scale of the institutions to manage ecosystem services must be matched with the scales of the services themselves. Mutually reinforcing institutions at local, regional and global scales over short, medium and long time scales will be required. Institutions should be designed to ensure the flow of information across scales, to take ownership regimes, cultures, and actors into account, and to fully internalize costs and benefits.
Systems should be designed to ensure inclusion of the poor, since they are generally more dependent on common property assets like ecosystem services and the loss of these services may be critical to their survival. Wealthier individuals may be able to afford alternatives to some services, at least to a point. Free-riding, especially by wealthier segments of society, should be deterred and beneficiaries should pay for the services they receive from bio-diverse and productive ecosystems.
Relevant stakeholders (local, regional, national, and global) should be engaged in the formulation and implementation of man-agement decisions. Full stakeholder awareness and participation not only improves ES analyses, but contributes to credible, accepted rules that identify and assign the corresponding respon-sibilities appropriately, and that can be effectively enforced.
6.3. Information and evidence-based policy
One key limiting factor in sustaining natural capital is lack of knowledge of how ecosystems function and how they support human wellbeing. This can be overcome with targeted educational campaigns that are tailored to disseminate success and failures to both the general public and elected officials and through true col-laboration among public, private and government entities. ES con-cepts can be an effective link between science and policy by making the trade-offs more transparent. An ES framework can therefore be a beneficial addition to policy-making institutions and frameworks and to integrating science and policy.
Table 6
A subset of institutions and programmes leading ES research and practice.
Programs/Institutions Description Website
Millennium Ecosystem Assessment (MEA)
The MEA was a 4-year, 1300 scientist study commissioned by the United Nations in 2005. The report analysed the state of the world’s ecosystems and provided recommendations for policymakers (MEA, 2005)). It determined that human actions have depleted the world’s natural capital to the point that the ability of a majority of the globe’s ecosystems to sustain future generations can no longer be taken for granted
www.millenniumassessment.org
The Economics of Ecosystems and Biodiversity (TEEB)
In 2008, the first report of a second international study was published on The Economics of Ecosystems and Biodiversity (TEEB, 2008), hosted by United Nations Environment Programme (UNEP). The TEEB’s primary purpose was to draw attention to the global economic benefits of biodiversity, to highlight the growing costs of biodiversity loss and ecosystem degradation, and to draw together expertise from the fields of science, economics, and policy to enable practical actions moving forward. The TEEB report was picked up extensively by the mass media, bringing ecosystem services to a broad audience.
teebweb.org
Ecosystem Services Partnership
The Ecosystem Services Partnership was created in 2008, inspired by the MEA and TEEB projects and has since grown to become the biggest international member-based network focused on facilitating ecosystem services research and practical applications. The network connects over 3000 ecosystem services professionals from science, policy and practice worldwide (including over 50 member-organizations) who are working together in 37 working groups, 10 regional chapters and 40+ national networks on all continents
www.es-partnership.org
IPBES The Intergovernmental Science-Policy Platform on Biodiversity and Ecosystem Services is an intergovernmental body which provides information on the state of biodiversity and ecosystem services for decision making purposes. It was established in 2012 and current membership includes 126 countries. It is placed under the auspices of four United Nations entities: UNEP, UNESCO, FAO and UNDP
www.ipbes.net
EU Biodiversity Strategy to 2020
The European Union Strategy to 2020 includes the concept of ‘‘ecosystem services”, with strategic targets and actions. It includes the proposal to map and assess the state of the ecosystems, their services and economic values with the goal of incorporating these values into and accounting and reporting systems at EU and national level by 2010
ec.europa.eu/ environment/nature/ biodiversity/strategy/
WAVES The Wealth Accounting and Valuation of Ecosystem Services is a World Bank-led global partnership that aims to promote sustainable development by promoting planning and national environmental and wealth accounting
www.wavespartnership.org
Natural Capital Project (NatCap)
The Natural Capital Project is a partnership between the Stanford University, University of Minnesota, The Nature Conservancy, and the World Wildlife Fund with the goal of integrating the value of ecosystem services into decision making. The NatCap has developed open-sources tools, such as the Integrated Valuation of Ecosystem Services and Tradeoffs (InVEST) which models the ecosystem services values and uses
www.naturalcapitalproject.org/
Natural Capital Coalition (NCC) The NCC was created in 2014 and it is a global multi stakeholder organization with the goal of supporting the business community to incorporate ecosystem services and their values into their operations. The recently published the Natural Capital Protocol, a framework designed to support businesses managers decision related to their impact on the environment
7. Lessons learned
Ecosystem services have entered not only the public media (Schwartz, 2010) but also into business. A few years ago, Dow Chemical established a $10 million collaboration with The Nature Conservatory (TNC) to tally up the ecosystem costs and benefits of every business decision (Walsh, 2011; Molnar and Kubiszewski, 2012). Such collaboration will provide a significant addition to ecosystem services valuation knowledge and techniques.
Another example is TruCost, a company based in the United Kingdom, that values the impact that publicly owned corporations have on natural capital and ecosystem services (Trucost, 2013). It has had a tremendous impact on how the private sector perceives its impact on the environment.
However, there is significant research still required. Our scien-tific institutions can help lead this process through transdisci-plinary graduate education.
7.1. Integrated measurement, modelling, valuation, and decision support
While the conceptsof natural capital and ecosystem services have been broadly accepted and their potential contribution to
bet-ter environmental management widely acknowledged
(Millennium Ecosystem Assessment (MEA), 2005); TEEB, 2010; UK National Ecosystem Assessment, 2011), practical applications are still limited. Limiting factors include: (1) inconsistent approaches to ecosystem service modelling, assessment and valu-ation; (2) the expense of applying sophisticated enough methods to adequately answer the questions; (3) the lack of appropriate institutional frameworks; and (4) mistrust or misunderstanding of the science. The scientific community needs to continue to develop better methods to measure, monitor, map, model, value, and manage ecosystem services at multiple scales. It also needs to more effectively communicate the concepts and results to the public.
Ideally, these efforts should take place using transdisciplinary teams and strategies and in close collaboration with ecosystem stakeholders. Moreover, this information must be provided to deci-sion makers in an appropriate, transparent, and viable way, to clearly identify differences in outcomes among policy choices. At the same time, we cannot wait for high levels of certainty and pre-cision to act when confronting significant irreversible and catas-trophic consequences. We must synergistically continue to improve the measurements with evolving institutions and approaches that can effectively utilize these measurements. Below we report the key challenges.
7.1.1. Trade-offs
Ecological conflicts arise from two sources: (1) scarcity and restrictions in the amount of ES that can be provided and (2) the distribution of the costs and benefits of the provisioning of the ES. ES science makes trade-offs explicit and, thus, facilitates man-agement and planning discourse. It enables stakeholders to make sound value judgments. ES science thus generates relevant social-ecological knowledge for stakeholders and policy decision makers and sets of planning options that can help resolve social-political conflicts.
7.1.2. Accounting and assessment
Accounting attempts to look at the flow of materials, energy and information with relative objectivity. This can be denominated in biophysical or monetary units. Assessment evaluates a system or process with a goal in mind and is more normative. Both are
integrating frameworks with distinctive roles. Both ecosystem ser-vice accounting and assessment need to be developed and pursued using a broader social-ecological lens. Within the broader lens we also need to balance expert and local knowledge across scales.
7.1.3. Modelling and scenario planning
We need modelling to synthesize and quantify our understand-ing of ES and to understand dynamic, non-linear, spatially explicit trade-offs as part of the larger social-ecological systems (Fioramonti, 2017b). Stakeholders should be active collaborators in this model development process to assure relevancy. These models can incorporate and aid accounting and assessment exer-cises and link directly with the policy process at multiple time and space scales. In particular, modelling can quantify potential shifts in ES under different environmental and social-economic scenarios (Kubiszewski et al., 2017).
7.1.4. Bundling
Most ES are produced as joint products (or bundles) from intact ecosystems. The relative rates of production of each service vary from system-to-system, site-to-site, and time-to-time. We must consider the full range of services and the characteristics of their bundling in order to prevent creating dysfunctional incentives and to maximize the net benefits to society. For example, focusing only on the carbon sequestration service of ecosystems may in some instances reduce the overall value of the full range of ES.
7.1.5. Scaling
ES are relevant over a broad range of scales in space, time, gov-ernance and complexity, including the legacy of past behaviour. We need measurement, models, accounts, assessments and policy discussions that address these multiple scales, as well as interac-tions, feedbacks, and hierarchies among them.
8. Conclusion: A new economic paradigm that puts ‘nature’ at the core
Ecosystem services have come a long way in the twenty years since 1997. The idea has become an effective bridge between eco-logical and economic approaches. It is helping to create a more transdisciplinary ecological economics that is better able to under-stand and manage our complex, interconnected system in the Anthropocene. But we still have a long way to go, especially since policy debates in most countries are still dominated by narrow, mainstream economic ideas and policies.
The critical importance of ecosystem services challenges the conventional approach to growth and development, while paving the way for a different approach to prosperity based on wellbeing (Fioramonti, 2017a). Despite progress in a number of areas, ecosys-tem services will remain marginal in the larger debate until the current production and asset boundaries are re-defined to include natural and social capital.