Visualization Tools Integrated in Multivariate
Calculus Instruction and Their Impact on the
Quality of Students’ Knowledge
Igor Dimovski
#1, Mirjana Trompeska
#2, Dijana Cvetkoska
#3, Filip Kochoski
#4#1234Institute for Advanced Composites and Robotics
Krusevski pat bb, Prilep, Macedonia
Abstract —This paper presents a comprehensive pedagogical research related to mathematics instruction at the tertiary, university-level. Developed educational materials in electronic format, using the Matlab software package are integrated into instruction. The impact of using ICT on the essential knowledge related to the multivariate calculus, intensive use of 3D static and dynamic visualization tools has been statistically investigated. Some of students (experimental group) involved in the research study have individually created Matlab programs. Part of the research study is focused on the potential impacts of programming skills on learning mathematical concepts.
Keywords — functions, multivariate calculus, 3D visualization, impact, mathematical knowledge.
I. INTRODUCTION
In the modern didactic of mathematics, visualization methods are almost always highlighted as the most important principle in the mathematics instruction at all levels of education, especially when it comes to studying the functions. Application of Information and Communications Technologies (ICT) in modern mathematics instruction is the subject of most of the works in this field in last decade.
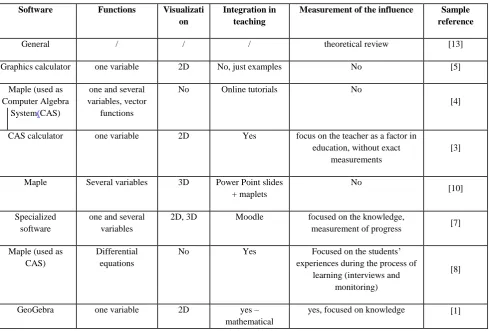
TABLE I Sample References - the Way Contemporary Authors Treat the Problem
Software Functions Visualizati on
Integration in teaching
Measurement of the influence Sample reference
General / / / theoretical review [13]
Graphics calculator one variable 2D No, just examples No [5]
Maple (used as Computer Algebra
System(CAS)
one and several variables, vector
functions
No Online tutorials No
[4]
CAS calculator one variable 2D Yes focus on the teacher as a factor in education, without exact
measurements
[3]
Maple Several variables 3D Power Point slides + maplets
No
[10]
Specialized software
one and several variables
2D, 3D Moodle focused on the knowledge,
measurement of progress [7]
Maple (used as CAS)
Differential equations
No Yes Focused on the students’
experiences during the process of learning (interviews and
monitoring)
[8]
GeoGebra one variable 2D yes –
mathematical
experimentation
Matematica, Maple Several variables 3D CD No [2]
Matlab Several
variables,vector functions
2D, 3D Demonstration and examples
on student's response
[11]
Contemporary authors are mainly engaged in developing some specific techniques of application of ICT in order to achieve certain, specific learning objectives. The papers are mostly related to the examples and no clear concept of how to integrate software solutions effectively in the educational process. "Offeringteachers examples of innovation is not enough, teachers need didactical knowledge about the use of technology", [6]. There are a number of papers relating to the question of how to use a particular program or software package in the study of functions [9]. Most of them deal with the functions of one variable and developing visualization techniques that geometrically refer to the 2D mathematics. Table I gives a detailed review of how the authors treat the problem.
Issues such as how to use ICT to develop visualization tools related to the 3D mathematics, how to integrate visualizationmethods in teaching multivariate calculus and in particular what is the impact of applying these methods on the quality of student learning lacks a comprehensive approach.This was the motivation to design a research study that will give exact answers to these questions.
II. DESCRIPTION OF THE RESEARCH STUDY
A. Main Aim of the Research Study and Expected Results
Determining the degree of impact of visualization methods, based on the theoretical foundations of didactic of mathematics and integrated approach of the application of ICT in teaching mathematics the quality of students’ knowledge that refer to multivariate calculus.
Determining the degree of impact of developing a programming codes for solving mathematical problems by visualization.
Objectives:
Creating educational materials in electronic form which enables students to study functions and their features by interactive computer-aided tools, integrated into the e-learning management system (ELMS); Creating instruments that can measure the impact of application of visualization methods on the quality of essential knowledge;
Developing strategy that can measure the impact of developing programming codes for solving mathematical problems. Expected results of the research studyare to confirm the assumption that the visualization method based on the theoretical foundations of didactic of mathematics and integrated approach to the application of ICT in teaching mathematics, have a significant impact on the quality of knowledge and that developing a programming codes have even more significant impact on the quality of knowledge.
B. Groups of Students
We used methodology that will separate group of students, set them in a specific educational situation, secluded from other students and analyze the differences in the quality of knowledge in both groups. This group, for the purpose of this research study is called the experimental group of students.
Analyzing the success of the already formed experimental group, we have decided to form a control group with a similar distribution of results of the course of Mathematics 1.This way, we got a control group composed of 18 students.
TABLE III Distribution of Students of Both Groups According to Grades in Mathematics 1.
Grade
Number of students of the experimental
group
Number of students of the control group
10 1 2
9 3 3
8 1 0
7 3 3
6 5 5
5 5 5
This way, 36 students were selected whose work was monitored and traced throughout the course. All 36 students in the previous academic year have learned the topics of the course Mathematics 1 in a traditional way, without implementation of ICT tools that can help students to visualize the main concepts of the course. The students distribution in both groups, according to their success in the course Mathematics 1 is shown in Table II.
Since the research study is designed to integrate part of the educational materials into the teaching process itself, with all students, the analyzes of the impact of ICT on the quality of knowledge related to the functions can be performed in two levels:
To measure how the use of ICT influenced all of the students - members of both groups and compare the results after completion of the course Mathematics 2, with the results before implementation of the innovated instruction. More specifically, the results obtained by the instrument "Diagnostic test" will be compared with the results obtained by the instrument "Re-test", focusing on selected elements that might be
considered essential knowledge related to functions.
To compare the results achieved in experimental group with the results achieved in the control group, by which the impact of creating Matlab program for visualization of three-dimensional mathematical situation in the quality of knowledge-related functions will be measured.
C. Diagnostic Testing
The main objective of the diagnostic testing is to obtain relevant information about the student's prior knowledge, in order to perform a comparative analysis later with the knowledge they have gained during the research study. Since part of the instruction referred to in this research study is associated with the multivariate calculus, pre-knowledge here refers to functions of one variable and 2D analytic geometry. Major part of the content covered by this research study may be understood by analogy of the functions of one variable and 2D analytic geometry therefore, comparative analysis refers to comparing the results in this field with the results of the analog area.
Diagnostic test is designed so that it can measure students' knowledge related to the following 5 categories:
1.Limit of function at a given point and continuity of real functions of one real variable;
2.Graph and functions’ properties of one variable;
3.Differentiability, derivative of the function of one real variable and the geometric interpretation of derivative;
4.Definite integral;
5.Two-dimensional analytic geometry - curves of the second order.
Here is an example of question from this test, categories 1 and 2:
Question 6. The function
4 16 )
( 2
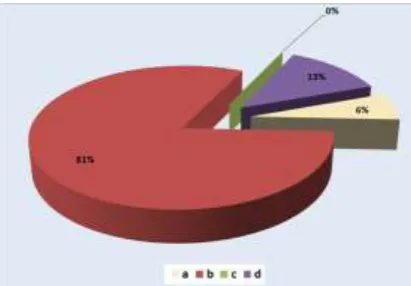
a.has vertical asymptote x = 4 b.has vertical asymptote x = -4 c. has two vertical asymptotes x = ±4 d. has not vertical asymptote
The answers given by the students to this question 6 are shown in Fig. 1. Later will be shown the analog question from re-test and obtained results could be compared.
This diagnostic test was takenby 33 students in total from both groups and both of them reached an average result of 39.2%.
One student from the experimental group was absent, so the experimental group of 17 students took the diagnostic test. The average result of the experimental group was 40.3%.
Two students from the control group were absent, so the control group of 16 students took the diagnostic test. The average result of the control group was 38.1%.
By comparing the students’ results in the experimental group with those in the control group, it can be concluded that the groups are formed equally, according to the criteria of knowledge. The difference of 2.2% can be considered statistically insignificant.
Fig. 1Results for question 6
D. Educational Materials and the Educational Process
Creation of educational materials practically began back in the pre-research and lasted almost until the end of the research study. During the Matlab seminar a number of program codes were produced which were demonstrated to the
participants of the seminar, while analyzing the commands that are most needed to create simple program codes by which mathematical concepts can be efficiently learned.
Major part of the educational materials was created in the period between 15th March to 15th May 2010, that is parallel to the period of instruction. This means that by producing these materials we were finding ways to integrate them in the process of teaching. We have published the products and made them available to all students as part of the multimedia presentation that was used during classes, and the program codes were eventually shared and analyzed only with the students of the experimental group.
Phase of instruction is the central phase of this research study and it lasted the longest. What was really happening in the classrooms was actually a generator of change that we expect. Innovation in instruction consists in that traditional teaching was performed by using a chalk and _board enriched by applying ICT, specifically by the integration of multimedia tools created in the process of teaching.
The essential feature of the innovated approach is that we have developed didactic system of mathematical tasks for each of the selected topics, so that for each task an adequate visualization was prepared - graphics or animation created in Matlab. Details can be seen in [12]. This means that instead of the generalized drawings that in traditional teaching represent the abstract situation very roughly, here, the graphics or the animation are specially designed to present a concrete mathematical situation to which the corresponding task refers to. Even more, whenever it was possible, the discussion of type ―what if some parameters would be changed?‖ was developed and interactive Matlab programs that were employed to see what would really happen.
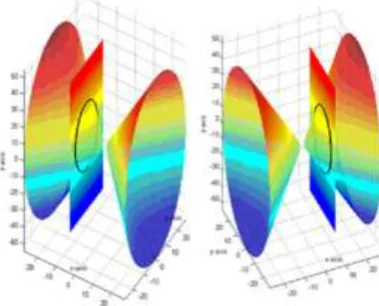
Figure 2 shows example how the problem of intersection of the hyperboloid 1
4 2 2
2 z
y x
and the plane x = d, could be visualized, for different values of the parameter d (10, and -10).
systematically organized and systematized into six sections. For 107 of these tasks, we used multimedia tools - graphics and animation made in Matlab.
Fig. 2Example of Matlab graphics used interactively in specific mathematical situation
In any situation where it was possible, the dynamic nature of a particular problem or a mathematical situation was visualized by corresponding animation.
This innovative approach was implemented in the teaching followed by all students, so the student of both groups, experimental and control, were in a position to gain essential knowledge of multivariate calculus in a dramatically different way from the instruction organized in the previous semester.
E. Project-based Learning
Fundamentally different situation in which the experimental group members were put in is their participation in the specific form of project-basedlearning. These students as a part of the subject Mathematics 2, were to follow the events in the ELMS and by using publishededucational materials were to create interactive educational materials - Matlab programs according to a set of mathematical assignments in a given field.
The strongest and the most effective techniques that can lead students to higher cognitive levels are based on his encouragement to create, i.e. they should be put in a position to do something on their own. Therefore, the goal of the project is set to seek from the students to create interactive programs in Matlab which visualizes certain mathematical situations.
In the end of March 2010, Dokeos platform was set to the server, an e-learning course, Visualized Math was created, the course parameters were set and the experimental group members were entered. The e-course was of strictly close type. The learning path according to sharable content object reference model (SCORM) standard was organized. A lot of learning materials were published and available only to the members of the experimental group. The main part of each learning path was a set of video files for visualization of explained mathematical concepts. The video material of total length of over 38 minutes is produced for this purpose.
Fig. 3Example of a learning object as a part of a learning path
Special terms for the consultation were organized with the members of the experimental group. In these terms teaching was not performed, but the students were exchanging opinions with each other while we were only directing them how to mathematically treat their problem and which Matlab tools to use to achieve the ultimate goal. This way the experimental group was physically separated from the control group, working on three representative assignments.
After the release of the tasks, all members of the experimental group were given the Matlab codesthat were used to visualize exercises in regular teaching. This way, students were directed to focus on the mathematical treatment of the problem because the commands and functions they were to use afterwards as well as the method of organizing Matlab code would be easier to perceive after the analysis of the supplied code.
The values of both parameters are obtained automatically by the ELMS.
15 students have sent their solutions which is 83% of the members of the experimental group. The most relevant conclusions about the influence of this form of teaching and use of ICT in learning mathematics can be derived by analyzing the students’ achieved results after the completion of the research study and their essential knowledge about multivariate calculus.
F. Re-testing
An instrument which we called the re-test was designed.It is very similarto what was designed as a diagnostic test and is fully adapted to measure the student's change of essential knowledge that arose during the research study.
Re-test is designed to measure students’ knowledge that refers to the following 5 categories:
1.r. Limitof the functions of two real variables at a given point and continuity of the functions of two real variables;
2.r. Domain, rank and graphs of functions of two real variables;
3.r. Differentiability, tangent line of curve and the tangent plane of 3D surface;
4.r. Double integral, volume;
5.r. 3D analytic geometry - lines, planes and surfaces of second order.
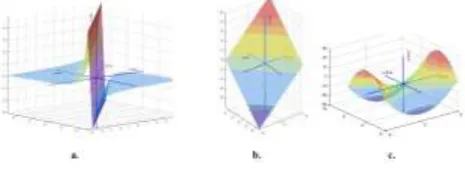
Analog question to question 6 from diagnostic test was included in the re-test:
Question 6r: Let
y x y x
y x y x
y x y x f
,
, )
, (
2 2
.
Which of the pictures below shows the graph of the function f(x,y) ?
Fig. 4Visualized answer of question 6r
Fig. 5Results for question 6r
Answers of this question 6r that were given by the students in both groups are shown in Fig. 5. In total 33 students of both groups were taking the "re-test" and reached an average result of 58.8%.
17 students of the experimental group were taking the "re-test". One student of this group was absent. The average result of the experimental group was 60.3%.
16 students of the control group were taking the "re-test". Two students of this group were absent. The average result of the experimental group was 57,2%.
The main goal of re-testing is achieved by collecting enough data to create high-quality comparative analysis of the essential knowledge before and after the research study. Of 36 students in total of both groups, three were absent on the diagnostic test or re-test, so group of total 30 students is a basis of the comparison.
III.RESULTS
A. Sample Description
B. Comparison of the Results of Diagnostic Test and Re-test
The average result of the observed 30 students in the diagnostic test was 41.0% with a standard deviation of 14.8. The average score of the same 30 students in the re-test was 64.8% with a standard deviation of 14.4. The obvious difference between the results in favor of the re-test, was statistically verified by the statistical t-test for equality of mathematical expectations.
The result was also verified by Mann-Whitney U-test.
Statistically valid conclusion can be drawn with the probability of 99% and that is the students’ results after performing this kind of innovated instruction, are much better than their results of the analog content gained by traditional instruction.
By this statistical test was shown that by using this type of educational materials created by using ICT, specifically educational materials created in Matlab and their integration in the classroom, a significant impact on the quality of knowledge-related to functions is achieved. This practically confirms the expectation of this research study, the visualization methods based on theoretical foundations of didactic of mathematics and integrated approach to applications of information and communication technology in mathematics instruction, have a significant influence on the quality of knowledge. This test showed that there is significant impact of ICT application on the quality of essential students' knowledge related to functions.
C. Results by Categories of Questions
One of the crucial features of innovated instruction is elaboration of the course content through analogy. Therefore, the results of each category can be analyzed by analogy and the results of analogous categories can be compared. In this sense, the results of each category can be extracted and by calculating the difference between the corresponding results, for instance, category 1.r. and category 1, it can be considered that such information is about the progress of knowledge concerning the limit of the function and the concept of continuity of functions, that
appropriate student has achieved during the research study.
Taking into consideration that both tests contain questions of category 1 and 2 (1.r. and 2.r.) between which there is an analogy again, one can get 6 sets of statistics sequences related to the differences between the results before and after the research study, for each of these six categories of questions (contents), analyzing the answers from the both groups.
Initial analysis can be done by describing the mean of these six statistical sequences as well.
TABLE IIIII Comparison of the Results of Both Tests, by Categories
Category Diagnostic test
Re-test
Difference
1 (1.r.) 28,9 55,8 26,9
2 (2.r.) 40,8 66,7 25,8
1 and 2 (1.r.and
2.r.) 42,5 51,7 9,2
3 (3.r.) 26,7 56,7 30,0
4 (4.r.) 46,7 90,0 43,3
5 (5.r.) 65,6 75,0 9,4
In order to do further analysis, statistical test of homogeneity was used. It tested whether the obtained six sets of statistics sequences are derived from the same probability distribution.
Test statistic D which has a theoretical Chi-square distribution. The resulting value, with significance level 0.05, belongs to the critical domain, which implies the rejection of the null hypothesis and acceptance of the alternative hypothesis - at least two of these statistical sequences do not derive from the same probability distribution.
essential students’ knowledge in different categories of the teaching content.
By using t-test comparison of expectations of sequences was done that refer to the results of the diagnostic test and re-test. By doing that, statistically valid conclusion was drawn and that is innovated teaching of this type, which includes educational materials created in Matlab and performed with students of technical sciences, information sciences and technology:
has a significant impact on improving the quality of essential knowledge concerning the limit and the concept of continuity of functions;
has a significant impact on improving the quality of essential knowledge concerning the domain, rank and graph of functions; has a significant impact on improving the quality of essential knowledge concerning the concept of differentiability and geometric interpretation of the derivative of function;
has a significant impact on improving the quality of essential knowledge concerning the concept of integration and geometric interpretation of integrals;
D. Experimental Versus Control Group
In order to measure the impact of project-based learning and all activities conveyed during the research study only with the experimental group students, a comparative analysis of the obtained results of both groups was conveyed.
The statistical sequence" The difference between the results from the re-test and diagnostic test" was analyzed. These data practically expressed the progress that students demonstrated before and after the research. This statistical sequence consists of 30 data, but they will be separately considered in two subsequences: 16 of them relating the students of experimental and 14 relating the control group students.
This way, we got 2 variables:
X - difference between the results of the re-test and diagnostic test of the students in the experimental group
and Y – difference between the results of the re-test and diagnostic test of the students in the control group.
For the purpose of testing this statistical Chi-square test can be used with the significance level of0.05. The test statistic D has a Chi-square distribution. The value of the realization of the statistical test is calculated and it is beyond the critical domain.
Statistically valid conclusion imposes those variables X and Y originate from the same probability distribution. This means that the differences that occur between data of these variables are of a random nature. From the results we can conclude that activities conducted solely for students of experimental group don’t have a statistically significant effect on the changes of essential knowledge. Investigating those results we observe that students from both groups achieved approximately the same results in the re-test, and those achievements due to implementation of the ICT tools for visualization of the main concepts of multivariate calculus.
IV.CONCLUSION
This research study is focused precisely on the understanding of fundamental concepts in multivariate calculus, in a manner directly related to visualization and geometrical interpretations of these mathematical concepts. Hence, the statistical test described in previous section proves that by applying this type of innovative instruction a very positive impact can be achieved on the essential knowledge of students related to the functions.
Development of programming codes for solving mathematical problems by visualization has not significant influence on improving the quality of mathematical knowledge.
REFERENCES
[1] Lj. Diković, ―Applications GeoGebra into teaching
some topics of mathematics at the college level,‖ Computer Science and Information Systems," vol. 6, issue 2, pp.191-203, 2009.
[2] A. García, F. García, S. Hoya, G. Rodríguez, A. De La Villa, ―Differential calculus of several variables with Mathematica or Maple.‖Proceedings of the 2nd International Conference on the Teaching of
[3] M. Kendal, S. Kaye, ―Teachers in transition: Moving towards CAS-supported classrooms.‖Zentralblatt für
Didaktik der Mathematik, vol. 34, issue 5, pp. 196-203,
2002.
[4] A. Kilicman, A. H. Munther, S. S. Husain, ―Teaching and learning using mathematics software ―The New Challenge‖,‖Procedia-Social and Behavioral
Sciences vol.8, pp. 613-619, 2010.
[5] B. Kissane, ―Teaching and learning elementary calculus concepts with a graphics calculator,‖Proceedings of Fourth East Asia Regional Conference on Mathematics Educationpp. 243-250, 2007.
[6] J. B. Lagrange, ―Analysing the impact of ICT on mathematics teaching practices,‖CERME 3: Third Conference of the European Society for Research in
Mathematics Education, Proceedings of CERME. vol.
3, 2003.
[7] A. Lois, L. Milevicich, ―The impact of technological
tools in the teaching and learning of integral
calculus,‖Proceedings of the Sixth Congress of the
European Society for Research in Mathematics Education, Working Group 7, pp.1060-1070, 2009.
[8] S. M. Maat, E. Zakaria, ―Exploring student's
understanding of ordinary differential equations using
computer algebraic system (CAS),‖The Turkish Online
Journal of Educational Technology, vol.10, issue 3: pp. 123-128, 2011.
[9] M. Milovanovic, Dj. Takaci, A. Milajic, ―Multimedia
approach in teaching mathematics – example of lesson about the definite integral application for determining
an area,‖International journal of mathematical
education in science and technology, vol. 42/2, pp. 175-187, 2011.
[10] S. Noinang, B. Wiwatanapataphee, Y.H. Wu,
―Teaching-learning tool for integral calculus,‖Far East
Journal of Mathematical Education, vol. 3, Issue 3, pp. 203 - 212, 2009.
[11] M.D. Schlatter. (1999) [Online]. Available: http://archives.math.utk.edu/ICTCM/VOL12/C021/pap er.pdf/
[12] Dj. Takači, I. Dimovski, (2011) ―Animations made in
Matlab and their application for didactic
purposes,‖Croatian journal of education, vol. 13, pp. 99-137, 2011.
[13] T. J. van Weert, ―The impact of informatics on the
teaching of mathematics,‖Information and
communications technologies in school mathematics.