A
rticle
Original Article
Visualization of Cast-off Patterns Using 3D
Modelling Software
A
rticle
Andy Maloney
a, Todd Campbell
b& Jim Killeen
b aFORident Software, bOttawa Police Service, Forensic Identification SectionCopyright: © 2011. Andy Maloney, Todd Campbell, and Jim Killeen. Copyright for this article is retained by the authors, with publication rights granted to the Association for Crime Scene Reconstruction. This is an Open Access article distributed under the terms of the Creative Commons Attribution-Noncommercial-No Derivatives License (http://creativecommons.org/licenses/ by-nc-nd/3.0/) which permits unrestricted noncommercial use, distribution, and reproduction, provided the original work is properly cited and not changed in any way.
Introduction
One of the purposes of crime scene analysis and reconstruction is to commu-nicate information about a crime scene to others—a colleague, an attorney, a jury, or even someone looking at the case in the fu-ture. Bloodstains and their locations can be particularly difficult to document and de-scribe to others. Photographs are certainly effective for showing the details of a blood-stain or pattern, but placing what you see in the photo into a mental three-dimensional (3D) model of the scene can be a challenge. Cast-off patterns are particularly difficult to visualize through photos because the orientation, position, relationship to other patterns, and scale are not evident. This may be even more difficult if the analyst has not attended the crime scene in person and must work off someone else’s data. De-pending on the quality and fidelity of the
photographs and diagrams, spatial relation-ships may be difficult to infer.
An analyst standing at a crime scene has an advantage: they can look at a cast-off pattern and visualize roughly where in the room the person was standing when they were swinging the bloodied object that cre-ated the pattern as well as the approximate plane of motion of the swing. But how do they take that intuitive view of the cast-off away from the scene? How do they com-municate that to others? The goal of this paper is to describe a method of preserving that information by mapping the approxi-mate plane of motion in the analyst’s head to an approximate plane of motion in a 3D software model.
A cast-off pattern, according to the Scientific Working Group on Bloodstain
Received: 05.13.2011 Revised: 09.28.2011 Accepted: 10.07.2011
Citation: Maloney A., Campbell, T. & Killeen, J. (2011). Visualization of Cast-off Patterns Using 3D Modelling Software. Journal of the Association for Crime Scene Reconstruction, 17(4), 49-56.
Abstract: Information gathered from cast-off patterns can be quite difficult to communicate to others who may not have attended the scene. An analyst at the scene can often visualize where in the room the person was standing when they were swinging the bloodied object that created the pattern as well as the approximate plane of motion of the swing. This information may be used as a limiting factor in their reconstruction, but the current methods of recording and conveying this information are limited. This paper demonstrates that more information can be gathered through an analysis of cast-off and presents a technique to record, analyze, and describes a technique to communicate it to others using a 3D software model.
Keywords: bloodstain pattern analysis, cast-off patterns, 3D visualization, computer modelling, plane of motion, crime scene reconstruction, forensic science
www.acsr.org 50 Volume 17, Issue 4, Fall 2011
Patterns (SWGSTAIN) terminology, is “a bloodstain pattern resulting from blood drops released from an object due to its mo-tion.” [1] (Note that this is distinct from a cessation cast-off pattern which is defined as “a bloodstain pattern resulting from blood drops released from an object due to its rapid deceleration.” [1] The concepts in this paper do not apply to cessation cast-off patterns.) The object might be a hammer, a baseball bat, or even a body part. Due to the forces involved when swinging an object, blood on the object moves towards the end of the object and is released as surface tension is overcome by the momentum of the blood. As this blood strikes surfaces it creates a pat-tern that may be identified as cast-off. These patterns are linear due to the forces involved in the motion of the swing and the fluid me-chanics of the blood itself [2]. When an ana-lyst stands at the scene and looks at a cast-off pattern exhibiting this linearity (fig. 1), they can determine the approximate position of the person swinging the object as well as the approximate plane of motion of the swing that created the pattern.
Because of its cohesive forces, blood in flight tends towards spherical drops [3]. As these drops strike surfaces, they may cre-ate bloodstains that exhibit directionality. These directional stains may be analyzed using well-known methods [4] to determine the tangent to the parabolic arc of the flight path at the point of impact. Thus, each of these analyzed stains results in two points: the stain’s location at the scene and the inter-section of its calculated tangent line with any of the room’s surfaces.
Mathematically, any three unique points define a plane. Because each analyzed stain results in two points, the approximate planes of motion may be calculated with just two stains from the cast-off pattern. In practice, though, it is likely that using more than two stains from disparate parts of the pattern will produce better results.
After analyzing each bloodstain, all of their points may be used to calculate the best-fit plane for the entire pattern. This plane is the approximate plane of motion of the swing that created the cast-off pattern.
Materials and Methods
For this initial study, we worked with two lab-created scenes. The first was a simple horizontal cast-off pattern created with a knife and a spring-loaded device and the second was a more complex scene with cast-off from a back swing, cast-off from a forward swing, and a single impact pattern using a hammer.
As with impact spatter analysis, stains were selected based on their size and shape. This meant avoiding stains with an alpha of greater than about 60 degrees because of the error rate associated with such stains [5]. In terms of location, stains were cho-sen from multiple surfaces. It is possible that choosing stains from multiple surfaces will produce better results than using stains from only one surface, but this determina-tion is outside the scope of this research.
The analysis of the selected cast-off bloodstains was performed the same way as impact pattern stains using a modified ver-sion of the HemoSpat bloodstain analysis software (http://hemospat.com). Perform-ing an analysis of each of the stains selected from the cast-off pattern resulted in two points for every stain—the location of the stain and the point the calculated tangent line intersects another surface in the room. Taking all of these points together, the best-fit plane may be calculated. This is the approximate plane of motion of the swing that created the pattern.
To calculate this best-fit plane, two well-known mathematical methods were con-sidered: ordinary least squares and least squares with orthogonal regression. In an ordinary least squares calculation, the goal Figure 1: An example of a
cast-off pattern exhibiting linearity.
is to minimize the sum of the squared ver-tical distances from the points to the fitted plane. One of the consequences of this is that a small error in x or y can have a dra-matic effect on the calculated plane, espe-cially if it is close to vertical. An orthogonal regression, however, seeks to minimize the sum of the squared perpendicular distances from the points to the fitted plane. While this is computationally more intensive, it produces better results because it takes into account all three dimensions in its error calculations. For this reason, least squares with orthogonal regression were used to calculate the approximate planes of motion.
To view these planes, the data from HemoSpat was exported to two different file formats: AutoCAD® DXF and
COL-LADA. Both of these formats allow speci-fication of the entire scene—the surfaces, tangent lines, areas of origin, and cast-off planes—all in one file. AutoCAD DXF is an older file format created by Autodesk®
for its computer-aided design (CAD) soft-ware
(http://usa.autodesk.com/adsk/serv-let/item?linkID=10809853&id=12272454 &siteID=123112). One of the advantages of this format is that it is well established and is readable by most CAD programs. Unfortunately, it does not support solid objects—only wireframes—and this is a significant drawback when exploring the scene in 3D. These scenes were viewed using The CAD Zone’s The Crime Zone (http://cadzone.com/the-crime-zone) and Autodesk’s free DWG TrueView™ (http://
usa.autodesk.com/adsk/servlet/pc/index? id=6703438&siteID=123112). The second file format, COLLADA (http://collada. org), is an open standard used by model-ling software to exchange scene modelmodel-ling data. The advantage of this format is that it allows us to specify solid objects and to cre-ate translucent surfaces, which helps when exploring the resulting 3D scene. These scenes were viewed using two free applica-tions: Apple® Preview (http://apple.com/
macosx/what-is-macosx/apps-and-utilities. html) and Google® SketchUp™ 8 (http://
sketchup.google.com/).
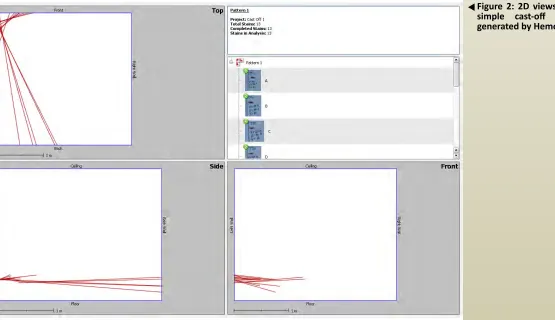
Figure 2: 2D views of the simple cast-off pattern generated by HemoSpat.
www.acsr.org 52 Volume 17, Issue 4, Fall 2011
Results
After selecting and analyzing the blood-stains from a cast-off pattern, they may be examined in the same way one would nor-mally look at impact patterns—using the “string view”. For close-to-horizontal or close-to-vertical planes of motion, these 2D views can be useful (fig. 2). More of-ten than not though, cast-off patterns do
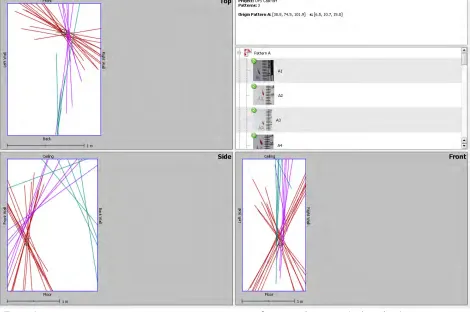
not conform to these vertical or horizon-tal planes, so the 2D views quickly become more visually complex (fig. 3).
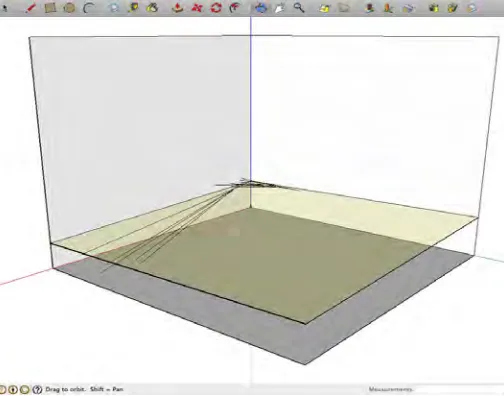
The first attempt to draw more useful visualizations out of these patterns was to take these tangent line views and put them into a 3D model so the scene could be
ex-
Figure 3: 2D views of the complex cast-off pattern generated by HemoSpat.
Figure 4 (bottom left): The COLLADA file created for the simple scene imported into Google SketchUp 8. This view shows only the tangent lines of the cast-off pattern.
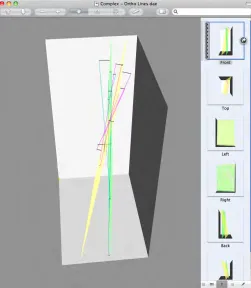
Figure 5 (bottom right): The COLLADA file created for the complex scene imported into Apple Pre-view. This view shows the tangent lines for both cast-off patterns and the impact pattern, and the impact pattern’s area of origin.
plored and manipulated using tools such as DWG TrueView or Google SketchUp. As with the 2D views, these simple 3D views result in some interesting visualizations for the simple pattern, but more complex pat-terns are still quite difficult to work with (fig. 4 & 5).
To simplify these complex views, the ap-proximate plane of motion for each of the cast-off patterns was calculated and added to the 3D model as translucent surfaces. This gives a visual reference for the whole plane of motion as calculated using the or-thogonal regression method outlined ear-lier (fig. 6 & 7). With this view, it is now possible to use the planes visually as a lim-iting factor for the position of the person swinging the bloodied object.
Finally, the tangent lines were removed to display only the approximate planes of motion and the calculated area of origin for the complex scene (fig. 8) Comparing the CAD-based results (fig. 9) with the COL-LADA-based results (fig. 8) it seems clear that the use of solid and translucent surfac-es aids in the visualization of thsurfac-ese cast-off planes. This final view removed a lot of the visual complexity and conveys the essence of the information we are trying to com-municate—the location and orientation of the approximate planes of motion in a 3D scene reconstruction.
Discussion
Knowing what information to display and how to display it effectively is some-what subjective. Adding too much informa-tion to a diagram can make it visually com-plex and thereby reduce its effectiveness at conveying information. For example, sometimes the tangent lines may be includ-ed without adding too much visual com-plexity (fig. 6) and other times they should probably be removed for clarity (fig. 8). Any tool generating these approximate planes of motion needs to allow some flexibility in terms of what information is included—the colors used for the planes and tangent lines, and so on—so the analyst has control over the resulting 3D scene.
Figure 7: The COLLADA file created for the complex scene imported into Apple Preview. This view shows the tangent lines for both cast-off patterns and the impact pattern, the im-pact pattern’s area of ori-gin, and the approximate planes of motion of each of the cast-off patterns.
Figure 6: The COLLADA file created for the sim-ple scene imported into Google SketchUp 8. This view shows the tangent lines of the cast-off pat-tern and the approximate plane of motion.
www.acsr.org 54 Volume 17, Issue 4, Fall 2011
Two other visualizations were generated in the course of this research and found to be too visually complex to be useful for the test scenes. The first one added the orthog-onal lines from each of the points used to calculate the plane to the final plane (fig. 10). This was an attempt to include some error and deviation information so the ac-tual points and their relation to the calcu-lated plane could be seen. While this was useful to verify the method, it is likely too visually complex for actual use.
The second visualization was an attempt to incorporate just the standard deviation from the plane calculations—analogous to the impact pattern area of origin’s standard deviation lines. For this two planes were added to the view—one on either side of the calculated plane situated one standard deviation away—each with a greater de-gree of translucency than the main cast-off plane. This resulted in an overly visually complex view (fig. 11). The calculated de-viation may be of interest to the analyst so other methods to convey this information should be investigated.
There are some obvious limitations to calculating the approximate planes of mo-tion using the method outlined in this arti-cle. As with impact spatter analysis, cast-off analysis works only with stains on planar
surfaces. It is also only useful for cast-off patterns that include bloodstains exhibiting directionality. Finally, although the cast-off planes may be exported in a CAD-friendly wireframe format, if we want to display the approximate planes of motion as translucent surfaces, we are restricted to using formats suitable for 3D modelling software such as 3ds Max® and Google SketchUp. Most of
these formats are proprietary, though the COLLADA format as described above is readable by almost all 3D modelling soft-ware. The drawback is that the COLLADA Figure 9 (top right): The
DXF file created for the complex scene imported into DWG TrueView. This view shows the impact pattern’s area of origin and the approximate planes of motion of each of the cast-off patterns.
Figure 10: The COLLADA file created for the com-plex scene imported into Apple Preview. This view shows the tangent lines for the cast-off patterns, the impact pattern’s area of origin, the approximate planes of motion of each of the cast-off patterns, and the orthogonal lines from the points to the plane.
format is not followed faithfully by each program, so the visual results may differ.
There are several questions that could be pursued for future research. Does select-ing bloodstains from multiple surfaces give a better result than selecting stains from only one surface? The answer to this would provide guidance for best practices. Would using different types of objects to create the cast-off patterns affect the results? Are there methods other than orthogonal re-gression to calculate the best-fit plane that might give us better results?
Before these questions may be addressed though, we need to define “better results”. While the cast-off patterns in this study were created in a controlled environment, the planes of motion were still unknown because we did not have a method of cap-turing them. Therefore the next logical line of research is to produce cast-off in known planes of motion so the calculated planes may be objectively compared with known values. To that end, methods to record the planes of motion and measure the precision and accuracy of the technique need to be developed. A simple method for creating
cast-off in known planes would be to build an adjustable apparatus to cast-off blood at a known position with known angles. A more involved study might use motion cap-ture techniques that are used in the game and movie industries to record and analyze the motion while creating cast-off patterns. A method to compare the known and cal-culated planes for precision and accuracy also needs to be determined. The calcu-lated planes of motion are never going to be exact—which is why we call them ap-proximate planes of motion—but an objec-tive measurement is required upon which to base future research.
Conclusion
Communicating information about cast-off patterns to others can be very difficult. The method presented here provides an effective way to record, analyze, and pres-ent information about cast-off patterns that was previously impractical. As many bloodstain analysts have to work from pho-tographs and may not even be able to at-tend the scene, this technique gives them a way to visualize and use cast-off patterns as an additional piece of the puzzle for their crime scene reconstructions.
Acknowledgements
The authors would like to thank Ross Gardner for his input and for contributing the simple horizontal cast-off pattern for this study and the Ottawa Police Service for the use of their blood lab for the cre-ation of the second more complex pattern.
References
1. Scientific working group on bloodstain pattern analysis: recommended terminol-ogy. (2009). Forensic Science Communications, 11 (2).
2. Bevel, T., & Gardner, R. M. (2008). Bloodstain pattern analysis: with an intro-duction to crime scene reconstruction (3rd ed.). Boca Raton, FL: CRC Press. 128-129.
Figure 11: The COLLADA file created for the com-plex scene imported into Google SketchUp 8. This view shows the impact pattern’s area of origin, the approximate planes of motion of each of the cast-off patterns, and one stan-dard deviation for each of the cast-off planes.
www.acsr.org 56 Volume 17, Issue 4, Fall 2011
3. Bevel, T., & Gardner, R. M. (2008). Bloodstain pattern analysis: with an intro-duction to crime scene reconstruction (3rd ed.). Boca Raton, FL: CRC Press. 112-113.
4. Carter, A.L.,(2001). The directional anal-ysis of bloodstain patterns theory and ex-perimental validation. The Canadian Society of Forensic Science Journal, 34, 173-189.