577
Copyright © 2011-15. Vandana Publications. All Rights Reserved.
Volume-5, Issue-3, June-2015
International Journal of Engineering and Management Research
Page Number: 577-585
Consumption Pattern of Junk Foods among Young Generation -
Preference and Reasons - A Study with Special Reference to
Kanchipuram Town
Dr. A. Vanitha
Assistant Professor (Grade-II), Department of Management Studies, SCSVMV University, Enathur, Kanchipuram, Tamilnadu, INDIA
ABSTRACT
The conservation of energy can be neither created nor destroyed. The major part of mechanical energy of every human being is obtained through consumption of food and accessories. The food consumption of every individual is performed through the consideration of various factors like energy, calories, content and hygienic. In addition to that, the various forms of food consumption at different circumstances by every consumer are labeled through social image, economic status, preservation and consumption value. The influence of socio-cultural, psychological and physical aspects is predominant in the consumption of food and its accessories. But at the same time, the food consumption of every consumer is done through conscious and subconscious backgrounds in which the rational and emotional decisions play due role. The consumption of junk foods is reflecting cultural symbols in modern economies. The consumers prefer junk foods due the changes in their economic system, status symbol, physique presence, social value and time constraints. But at the same time, many consumers may or may not aware about the consumption conspiracy of junk foods in terms of fat and cholesterol content, side effect and other consequences. In addition to that, the consumption quantum and varieties of junk foods are increasing on day by day both in urban and rural markets. The product and brand extension of various forms of junk foods increase the consumption quantity of junk foods. In this aspect, in order to understand the consumption pattern of junk foods among the consumers, reason and preference for consumption, awareness about the impact of consuming different forms of junk foods, the present research paper has been made as an attempt by considering the semi urban background of Kanchipuram Town in Tamilnadu.
Keywords---- Food and accessories, consumption
pattern, consumption value, consumption conspiracy.
I.
INTRODUCTION
578
Copyright © 2011-15. Vandana Publications. All Rights Reserved.
The junk foods are continuously less prescribed by food and health committees as suitable food for young generation and elders, but the preference of young generation towards junk foods are increasing on regular phase. The number of Fast Moving Consumer Goods Companies (FMCGs) are diversifying and extending their business in the manufacturing and selling of junk foods. The junk foods are occupying 30 to 35 percent of categories choices in any form of retails shops ranging from convenience to shopping malls. The preference and choice of consuming junk foods are getting augmented in urban, semi urban and rural markets among the young generation. In present day situation, the nature of family distribution both in urban and rural places towards nuclear system also influence the preference of consuming junk foods among the young generation. But at the same time, junk foods are less energerizers and more fat & sugar content reaches the market with warming responses among the young generation. Majority of parents are well aware about the disadvantages on permitting the young generation to consume junk foods, but still the entry and introduction of mammoth branded and private label entries are increasing in urban and rural markets. In this aspect, in order to understand the imperfect equation of health conscious and brand extension of junk foods among the consuming community of young generation, the present research paper has been attempted to learn the consumption pattern of junk foods along with the reasons and preferences among the young generation at Kanchipuram Town.
II.
STATEMENT OF THE
PROBLEM
The transformation and exchange of traditional and modern culture in various countries are heavily made impact on food consumption and habits. The value of traditional foods, its preparation, preservation and consumption pattern are highly replaced by western food habits like ready to eat pattern, less preservation value and artificial content. The hygienic background of traditional foods is compromised by western food culture. In this aspect, the growth of junk foods is penetrating in traditional countries like India. The junk foods are ready to eat in nature, contain fewer calories and fatter, in addition to that majority of junk food varieties are health hazardous and slow killing nature. By knowing the facts, majority of the young generation in traditional countries prefer junk foods due to its fast serving taste, colour, varieties and packaging designs. The changes in demographic pattern among the present
day young generation, family nature, parents
occupational related hazardous induce them to consume more amount of junk foods. The consumption culture of junk foods is cascading from urban to rural markets in India. In this aspect, the product and brand penetration are augmenting periodically in junk food varieties and majority of the young generation, the junk food has become core food rather than chatting items. In this
aspect, the social relevance related studies are required to understand the preference and reasons of junk foods among the young generation is highly needed. By understanding various studies related to junk food consumption, selling pattern and strategies and demand availability, the gap of understanding the young generation preference and choices along with reasons are yet to be studies in various parts of our country. In this aspect, the present research paper has been made as an attempt to understand the preference and reasons on consumption pattern of junk foods among the young generation in the selected study location of Kanchipuram Town.
III.
REVIEW OF LITERATURE
Ashakiran & Deepthi (2012)1, in their
research article titled “Fast Foods and their Impact on Health” stated that Junk foods have certainly carved up the third world due to globalization. It is an integral part of life in the developed and also the developing world, and coming with it is a massive increase in obesity and associated problems. The key to eating these junk foods is moderation, occasional consumption and preferably in small portions. It is not impossible to win war with junk foods against healthy foods.
More Ujwala Ramchandra, Avinash
Salunkhe and Mohite(2013)2 in “Knowledge Regarding
Health Hazards of Junk Foods among Adolescents”, says that majority type of family is nuclear 60(52.17%). Majority of study subjects 69.56% samples had Average knowledge while 6.08 % samples having Poor knowledge regarding the health hazards of junk foods. There is a significant association between expense of junk food and knowledge regarding health hazards of junk food. The study concluded that the adolescents have average knowledge regarding junk food and its hazards. Most of the students had not undergone any teaching program regarding the hazards of junk food.
Poornima, Ramakrishna and Shivakumar (2013)1 in their study entitled “Consumption Pattern of Fast Foods among Young Adults Attending Medicine OPD At Mimsh, Mandya City, Karnataka” revealed that, A total of 1165 subjects 684 (58.71%) were males and 481 (41.28 %) were females. 460 (67.25%) males and 324 (67.36%) females like fried foods like vada, bajji, 416 (60.81%) males and 302 (62.79%) females liked chats like pani puri, masala puri, etc 269 (39.33%) males and 212 (44.07%) females liked bakery foods cakes, pastries, puffs, 265 (38.74%) males and 178 (37.00%) females liked desserts sweets and chocolates. 54 (7.89%) males were vegetarians, 69 (10.08%) men were vegetarians. 58 (12.05%) women were vegetarians and 39 (8.10%) women were vegetarians. Common reasons cited by males for indulging in fast foods were easily available, party with friends and taste, where as among females taste, munching during watching television, celebration with family members.
579
Copyright © 2011-15. Vandana Publications. All Rights Reserved.
IV.
NEED FOR THE STUDY
The present day food culture and consumption has become totally mismatching for our country’s food culture and environment. The changes of food pattern with westernized concepts and application in our traditional economy created health hazardous and less hygienic consumption environment. The preference of modern western food culture has been extended both in urban and rural markets irrespective of market condition and locations. Majority of the young generation after the continuous consumption of junk foods are unable to accept and consume traditional foods and which affect their nervous system, blood management in the body and also incur the issues of weight imbalances and memories losses. It is also learn that the market value and selling quantum for junk foods are increased in semi urban and rural markets compare to urban markets. The recent establishment of organized food and retail outlets changes the preference of food consumption at negligible level compare to consumption of junk foods. Kanchipuram is a land mark for Indian tourism along with its business viability. It is the location in which the population density is increasing reasonably in very short period of past one decade. The District Statistics of Kanchipuram reveal that the major population increase happens in the location between the age group of 15 to 25. In these circumstances, the growth of market places in Kanchipuram, the entry of modern retail outlets and changing pattern of traditional stores operations assort heavy amount of fast food items, ready to eat food items and also the entry of reasonable junk food sellers. In this aspect, the food habit and consumption of junk food among the young generation in the selected study location has shown marginal change in the food culture of population at Kanchipuram Town. By keeping the general view of consumption of food and cultural
changes and also changes and preferences of junk foods by the young generation at Kanchipuram Town, the present research paper has been attempted.
V.
OBJECTIVES OF THE STUDY
1. To understand the background profile of young generation selected for the present study. 2. To learn the opinion of young generation about
junk foods
3. To know the sources of influences and reasons to prefer junk foods.
4. To know the brand preference and choice of selection of foods among young generation
VI.
SCOPE OF THE STUDY
The present study on consumption pattern of Junk Foods among the young generation – preference and reasons with reference to Kanchipruam Town has been undertaken only at selected locations in Kanchipuram Town. The study covered the young generation of age group between 15 and 25.The study covers the personal profile of young generation, their family background, types of food consumed. The study also covered the aspects on opinion about junk foods, reasons for consumption, food culture of individuals, preferred brands, sources of consumption and knowledge about junk foods. The study also attempted to cover the aspects of impact of consumption of junk food among the young generation on their personal and health related aspects.
VII.
RESEARCH METHODOLOGY
Sl.No. Instruments Description
1 Research Design Descriptive in Nature
2 Study Area Kanchipuram Town
3 Study Population Young generation population between 15 and 25
5 Sampling Unit Young generation between 15 and 25 belongs to both gender and
occupation category like students and employed.
6 Sample Size 140
7 Sampling Method Convenience sampling method
8 Sources of Data Primary and Secondary Sources
9 Source of Primary Data structured questionnaire with pre tested questionnaire comprised of suitable scaling
580
Copyright © 2011-15. Vandana Publications. All Rights Reserved.
11 Mode of Approach of
Sample Respondents
Selected places of selling points where the junk foods are consumed by the respondents
11 Tools Used Percentage analysis and Cross tables
VIII.
LIMITATIONS OF THE
STUDY
1. The study is based only on the questionnaire. Hence the success of the study depends highly on the answers given by the respondents.
2. The sample size is constrained to 140 due to limited time.
3. Some of the respondents were busy with their work so they not shown interest to fill the questionnaire. 4. The study has not made any special classification
for categorizing the junk food varieties before data collection.
IX. ANALYSIS AND
INTERPRETATION
Table 1
Background Profile of Respondents and preference of Junk Foods
Sl.No Background Profile Category Number of
Respondents
Percentage to Total
1 Age 15-20 84 60
20-25 56 40
2 Gender Male 71 51
Female 69 49
3 Occupation Students 97 69
Others 43 31
4 Educational Background Less than Graduation 30 21
Graduation 68 49
Post Graduation 24 17
Others 18 13
5 Income (Monthly) Nil 76 54
Less than 15000 28 20
More than 15000 36 26
6 Nature of Family Nuclear 92 66
Joint 48 34
7 Location Background Urban 85 61
Rural 55 39
Total 140 100
Source: computed primary data
Table 2
Favorite Junk foods of Respondents based on their Age Preferred Category of Junk
Foods
Age Background( in Years)
Total
15- 20 20-25
Fast Food and chat items 26
(31)
14 (25)
40 (29)
Snacks 18
(21)
11 (19)
29 (21)
Soft Drinks 11
(1)
6 (11)
17 (12)
Biscuits 19
(23)
12 (21)
581
Copyright © 2011-15. Vandana Publications. All Rights Reserved.
Candies 10
(1)
13 (23)
23 (16)
Total 84
(60)
56 (40)
140 (100)
Source: computed primary data, Figures in Brackets Indicates percentage to Total
Table 3
Food consumption of Respondents based on their Weight
Weight (Kgs) Food Consumption
Vegetarian Non-Vegetarian Total
Less than 60 24
(57.1)
45 (45.9)
69 (49.2)
More than 60 18
(42.9)
53 (54.1)
71 (50.8)
Total 42
(30.0)
98 (70.0)
140 (100.0)
Source: computed primary data, Figures in Brackets Indicates percentage to Total
Table 4
Opinion about preference to eat junk food based on their gender
Gender Preference hours to eat junk food
Total
Mornings Afternoons Evenings Night Time
Male 3
(2.1)
4 (2.9)
44 (31.4)
20 (14.3)
71 (50.7)
Female 4
(2.9)
5 (3.6)
43 (30.7)
17 (12.1)
69 (49.3)
Total 7
(5.0)
9 (6.4)
87 (62.1)
37 (26.4)
140 (100.0)
Source: computed primary data, Figures in Brackets Indicates percentage to Total
Table 5
Opinion about influencing factors of junk food based on their status.
Influencing Factors Occupation Category Total
582
Copyright © 2011-15. Vandana Publications. All Rights Reserved.
Time 27
(28)
12 (28)
39 (28)
Taste 43
(44)
14 (33)
57 (41)
Changing Life Style 19
(20)
10 (23)
29 (21)
Influence of Advertisement 8
(8)
7 (16)
15 (10)
Total 97
(69)
43 (31)
140 (100)
Source: computed primary data, Figures in Brackets Indicates percentage to Total
Table 6
Status of Checking the quality of junk foods based on their Occupation Status
Status of checking Quality Occupation Status
Total
Students Others
Yes 54
(56)
22 (51)
76 (54)
No 16
(16)
10 (23)
26 (19)
Sometimes 27
(28)
11 (26)
38 (27)
Total 97
(69)
43 (31)
140 (100)
Source: computed primary data, Figures in Brackets Indicates percentage to Total
Table 7
Opinion about the checking the nutrient fact label of junk food based on their status Status of checking the
Nutrient Fact Label in the Junk Food
Occupational Status
Total
Students Others
Don’t Know 19
(20)
6 (14)
25 (18)
Yes I Could Check 39
(40)
17 (40)
583
Copyright © 2011-15. Vandana Publications. All Rights Reserved.
No I Don’t Check 26
(27)
9 (21)
35 (25)
Sometimes I Check 13
(13)
11 (26)
24 (17)
Total 97
(69)
43 (31)
140 (100)
Source: computed primary data, Figures in Brackets Indicates percentage to Total
Table 8
Awareness about Chemicals content present in the Junk Foods based on their Gender
Gender Awareness about Chemicals content present in
the Junk Foods
Total
Yes No
Male 53
(74)
18 (14)
71 (51)
Female 39
(57)
30 (44)
69 (49)
Total 92
(66)
48 (34)
140 (100.0)
Source: computed primary data, Figures in Brackets Indicates percentage to Total
Table 9
Awareness about Health Hazardous based on their Gender Awareness About
Health Hazardous
Gender
Total
Male Female
Yes 58
(82)
50 (72)
108 (77)
No 13
(18)
19 (28)
32 (23)
Total 71
(51)
69 (49)
140 (100.0)
Source: computed primary data, figures in parentheses indicate percentage to total
Table 1 describes the background profile of respondents selected for the present study at Kanchipuram Town. Regarding the age group, 60 percent are between 15 to 20 and 40 percent are between 20 and 25. The age group of 15 to 20 consumes more
584
Copyright © 2011-15. Vandana Publications. All Rights Reserved.
percent are below graduates, 49 percent are graduates, 17 percent are post graduates and 13 percent are diploma holders and others. 54 percent of no income group prefers junk foods, 20 percent of income group below Rs.15000 and 26 percent of above Rs.15000 groups prefer junk foods in the selected study location. In the category of 66 percent of nuclear family and 34 percent of joint family consume junk foods. Regarding the consumer of junk foods 61 percent are urbanites and 39 percent are rural.
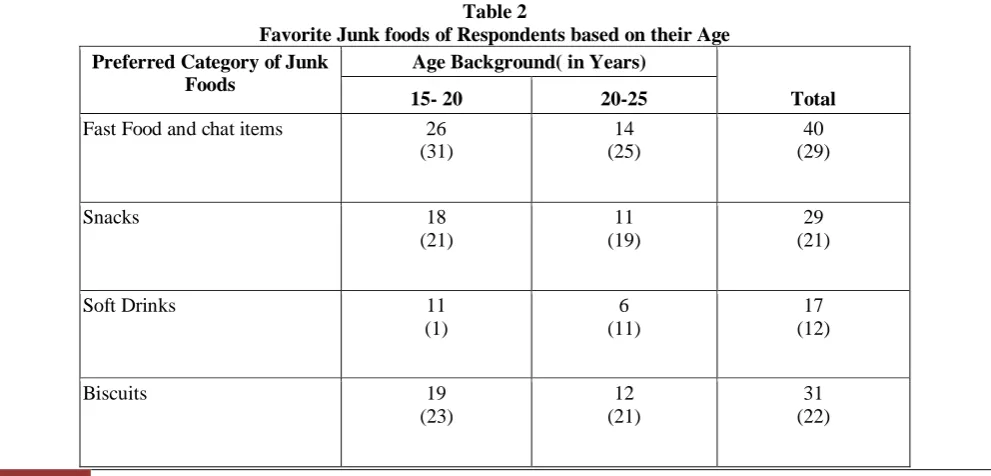
Table 2 shows favorite junk foods for respondents based on their age category. In the category between 15 and 20 ages, 31 percent prefer fast food and chat items, 23 percent prefer biscuits, 21 percent prefer snacks and 1 percent prefers candies and soft drinks. Where as in the category between 20 and 25 ages, 25 percent prefer chat items and fast food, 23 percent candies, 19 percent prefer snacks and 21 percent prefer biscuits.
Table 3 shows the distribution of food consumption by respondents based on their weight. In the category of less than 60 weights, 57.1 percent are vegetarian and 45.9 percent are non-vegetarian. Where as in the category of more than 60, 42.9 percent are vegetarian and 54.1 percent are non-vegetarian. In overall it is understood that compare to vegetarian of 30 percent 70 percent are non vegetarian and which is higher in the category of more than 60kgs.
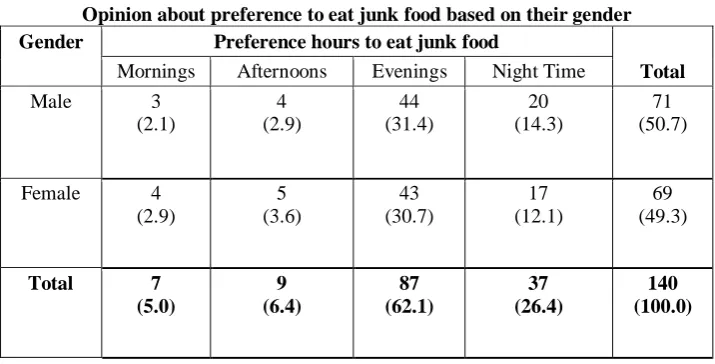
Table 4 shows the opinion of respondents about the preferred hours to eat junk food based on their gender.31 percent of the male and 30 percent of female respondents prefer to eat junk food in the evenings. In the case of 14.3 percent of the male respondents and 12.1 percent of female respondents prefer to eat in night times. During afternoon times, 2.9 percent of male and 3.6 percent of female prefer to take junk foods. The preference during morning for taking junk food is 2.1 percent by male and 2.9 percent by female. It is also observed that 62.1 percent of male and female prefer junk foods by evening times.
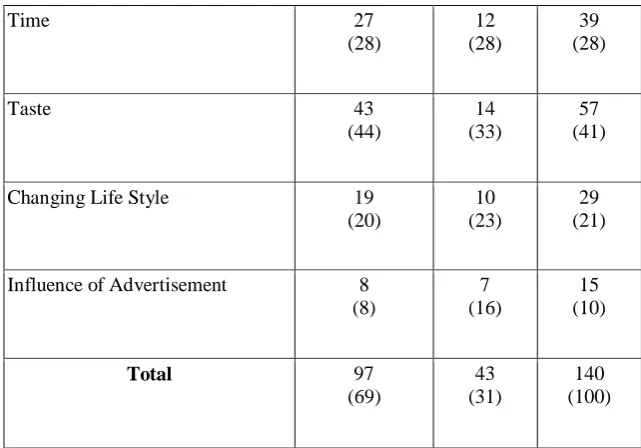
Table 5 shows influencing factors for consuming junk foods based on the occupational background of respondents. In the category of students, 28 percent consume for time passing, 44 percent for taste, 20 percent for life style changes and social image and 8 percent through the influence of advertisement and promotion. The other categories include employed, housewives, 33 percent for taste, 23 percent for changes in life style, 28 percent for time passing and 16 percent due to ad and promotional influences. It is observed from both categories the major influence through taste of junk foods and next to that time factor.
Table 6 shows the status of checking quality of junk foods by respondents based on their occupation status. In the category of students, 56 percent check the quality, 16 percent do not check and 28 percent check occasionally. Regarding other categories like employed and housewives, 51 percent check the quality, 23 percent do not check and 26 percent check occasionally. It is
observed from both categories that around 50 percent check the quality of junk foods before to consume it.
Table 7 shows the status of checking the nutrient fact label of junk foods by respondents based on their occupation status. In the category of students, 40 percent check it, 27 percent do not check it, 20 percent do not aware about it and 13 percent sometimes use to verify it. In the category of other occupants, 40 percent check it, 26 percent sometimes check it, 21 percent do not check it and 14 percent do not aware about it. It is observe that compare to others, students category have more unawareness level.
Table 8 shows awareness about chemical content present in the junk foods among the respondents based on their gender background. In the category of male respondents, 74 percent aware about it and 14 percent do not aware about it. Among female respondents, 57 percent aware about it and 44 percent do not aware about it. The level of awareness among male is higher than female.
Table 9 highlights the awareness about health hazardous among the respondents about junk foods based on their gender. 82 percent of male respondents aware about it and 18 percent do not aware about it. In case of female respondents, 72 percent aware about it and 28 percent do not aware about it. It is observed that compare to male category female category have less awareness about the health hazardous aspects of junk foods.
X.
CONCLUSION
585
Copyright © 2011-15. Vandana Publications. All Rights Reserved.
professional backgrounds.
REFERENCES
[1] Poornima S, Ramakrishna S, Shivakumar KM (2013), “Consumption Pattern Of Fast Foods Among Young Adults Attending Medicine Opd At Mimsh, Mandya City, Karnataka”, India Indian J. Prev. Soc. Med. ISSN- 0301-1216 Vol. 44 No.1-2, 201.Pp.43-45. [2] Ashakiran& Deepthi R (2012),”Fast Foods and their Impact on Health” JKIMSU (Journal of Krishna Institute
of Medical Sciences University), ISSN 2231-4261Vol. 1, No. 2, July-Dec. 2012, Pp.7-15.
[3] More Ujwala Ramchandra, Avinash Salunkhe and Mohite(2013)2
[4] Eating behaviors Among Female Adolescents” Pakistan journal of nutrition 8(4), 2009, Pp.425-432.