ENGINEERING AND GINNING
Battery Condenser System Total Particulate Emission Factors and Rates for
Cotton Gins: Method 17
J. Clif Boykin, Michael D. Buser*, Derek P. Whitelock, and Gregory A. Holt
J.C. Boykin, USDA-ARS Cotton Ginning Research Unit, 111 Experiment Station Road, P.O. Box 256, Stoneville,
MS 38776; M.D. Buser*, Biosystems and Agricultural Engineering, Oklahoma State University, 214 Agricultural Hall, Stillwater, OK 74078; D.P. Whitelock, USDA-ARS Southwestern Cotton Ginning Research Laboratory, 300 E College, P.O. Box 578, Mesilla Park, NM 88047; and G.A. Holt, USDA-ARS Cotton Production and Processing Research Unit, 1604 E FM 1294, Lubbock, TX 79401 *Corresponding author: [email protected]
ABSTRACT
This report is part of a project to character-ize cotton gin emissions from the standpoint of stack sampling. The impetus behind this project was the urgent need to collect additional cotton gin emissions data to address current regulatory issues. A key component of this study was focused on Environmental Protection Agency (EPA) total particulate emission factors. EPA AP-42 emission factors generally are assigned a rating, from A (excellent) to E (poor), to assess the quality of the data being referenced. Current EPA total particulate emission factor ratings for cotton gins are extremely low. Cotton gin data received these low ratings because the data were collected almost exclusively from a single geographical region. The objective of this study was to collect additional total particulate emission factor data for battery condenser systems from cotton gins located in re-gions across the cotton belt using EPA-approved stack sampling methodology. The project plan included sampling seven cotton gins. Key factors for selecting specific cotton gins included: 1) facil-ity location, 2) production capacfacil-ity, 3) processing systems, and 4) abatement technologies. Six gins with battery condenser system exhausts equipped with cyclones were sampled. The average produc-tion rate during testing for the six gins was 30.8 bales/h. The average battery condenser system total particulate emission factor based on six tests (18 total test runs) was 0.032 kg/227-kg bale (0.070 lb/500-lb bale). This average total particulate
emission factor was higher than that currently published in 1996 EPA AP-42, which was 0.018 kg/bale (0.039 lb/bale). The battery condenser system emission rate test averages ranged from 0.17 to 1.40 kg/h (0.37-3.09 lb/h).
U
.S. Environmental Protection Agency (EPA) emission factors published in EPA’s Compilation of Air Pollution Emission Factors, AP-42 (EPA, 1996b) are assigned a rating that is used to assess the quality of the data being referenced. Ratings can range from A (excellent) to E (poor). Current EPA emission factor quality ratings for total particulate from cotton gins are extremely low. Cotton gin data received these low ratings because they were collected almost exclusively from a single geographical region, far western U.S. (EPA, 1996a). Cotton ginners’ associations across the cotton belt, including the National, Texas, Southern, Southeastern, and California associations, agreed that there was an urgent need to collect additional cotton gin emissions data to address current regulatory issues. Working with the cotton ginning associations across the country, state and federal regulatory agencies, Oklahoma State University, and USDA-Agricultural Research Service (ARS) researchers developed a proposal and sampling plan that was initiated in 2008 to address this need for additional data. This report is part of a series that details cotton gin emissions measured by stack sampling. Each manuscript inthe series addresses a specific cotton ginning system.
The systems covered in the series include: unloading, 1st stage seed-cotton cleaning, 2nd stage seed-cotton cleaning, 3rd stage seed-cotton cleaning, overflow, 1st stage lint cleaning, 2nd stage lint cleaning, combined lint cleaning, cyclone robber, 1st stage mote, 2nd stage mote, combined mote, mote cyclone robber, mote cleaner, mote trash, battery condenser, and master trash. This report focuses on total particulate emissions from battery condenser systems.
The 1996 EPA AP-42 average total particulate emission factor for the battery condenser with
high-efficiency cyclones was 0.018 kg (0.039 lb) per
b). This average and range was based on five tests
conducted in one geographical location. The EPA emission factor quality rating was D, which is the second lowest possible rating (EPA, 1996a).
Seed cotton is a perishable commodity that has
no real value until the fiber and seed are separated (Wakelyn et al., 2005). Cotton must first be processed or ginned at the cotton gin to separate the fiber and
seed, producing 227-kg (500-lb) bales of
market-able cotton fiber. Cotton ginning is considered an
agricultural process and an extension of the harvest by several federal and state agencies (Wakelyn et al., 2005). Although the main function of the cotton gin
is to remove the lint fiber from the seed, many other
processes also occur during ginning, such as cleaning, drying, and packaging the lint. Pneumatic conveying systems are the primary method of material handling in the cotton gin. As material reaches a processing point, the conveying air is separated and emitted out-side the gin through a pollution control device. The amount of dust emitted by a system varies with the process and the condition of the material in the process. Cotton ginning is a seasonal industry lasting from 75 to 120 days, depending on the size and con-dition of the crop. Although the trend for U.S. cotton
production remained generally flat at approximately
17 million bales per year during the last 20 years, annual production varied greatly for various reasons, including climate and market pressure (Fig. 1). The number of active gins in the U.S. has not remained constant, steadily declining to fewer than 700 in 2011. Consequently, the average volume of cotton handled by each gin has risen and gin capacity has increased to an average of approximately 25 bales per hour across the U.S. cotton belt (Valco et al., 2003, 2006, 2009, 2012).
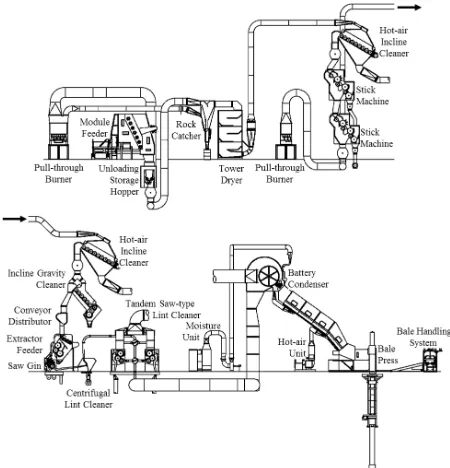
The typical cotton gin facility includes: unload-ing system, dryers, seed-cotton cleaners, gin stands,
overflow collector, lint cleaners, battery condenser,
bale packaging system, and trash handling systems (Fig. 2); however, the number and type of machines and processes varies. Each of these systems serves a unique function with the ultimate goal of “ginning” the cotton to produce a marketable product. Raw
seed cotton harvested from the field is compacted
into large units called “modules” for delivery to the gin. The unloading system removes seed cot-ton either mechanically or pneumatically from the module feed system and conveys the seed cotton to the seed-cotton cleaning systems. Seed-cotton cleaning systems dry the seed cotton and remove foreign matter prior to ginning. Ginning systems also
remove foreign matter and separate the cotton fiber
from the seed. Lint cleaning systems further clean the cotton lint after ginning. The battery condenser and packaging systems combine lint from the lint cleaning systems and compress the lint into dense bales for easy transport. Gin systems produce some type of by-product or trash, such as rocks, soil, sticks, hulls, leaf material, and short or tangled immature
fiber (motes), as a result of processing the seed cot -ton or lint. These streams of by-products must be removed from the machinery and handled by trash collection systems. These trash systems typically further process the by-products (e.g., mote cleaners) and/or consolidate the trash from the gin systems into a hopper or pile for subsequent removal.
Figure 1. Annual U.S. cotton production, active U.S. gins, and average ginning volume (bales per gin) (NASS, 1993-2012).
Lint from the final stages of lint cleaning is
combined (cotton gins typically split the precleaned seed-cotton among multiple, parallel gin stand/lint cleaning lines) and pneumatically conveyed to the
bale packaging system via the lint flue and separated
from the airstream by a large, screened, rotating drum separator called the “battery condenser”. A schematic of the battery condenser system is shown in Fig. 3. The battery condenser drops the lint onto the lint slide, which feeds lint into the bale press for compressing and packaging into a 500-lb bale. The airstream from the battery condenser system continues through a large centrifugal fan to one or more particulate abatement cyclones. Some battery condenser systems utilize a vane-axial fan, but these systems typically do not have cyclones and exhaust directly to ambient air. The material handled by the battery condenser cyclones typically includes small
trash and particulate, and lint fibers (Fig. 4).
The first D in the designation indicates the length
of the cyclone barrel relative to the cyclone barrel diameter and the second D indicates the length of the cyclone cone relative to the cyclone barrel diameter. A standard 2D2D cyclone (Fig. 5) has an inlet height
of D/2 and width of D/4 and design inlet velocity of 15.2 ± 2 m/s (3000 ± 400 fpm). The standard 1D3D cyclone (Fig. 5) has the same inlet dimensions as the 2D2D or might have the original 1D3D inlet with height of D and width D/8. Also, it has a design inlet velocity of 16.3 ± 2 m/s (3200 ± 400 fpm).
Figure 3. Typical cotton gin battery condenser system layout (Courtesy Lummus Corporation, Savannah, GA).
Figure 4. Photograph of typical trash captured by the battery condenser system cyclones.
Figure 5. 2D2D and 1D3D cyclone schematics.
The objective of this study was to collect addi-tional total particulate emission factor data for bat-tery condenser systems with cyclones for emissions control at cotton gins located in regions across the cotton belt based on EPA-approved stack sampling methodologies.
METHODS
Two advisory groups were established for this project. The industry group consisted of cotton gin-ning industry leaders and university and government researchers. The air quality group included members from state and federal regulatory agencies, and uni-versity and government researchers. Both groups were formed to aid in project planning, gin selection, data analyses, and reporting. The project plan was described in detail by Buser et al. (2012).
Seven cotton gins were sampled across the
cot-ton belt. Key factors for selecting specific cotcot-ton gins
included: 1) facility location, 2) production capacity, 3) processing systems, and 4) abatement technolo-Cyclones are the most common particulate
gies. Operating permits, site plans, and aerial pho-tographs were reviewed to evaluate potential sites. On-site visits were conducted on all candidate gins to evaluate the process systems and gather information including system condition, layout, capacities, and standard operation. Using this information, several gins from each selected geographical region were selected and prioritized based on industry advisory group discussions. Final gin selection from the
pri-oritized list was influenced by crop limitations and
adverse weather events in the region.
Based on air quality advisory group consensus, EPA Method 17 (CFR, 1978) was used to sample the battery condenser system at each gin. Method 17 was selected over Method 5 (CFR, 1987) because of the relatively low stack temperatures found at cotton gins.
Method 5 requires a heated glass probe and filter holder
to maintain the sampled gas temperature of 120°C
(248°F). Key benefits of using Method 17 over Method
5 are where particulate concentrations are independent of temperature and the sampled gas contains no liquid droplets or is not saturated with water vapor, the heating systems can be eliminated and sampling can occur at
stack temperature with an in-stack filter. Methodology
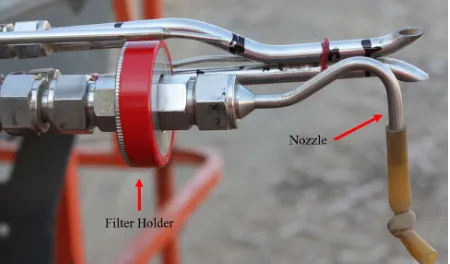
for sampling total particulate called for withdrawing particulate-laden stack gas isokinetically (the velocity of the gas entering the sampler was equal to the velocity of the gas in the stack) through a button-hook nozzle
and then collecting particles on an in-stack filter (Fig. 6). The methods for retrieving the filter and conducting
acetone washes of the sampling nozzle are described in Method 17 (CFR, 1978). The mass of particulate
on the filter and in the nozzle wash was determined by
gravimetric analyses. The total particulate mass was determined by summing the mass of particulates on
the filter and the front half wash. Stack gas temperature
and moisture content were also measured using EPA Method 17.
Figure 6. EPA Method 17 total particulate button nozzle and
in-stack filter holder photograph.
Only one stack from each battery condenser system was tested. For systems with multiple stacks, it was assumed that emissions from each stack of the system were equivalent. The total particulate emis-sions for the system were calculated by multiplying the measured emission rates by the total number of cyclones used to control the process tested (EPA, 1996a). To obtain reliable results, the same
techni-cian from the same certified stack sampling company
(Reliable Emissions Measurements, Auberry, CA), trained and experienced in stack sampling cotton gins, conducted all the tests at all the cotton gins.
All stack sampling equipment was purchased from Apex Instruments (Fuquay-Varina, NC) and
met Method 17 specifications. The sampling media were 47-mm Zefluor filters (Pall Corporation, Port
Washington, NY) and the sample recovery and analytical reagent was American Chemical Society
certified acetone (A18-4, Fisher Chemical, Pitts
-burgh, PA; assay ≥ 99.5%). Filters, wash tubs, and
lids were prelabeled and preweighed and stored in sealed containers at the USDA-ARS Air Quality Lab (AQL) in Lubbock, TX, and then transported to each test site. Prior to testing, the technician calibrated all sampling equipment according to EPA Method 17.
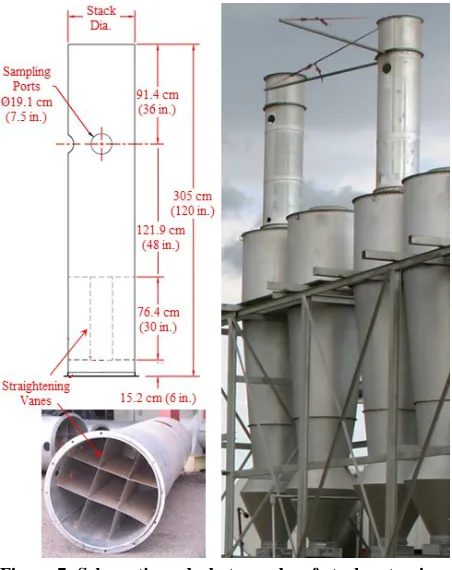
Each cyclone selected for testing was fitted with
a cyclone stack extension that incorporated two
sampling ports (90° apart) and airflow straightening vanes to eliminate the cyclonic flow of the air exiting
the cyclone (Fig. 7). The extensions were designed to meet EPA criteria (EPA, 1989) with an overall length of 3 m (10 ft) and sampling ports 1.2-m (48-in) downstream from the straightening vanes and 0.9-m (36-in) upstream from the extension exit.
The tests were conducted by the technician in an enclosed sampling trailer at the base of the cyclone
bank (Fig. 8). Sample retrieval, including filters and
nozzle acetone washes, was conducted according to
microbalance was leveled on a marble table and housed inside an acrylic box to minimize the effects of air currents and vibrations. To reduce recording er-rors, weights were electronically transferred from the microbalance directly to a spreadsheet. Technicians wore latex gloves and a particulate respirator mask to avoid contamination. AQL procedures required that each sample be weighed three times. If the standard deviation of the weights for a given sample exceeded
10 μg, the sample was reweighed. Gravimetric pro -cedures for the acetone wash tubs were the same as
those used for filters.
In addition to gravimetric analyses, each sample was visually inspected for unusual characteristics, such as cotton lint content or extraneous material.
Digital pictures were taken of all filters and washes for
documentation purposes. After the laboratory analyses were completed all stack sampling, cotton gin produc-tion, and laboratory data were merged.
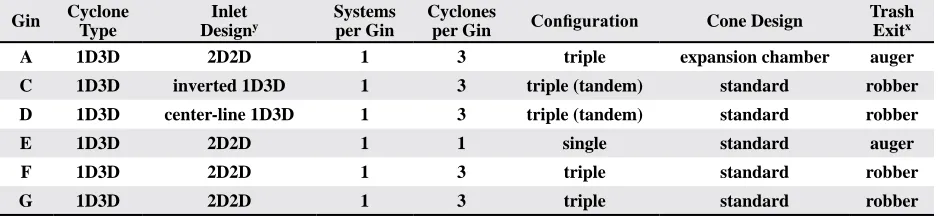
Six of the seven gins (A, C, D, E, F, and G) had battery condenser systems with cyclones on the systems exhausts. The battery condenser systems sampled were typical for the industry, but varied
among the gins. After the cotton fiber or lint was
cleaned in the three 1st stage lint cleaning systems and then three 2nd stage lint cleaning systems at gins A and E, the lint was combined and pneumatically
conveyed from the 2nd stage lint cleaners to the bat-tery condenser. The batbat-tery condenser separated the lint from the conveying air and fed the lint, via the lint slide, to the bale packaging press. The airstream then passed through a fan and exhausted through one or more cyclones (Fig. 9). The battery condenser systems at gins C and G were essentially the same as those at gins A and E, except the system combined lint from two 2nd stage lint cleaning systems (Fig. 10). The battery condenser systems at gins D and F also were similar, but the systems at those gins combined lint from four 2nd stage lint cleaning systems (Fig. 11). All battery condenser systems sampled utilized 1D3D cyclones to control emissions (Fig. 5), but there were some cyclone design variations among the gins (Table 1 and Figs. 12 and 13). All the gins,
except gin E, split the system exhaust flow between
three cyclones. Gins A, F, and G used a triple
(side-by-side) cyclone configuration and gins C and D used a tandem (one-behind-another) cyclone configuration.
The system airstream for gin E was exhausted through a single cyclone. At four gins, inlets on all the battery condenser cyclones were 2D2D type; whereas, gin C had inverted 1D3D inlets and gin D that had center-Figure 8. Clockwise from top right: cotton gin stack sampling
with air quality lab trailer and technicians on lifts; certified
stack sampling technician in the trailer control room conducting tests; sample recovery in trailer clean room; technician operating the probe at stack level.
All laboratory analyses were conducted at the
AQL. All filters were conditioned in an environmen
-tal chamber (21 ± 2°C [70 ± 3.6°F]; 35 ± 5% RH)
Figure 9. Schematic of battery condenser system pulling material from three 2nd stage lint cleaning systems (gins
A and E).
Figure 10. Schematic of battery condenser system pulling material from two 2nd stage lint cleaning systems (gins
C and G).
line 1D3D inlets. Standard cones were present on battery condenser cyclones at all gins, except gin A that had expansion chambers. The cyclones tested at gins C, D, F, and G had cyclone robber systems pulling
airflow from their trash exits. This configuration helps
remove lint and other trash from the cyclone that could otherwise circulate near the trash exit at the bottom of the cone for a period of time before dropping out. All of the cyclone variations outlined above, if properly designed and maintained, are recommended for cont-rolling cotton gin emissions (Whitelock et al., 2009).
Figure 11. Schematic of battery condenser system pulling material from four 2nd stage lint cleaning systems (gins
D and F).
Figure 12. Photographs triple cyclone conrfigurations (left to right): triple cyclone configuration with flow split among
three, side-by-side, identical cyclones; triple cyclones in
a tandem configuration with flow split among three,
one-behind-another, identical cyclones.
RESULTS
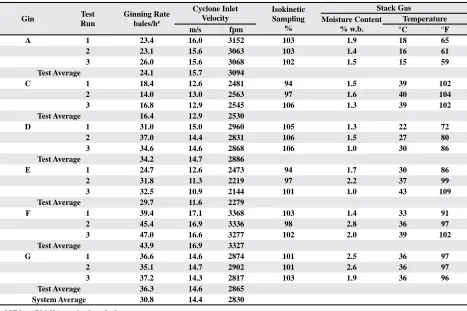
Table 2 shows the test parameters for each Method 17 test run for the battery condenser sys-tems sampled at the six gins. The average ginning rate for the six gins was 30.8 bales/h and the test average ginning rate at each gin ranged from 16.4 to 43.9 bales/h (based on 227-kg [500-lb] equiva-lent bales). The 1D3D cyclones were all operated with inlet velocities within design criteria, 16.3 ± 2 m/s (3200 ± 400 fpm), except the test runs at gins C and E that were outside the design range due to limitations in available system adjustments.
There are criteria specified in EPA Method
17 for test runs to be valid for total particulate measurements (CFR, 1978). Isokinetic sampling
must fall within the EPA defined range of 100 ± 10%. All tests met the isokinetic criteria (Table
2). The stack gas temperatures ranged from 15 to 43°C (59-109°F) and moisture content ranged
from 1.0 to 2.8% w.b.
Total particulate emissions data (emission rates and corresponding emission factors) for the battery condenser systems are shown in Table 3. The system average emission factor for the six gins was 0.032 kg/bale (0.070 lb/bale). The test average emission factors ranged from 0.0039 to 0.086 kg (0.0086 to 0.191 lb) per bale. The average bat-tery condenser system total particulate emission factor average for this project was approximately 1.8 times that published in the current 1996 EPA AP-42 for battery condenser systems with
high-efficiency cyclones, which is 0.018 kg/bale (0.039
Figure 14. Typical EPA Method 17 filter and sampler head
acetone wash from the battery condenser system with lint
on the filter (indicated by arrow). From left to right: front half wash and filter.
Figure 15. EPA Method 17 filter and sampler head acetone
wash from the battery condenerser system with no lint
present. From left to right: front half wash and filter. Table 1. Abatement device configurationz for battery condenser systems tested
Gin Cyclone Type
Inlet Designy
Systems per Gin
Cyclones
per Gin Configuration Cone Design
Trash Exitx
A 1D3D 2D2D 1 3 triple expansion chamber auger
C 1D3D inverted 1D3D 1 3 triple (tandem) standard robber
D 1D3D center-line 1D3D 1 3 triple (tandem) standard robber
E 1D3D 2D2D 1 1 single standard auger
F 1D3D 2D2D 1 3 triple standard robber
G 1D3D 2D2D 1 3 triple standard robber
z Figures 5, 12, and 13
y Inverted 1D3D has duct in line with bottom of cyclone inlet, center-line 1D3D inlet has duct in line with midpoint
between the top and bottom of the inlet
x Systems to remove material from cyclone trash exits: auger = enclosed, screw-type conveyor; robber = pneumatic suction
system
lb/bale) (EPA, 1996a, b). The range of test aver-age total particulate emission factors determined for this project encompassed the AP-42 emission factor data range. The test average emission rates ranged from 0.17 to 1.40 kg/h (0.37-3.09 lb/h).
Figure 14 shows an example of samples re-covered from a typical battery condenser system
test run. Often, there were cotton lint fibers in the
cotton gin cyclone exhausts. Therefore, it was not
unusual to find lint fiber on the Method 17 filter
Table 2. Cotton gin production data and stack sampling performance metrics for the battery condenser cleaning systems
Gin Test
Run
Ginning Rate bales/hz
Cyclone Inlet Velocity
Isokinetic Sampling
%
Stack Gas Moisture Content
% w.b.
Temperature
m/s fpm °C °F
A 1 23.4 16.0 3152 103 1.9 18 65
2 23.1 15.6 3063 103 1.4 16 61
3 26.0 15.6 3068 102 1.5 15 59
Test Average 24.1 15.7 3094
C 1 18.4 12.6 2481 94 1.5 39 102
2 14.0 13.0 2563 97 1.6 40 104
3 16.8 12.9 2545 106 1.3 39 102
Test Average 16.4 12.9 2530
D 1 31.0 15.0 2960 105 1.3 22 72
2 37.0 14.4 2831 106 1.5 27 80
3 34.6 14.6 2868 106 1.0 30 86
Test Average 34.2 14.7 2886
E 1 24.7 12.6 2473 94 1.7 30 86
2 31.8 11.3 2219 97 2.2 37 99
3 32.5 10.9 2144 101 1.0 43 109
Test Average 29.7 11.6 2279
F 1 39.4 17.1 3368 103 1.4 33 91
2 45.4 16.9 3336 98 2.8 36 97
3 47.0 16.6 3277 102 2.0 39 102
Test Average 43.9 16.9 3327
G 1 36.6 14.6 2874 101 2.5 36 97
2 35.1 14.7 2902 101 2.6 36 97
3 37.2 14.3 2817 103 1.9 36 96
Test Average 36.3 14.6 2865
System Average 30.8 14.4 2830
z 227 kg (500 lb) equivalent bales
Table 3. Total particulate emissions data for the battery condenser systems
Gin Test Run Emission Rate Emission Factor
kg/h lb/h kg/balez lb/balez
A 1 0.73 1.62 0.031 0.069
2 0.72 1.59 0.031 0.069
3 0.67 1.47 0.026 0.057
Test Average (n=3) 0.71 1.56 0.029 0.065
C 1 1.53 3.37 0.083 0.183
2 1.42 3.13 0.101 0.223
3 1.26 2.78 0.075 0.166
Test Average (n=3) 1.40 3.09 0.086 0.191
D 1 0.61 1.35 0.020 0.043
2 0.70 1.54 0.019 0.042
3 0.70 1.55 0.020 0.045
Test Average (n=3) 0.67 1.48 0.020 0.043
E 1 0.57 1.25 0.023 0.051
2 0.52 1.14 0.016 0.036
3 0.46 1.02 0.014 0.031
Test Average (n=3) 0.52 1.14 0.018 0.039
F 1 0.17 0.38 0.0044 0.010
2 0.20 0.43 0.0043 0.0095
3 0.14 0.30 0.0029 0.0064
Test Average (n=3) 0.17 0.37 0.0039 0.0086
G 1 1.52 3.35 0.041 0.091
2 1.16 2.56 0.033 0.073
3 1.04 2.30 0.028 0.062
Test Average (n=3) 1.24 2.74 0.034 0.075
System Average (n=6) 0.032 0.070
sity, Texas Commission on Environmental Quality, USDA-NRCS National Air Quality and Atmospheric Change, and U.S. Environmental Protection Agency (national, Region 4 and 9).
DISCLAIMER
Mention of trade names or commercial prod-ucts in this publication is solely for the purpose of
providing specific information and does not imply
recommendation or endorsement by the Oklahoma State University or U.S. Department of Agriculture. Oklahoma State University and USDA are equal opportunity providers and employers.
The statements and conclusions in this report are those of the USDA-ARS and Oklahoma State University and not necessarily those of the California Air Resources Board, the San Joaquin Valleywide Air Pollution Study Agency, or its Policy Commit-tee, their employees or their members. The mention of commercial products, their source, or their use in connection with material reported herein is not to be construed as actual or implied endorsement of such products.
REFERENCES
American Society of Agricultural and Biological Engineers (ASABE). 2005. Cotton Gins—Method of Utilizing Emission Factors in Determining Emission Parameters. ASAE S582 March 2005. American Society of Agricul-tural and Biological Engineers, St. Joseph, MI. Buser, M.D., D.P. Whitelock, J.C. Boykin, and G.A. Holt.
2012. Characterization of cotton gin particulate matter emissions—Project plan. J. Cotton Sci. 16:105–116. Code of Federal Regulations (CFR). 1978. Method
17—De-termination of particulate emissions from stationary
sources (in-stack filtration method). 40 CFR 60 Ap -pendix A-6. Available at http://www.epa.gov/ttn/emc/ promgate/m-17.pdf (verified 6 Dec. 2014).
Code of Federal Regulations (CFR). 1987. Method 5—Deter-mination of particulate matter emissions from stationary sources. 40 CFR 60 Appendix A-3. Available at http:// www.epa.gov/ttn/emc/promgate/m-05.pdf (verified 6 Dec. 2014).
Environmental Protection Agency (EPA). 1989. Particulate
sampling in cyclonic flow. U.S. Environmental Protec -tion Agency, Washington, DC. Available online at http:// www.epa.gov/ttn/emc/guidlnd/gd-008.pdf (verified 6 Dec. 2014).
SUMMARY
Six cotton gins with battery condenser systems were sampled using EPA Method 17 to collect additional data to improve the EPA AP-42 total particulate emission factor quality ratings for cot-ton gins. Each of the gins had battery condenser systems with cyclones on the system exhausts. The tested systems were similar in design and typical of the ginning industry. The system exhausts were equipped with 1D3D cyclones for emissions control with some variations in inlet and cone design. The average production rate during testing for the six gins was 30.8 bales/h. The average battery condenser system total particulate emission factor based on the six gins tested (18 total test runs) was 0.032 kg/227-kg bale (0.070 lb/500-lb bale). The average battery condenser system total particulate emission factor for this project was approximately 1.8 times that currently published in the 1996 EPA AP-42, which is 0.018 kg/bale (0.039 lb/bale) (EPA, 1996 a, b). The gin test average emission rates ranged from 0.17 to 1.40 kg/h (0.37-3.09 lb/h).
ACKNOWLEDGMENTS
The authors appreciate the cooperating gin managers and personnel who generously allowed and endured sampling at their gins. In addition, we thank California Cotton Ginners’ and Growers’ Association, Cotton Incorporated, San Joaquin Val-leywide Air Pollution Study Agency, Southeastern Cotton Ginners’ Association, Southern Cotton Ginners’ Association, Texas Cotton Ginners’ As-sociation, Texas State Support Committee, and The Cotton Foundation for funding this project. This project was support in-part by the USDA National Institute of Food and Agriculture Hatch Project OKL02882. The authors also thank the Cotton Gin Advisory Group and Air Quality Advisory Group for their involvement and participation in planning, execution, and data analysis for this project that is essential to developing quality data that will be used
by industry, regulatory agencies, and the scientific
community. The advisory groups included: the fund-ing agencies listed above, California Air Resources Board, Missouri Department of Natural Resources, National Cotton Council, National Cotton Ginners’ Association, North Carolina Department of
Univer-Environmental Protection Agency (EPA). 1996a. Emission factor documentation for AP-42, Section 9.7, Cotton Ginning, (EPA Contract No. 68-D2-0159; MRI Project No. 4603-01, Apr. 1996). Publ. AP-42. U.S. Environ-mental Protection Agency, Washington, DC.
Environmental Protection Agency (EPA). 1996b. Food and agricultural industries: Cotton gins. In Compilation of Air Pollution Emission Factors, Volume 1: Stationary
Point and Area Sources. Publ. AP-42. U.S. Environmen-tal Protection Agency, Washington, DC.
National Agricultural Statistics Service (NASS).1993-2012. Cotton Ginnings Annual Summary [Online]. USDA National Agricultural Statistics Service, Washington, DC. Available at http://usda.mannlib.cornell.edu/MannUsda/ viewDocumentInfo.do?documentID=1042 (verified 6 Dec. 2014).
Valco, T.D., H. Ashley, J.K. Green, D.S. Findley, T.L. Price, J.M. Fannin, and R.A. Isom. 2012. The cost of gin-ning cotton—2010 survey results. p. 616–619 In Proc. Beltwide Cotton Conf., Orlando, FL. 3-6 Jan. 2012. Natl. Cotton Counc. Am., Cordova, TN.
Valco, T.D., B. Collins, D.S. Findley, J.K. Green, L. Todd, R.A. Isom, and M.H. Wilcutt. 2003. The cost of ginning cotton—2001 survey results. p. 662–670 In Proc. Belt-wide Cotton Conf., Nashville, TN. 6-10 Jan. 2003. Natl. Cotton Counc. Am., Memphis, TN.
Valco, T.D., J.K. Green, R.A. Isom, D.S. Findley, T.L. Price, and H. Ashley. 2009. The cost of ginning cotton—2007 survey results. p. 540–545 In Proc. Beltwide Cotton Conf., San Antonio, TX. 5-8 Jan. 2009. Natl. Cotton Counc. Am., Cordova, TN.
Valco, T.D., J.K. Green, T.L. Price, R.A. Isom, and D.S. Find-ley. 2006. Cost of ginning cotton—2004 survey results. p. 618–626 In Proc. Beltwide Cotton Conf., San Antonio, TX. 3-6 Jan. 2006. Natl. Cotton Counc. Am., Memphis, TN.
Wakelyn, P.J., D.W. Thompson, B.M. Norman, C.B. Nevius, and D.S. Findley. 2005. Why cotton ginning is consid-ered agriculture. Cotton Gin and Oil Mill Press 106(8): 5–9.