Iranian journal of educational Sociology
(Interdisciplinary Journal of Education)Available online at: http://www.iase-idje.ir/
Volume 2, Number 2, July2019
Identifying total rewards from the perspective of knowledge
workers, with emphasis on learning and development strategies
Hadise Khorrami1, Hamidreza Arasteh2, Abdolrahim Navehebrahim3, Bijan Abdollahi4, 1. PhD candidate of human resource management, faculty of management, Kharazmi University, Tehran, Iran 2. Professor of management, faculty of management, Kharazmi university, Tehran, Iran
3. Professor of management, faculty of management, Kharazmi university, Tehran, Iran
4. Associate professor of management, faculty of management, Kharazmi university, Tehran, Iran
Article history:
Received date: 8 January 2019 Review date: 16 March 2019 Accepted date: 18 March 2019
Abstract
Purpose: The main purpose of this study was to identify the components of SMEs' knowledge rewards, and based on other components, learning and development strategies were developed based on the obtained components. Methodology: The present study was a descriptive survey in terms of purpose and method of data gathering and was mixed in terms of research method. Therefore, in the qualitative part, using semi-structured interviewing tool with 15 human resources experts and stakeholders Interviews wereconducted and the data were analyzed using qualitative content analysis and a model was designed by combining them. Then, the model was tested by a researcher-made questionnaire and sample of 162 SMEs in Tehran, using quantitative structural equation research method and then to formulate strategies and strategies related to learning and learning. The paired t-test were used for development. Reliability of qualitative part of Holstein method was 0.83% and Cronbach's alpha coefficient was 0.81.
Findings: The findings showed that 22 sub-components of comprehensive reward factors were identified, all of which had appropriate factor loadings and the model was confirmed. Among the non-material dimensions of learning and development, it was the most important factor and in explaining learning and development strategies, the highest gap was observed in education, which was the first and foremost strategies in this field.
Conclusion: In the payment component, cash awards and in benefits, the benefits of flexibility had the highest impact, but among the non-material components that were secondary to the overall reward, the highest impact was on the learning and development component, which included performance evaluation. It matters the most. Non-material factors were expected to be of high priority for knowledge workers, but this was not favorable to the statistical population.
Keywords:
Financial rewards, non-financial
rewards, total rewards,
knowledge workers, learning and development
Please cite this article: KhorramiH, Arasteh H R, NavehebrahimA R, AbdollahiB. (2019). Identifying total rewards from the perspective of knowledge workers, with emphasis on learning and development strategies, Iranian journal of educational Sociology. 2(2):154-162.
Corresponding author Email: [email protected]
1. Introduction
In today's dynamic business world, values and assets are becoming intangible and largely created by human capital (Beechler & Woodward, 2009). Human capital plays a major part in advancing business goals, and in small and medium-sized businesses in a way that knowledge forces are not only their assets, but also their performance is quite influential. Therefore, organizations with talent management strategies, such as planning differentiated compensation services, can optimize performance, reduce costs and competitive advantages. Accordingly, the compensation of the value and services of knowledge forces has shifted from the simple wage to a new and distinctive one; the main reason for the change of approach is not only the need to respond to the conditions created as a result of the transition from industrial economy to knowledge economy but also the importance of And the meaning of the job is for the knowledge workers in today's world who regard the job as their source of intrinsic motivation (Giancola, 2011); a comprehensive service compensation system is a new compensation strategy for staff effort as the work environment becomes more complex. Implementing comprehensive compensation management helps the organization attract the best employees Motivate and highest performance Dashth Bashd (Ingram, 2009; Li et al, 2015).
New approaches to compensation for employee services Especially for knowledge workers have been the focus of many businesses, one of which is a comprehensive reward. Comprehensive remuneration is the starting point of the collector's approach to service compensation, yet it is comprised of all the elements that are valuable to employees' employment relationships (Medcof & Rumple, 2007). Traditionally, there are material factors in compensation packages that are very effective, but the importance of non-material factors has increased in recent years. The material determinants of service compensation can be easily copied by competitors (world at work, 2015) so focusing on a range of non-material rewards is a strategy that businesses must implement to differentiate themselves (schelster et al, 2015). At the same time, the loss of the best talent at least entails the costs of staff replacement, socialization and development and training of new personnel (Porter, 2011).
Knowledge workers are people who are capable of engaging in knowledge work processes, producing and deploying knowledge, innovating and innovating in knowledge processes, while being the core of today's organizations (Lei & Lan, 2013). At the same time, in the current business world, the ability to manage and create opportunities for professional growth is extremely complex and challenging, yet essential, as the high share of development and growth of any organization relies on these people, and ultimately In the knowledge capital organization it is the employees' knowledge that leads to added value in the organization (Edgar et al, 2015). Accordingly, the type of their behavior and retention requires its own approach and strategy. Their management is very specific with respect to their motivational factors, so the mechanism is tailored to their ability to transmit information, and their scientific and philosophical findings are based on individual and group skills, and specific methods for training, activity, and There is an evaluation of their performance (Ramezan & Hasnavi, 2011).
The simplest definition of service compensation is that employees know compensation or service as all the value that comes from working relationships (Chen & hsieh, 2014). According to Lawler's (2010) view of pay and decisions, external and internal variables must be taken into account, which in line with organizational strategy and expected behaviors of employees, to be consistent with organizational goals. Comprehensive remuneration is like the employee value proposition in marketing and branding concepts, an example of the intrinsic brand equity an employer has in its employees (Van der Merwe, 2013). Comprehensive reward structure is proportional to the space and structure of agile organizations due to its several indicators, thus not only incorporating traditional and measurable elements but also non-traditional elements. Includes more material and intangible elements, the first elements such as pay, benefits and variable pay, and the second elements are the ability to access and apply it, job opportunities, learning and growth, intrinsic motivation (Strand, 2016), which derives from the work itself (Giancola, 2011), and the quality of work life provided by the organization. In this strategic direction and planning for it, in addition to organizational goals,
employees' beliefs and needs are also essential (Armstrong, 2010; CIPD, 2011), and ultimately, comprehensive reward management has a positive impact on recruiting, retaining and motivating employees (Medcof & Rumpel, 2009). In recent years, the complexity of the external environment, and the retention of talent, have been of some importance, which many organizations have sought to address by allocating compensation and diversifying services; The evolution of this model can be seen at times (from 1999 until now), which has been matched by the approach of the present to the weight of material and immaterial elements. And the design of the elements was based on the dynamic relationship between the employer and the employee (World at Work, 2015).
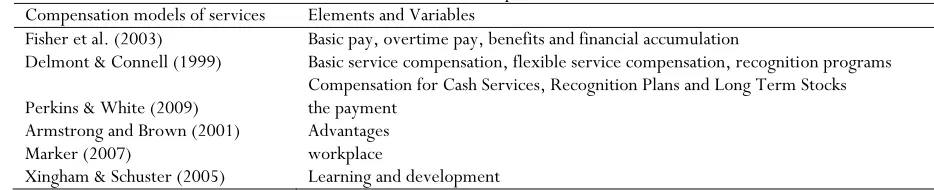
Table 1. Service Compensation Models Compensation models of services Elements and Variables
Fisher et al. (2003) Basic pay, overtime pay, benefits and financial accumulation
Delmont & Connell (1999) Basic service compensation, flexible service compensation, recognition programs Compensation for Cash Services, Recognition Plans and Long Term Stocks Perkins & White (2009) the payment
Armstrong and Brown (2001) Advantages
Marker (2007) workplace
Xingham & Schuster (2005) Learning and development
As can be seen in the table above, the evolution of comprehensive remuneration components and service compensation over time has led to material and immaterial factors side by side. Increasing employee performance, motivating non-material rewards to employees (Almehrzi & Singh, 2016), inadequate or above market level payments (Whitekar, 2011), and economic pressures to control or reduce The costs of small and medium-sized businesses (Chiang & Britch, 2005) are one of the main reasons for implementing non-material elements in small and medium-sized businesses. Internal or non-physical rewards affect two levels, individual performance and organizational performance, which at the individual level have effects on esteem and the achievement of individual goals. This impact is achieved through individual and self-management development, and why. It is, according to win-win conditions, created for organizations and individuals.
2. Methodology
The purpose of the present study is in the field of applied research because it aims to develop applied knowledge in a field. Also, the present study is concerned with how to collect the required data in the "Mixed Research" group. The mixed research method involves collecting, analyzing, and interpreting quantitative and qualitative data in a single study or in a set of studies that studies a fundamental phenomenon (Onwuegbuzi & Leech, 2006). The reasons for choosing an exploratory mixed research approach for the present study are: 1- To obtain more evidence for a better understanding of the Comprehensive Reward sub-components. In this study, first, qualitative research method and then quantitative research method were used. The qualitative phase of the interview was used. The output of the first stage consisted of the main components of Comprehensive Reward. In the quantitative phase, a questionnaire and confirmatory factor analysis were used and tested, and a paired t-test was used to develop learning and development strategies. In the qualitative section, the research interview questions were designed using a semi-structured approach. Literature backgrounds and existing theoretical frameworks were used to design the interviews. Participants in the qualitative phase of the research were 15 human resources experts. The research participants were selected using snowball technique and the interviews continued until information saturation. Qualitative interview data was analyzed using qualitative content analysis approach. Based on these analyzes, in the qualitative section, 22 items were identified as model subcomponents.
In this study, the reliability index or test-retest reliability was used to calculate the reliability of the qualitative part, in the form of a number of interviews being randomly selected and each coded twice within a short, specified interval. In this study, three interviews were selected, and the researcher re-coded each of
them twice, over a twenty-five-day interval, with a reliability coefficient of 83%. In the quantitative part of the research, the questionnaire based on the model extracted from the qualitative phase of the research was designed. In which knowledge workers were identified as the primary asset and knowledge of these employees created value added, 162 people were selected based on the Cochran formula. Content validity was used to determine the validity of the questionnaire. The validity of the questionnaires was assessed by the researcher, some sample members and some academic experts before distribution, which was above 0.62% for all questions. Factor analysis and LISREL were used to evaluate the model and paired t-test was used to explain learning and development strategies.
3. Findings
In the qualitative content analysis section after each interview, the results were analyzed. This step consists of open coding, categorization, and articulation of the main categories derived from the qualitative data as shown in the following table 2.
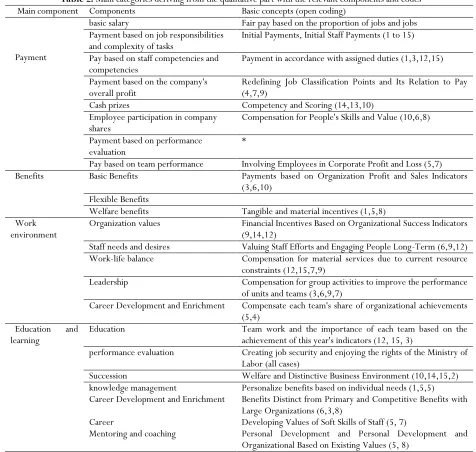
Table 2. Main categories deriving from the qualitative part with the relevant components and codes Main component Components Basic concepts (open coding)
Payment
basic salary Fair pay based on the proportion of jobs and jobs Payment based on job responsibilities
and complexity of tasks Initial Payments, Initial Staff Payments (1 to 15) Pay based on staff competencies and
competencies Payment in accordance with assigned duties (1,3,12,15) Payment based on the company's
overall profit Redefining Job Classification Points and Its Relation to Pay (4,7,9) Cash prizes Competency and Scoring (14,13,10)
Employee participation in company
shares Compensation for People's Skills and Value (10,6,8) Payment based on performance
evaluation *
Pay based on team performance Involving Employees in Corporate Profit and Loss (5,7) Benefits Basic Benefits Payments based on Organization Profit and Sales Indicators
(3,6,10) Flexible Benefits
Welfare benefits Tangible and material incentives (1,5,8) Work
environment Organization values Financial Incentives Based on Organizational Success Indicators (9,14,12) Staff needs and desires Valuing Staff Efforts and Engaging People Long-Term (6,9,12) Work-life balance Compensation for material services due to current resource
constraints (12,15,7,9)
Leadership Compensation for group activities to improve the performance of units and teams (3,6,9,7)
Career Development and Enrichment Compensate each team's share of organizational achievements (5,4)
Education and
learning Education Team work and the importance of each team based on the achievement of this year's indicators (12, 15, 3) performance evaluation Creating job security and enjoying the rights of the Ministry of
Labor (all cases)
Succession Welfare and Distinctive Business Environment (10,14,15,2) knowledge management Personalize benefits based on individual needs (1,5,5) Career Development and Enrichment Benefits Distinct from Primary and Competitive Benefits with
Large Organizations (6,3,8)
Career Developing Values of Soft Skills of Staff (5, 7)
Mentoring and coaching Personal Development and Personal Development and Organizational Based on Existing Values (5, 8)
Evaluation of the research model in the quantitative section was performed using confirmatory factor analysis test. The value of the Bartlett test in Table 2 indicates the normality of the multivariate distribution of the research factors. The sum of these two tests indicates that the factor analysis is appropriate for identifying the structure and factor model and rejects the assumption that the correlation matrix is known.
Table 3. KMO index of factor analysis
The level KMO Interpretation
primitive 0/893 Sample size is adequate and adequate. corrected 0/897 Sample size is adequate and adequate
Confirmatory factor analysis uses the relationship between the present variables (main categories) and the observed variables (Bern, 1994). Models of measurement of these variables were analyzed by structural equations:
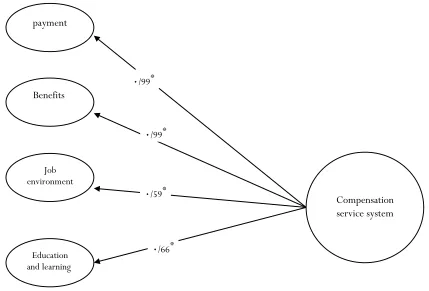
Figure 1. Confirmatory factor analysis model of service compensation system structure in standard coefficient estimation mode Fig. 1 shows a two-step confirmatory factor analysis model in coefficient estimation mode. The structure of the compensation system consists of four subscales: payment, benefits, work environment, education and learning. In this graph, the numbers or coefficients are divided into two groups. The first category is called first-order measurement equations, which represent the relationships between hidden and explicit variables (relations between ellipses and rectangles). These equations are called first-order factor loadings. The second category is the structural equation, which is the relationship between hidden and hidden variables (relations between service compensation system dimensions and dimensions).
Compensation service system payment
Benefits
Job environment
Education and learning
0/66*
0/59*
0/99*
0/99*
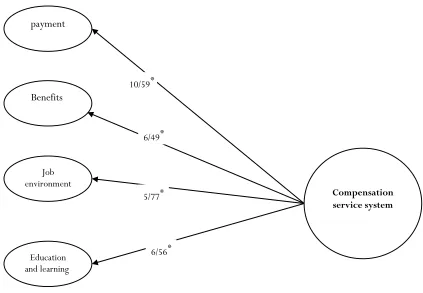
Figure 2. Confirmatory factor analysis model of service compensation system constructs in significant coefficients
The diagram above also shows the two-step factor analysis model of the service compensation system in the significant way t-values. This model actually tests all first- and second-order measurement equations (factor loadings) using t-statistics. Since the calculated values of t for each of the factor loadings are above 1.96, the validity of the questionnaire questions for measuring the concepts can be considered valid at this stage. In fact, the results show that what we were trying to measure by the questionnaire questions was achieved by this tool. In this study, to evaluate the validity of the confirmatory factor analysis model, the chi-square (χ 2), fitness index (GFI), fitness adjustment index (AGFI), soft fitness index (NFI), soft fitness index (NNFI), incremental fitness index (IFI), Adaptive Fit Index (CFI), and Root Estimation of the Second Root Estimation (RMSEA) were used. The following table shows the estimated value of these indices along with the permitted limit of these indices:
Table 4. Fitting Indicators of Structural Compensation System Model
Index name Estimated Valid ratio
(X2 to degrees of freedom) 1.79 Less than 3
Goodness of fit (GFI) 0.83 Above 0.8
Modified goodness of fit (AGFI) 0.81 Above 0.8
Root Mean Square Error of Estimation (RMSEA) 0.07 Less than 0.1
Adjusted Fit (CFI) 0.96 Above 0.9
Soft Fit (NFI) 0.93 Above 0.9
Null soft fit (NNFI) 0.96 Above 0.9
Increasing Fit (IFI) 0.96 Above 0.9
The data in the table above shows that the structural fit indices of the compensation system are in good shape. And so this model can be used to test the hypotheses of causal relationships between variables. Data
Compensation service system
payment
Benefits
Job environment
Education and learning
6/56* 5/77* 6/49* 10/59*
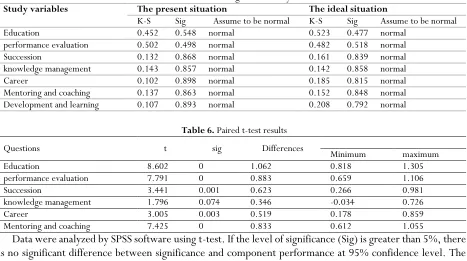
were analyzed using Kolmogorov-Smirnov and Shapiro-Wilk tests, the results of which are reflected in the table below.
Table 5. Testing the normality
Study variables The present situation The ideal situation
K-S Sig Assume to be normal K-S Sig Assume to be normal
Education 0.452 0.548 normal 0.523 0.477 normal
performance evaluation 0.502 0.498 normal 0.482 0.518 normal
Succession 0.132 0.868 normal 0.161 0.839 normal
knowledge management 0.143 0.857 normal 0.142 0.858 normal
Career 0.102 0.898 normal 0.185 0.815 normal
Mentoring and coaching 0.137 0.863 normal 0.152 0.848 normal Development and learning 0.107 0.893 normal 0.208 0.792 normal
Table 6. Paired t-test results
Questions t sig Differences Minimum maximum
Education 8.602 0 1.062 0.818 1.305
performance evaluation 7.791 0 0.883 0.659 1.106
Succession 3.441 0.001 0.623 0.266 0.981
knowledge management 1.796 0.074 0.346 -0.034 0.726
Career 3.005 0.003 0.519 0.178 0.859
Mentoring and coaching 7.425 0 0.833 0.612 1.055
Data were analyzed by SPSS software using t-test. If the level of significance (Sig) is greater than 5%, there is no significant difference between significance and component performance at 95% confidence level. The results of t-test show that for all indices except knowledge management, the desired status (component importance) is rated at 95% confidence level than the existing status (performance). Performance has been. The gap column shows the difference in performance and importance, the greater the gap, the greater the gap between importance and performance. Therefore, it can be said that the gap between the status quo and the desired one was significant in all the components studied.
Table 7. Learning and Development Strategies
Dimensions First Class Strategies Second category strategies Tier 3 strategies Learning and development Education performance evaluation Succession
4. Conclusion
The purpose of this study was to identify the sub-indicators of the key components of the Comprehensive Reward and examine it from the standpoint of SMEs, and then to present learning and development component strategies based on the status quo and Optimal. One of the major challenges of today's small and medium-sized businesses is access to talent, so an approach requires knowledgeable staff to compete against large corporate and corporate brands. Competitors are rewarded based on the perspective of employees, while focusing and formulating non-material strategies that distinguish business from other competitors. The research findings confirm the relationship of each of the material and non-material components to the concept of comprehensive reward, but the most important is the importance of the material components to the comprehensive reward. In the payment component, cash rewards and in benefits, the benefits of flexibility had the highest impact, but among the non-material components that were secondary to the overall reward, the highest impact was on the learning and development component, which also included performance evaluation. It matters the most. It was expected that non-material factors would be a high priority for knowledge workers, but this was certainly not favorable for our statistical community. (Moore & Bassin, 2012).
Next, in the formulation of learning and development strategies, the largest gap in education can be found. The first are strategies in the field of education, then strategies are in the areas of implementation of performance appraisal, mentoring and coaching, surrogacy, career and knowledge management. According to the literature and background of research conducted in this area, employees' attitudes to the importance of the material factors of "benefits and pay" on comprehensive rewards with some research, including the results of Shellster et al. (2014), Harwitz et al. (2003). ), And research findings on the appropriateness and meaningfulness of "material and immaterial factors" together under the heading of Comprehensive Reward in the Studies of Pregnolato (2010), Amandsen (2007), and Ultimately Valuable Performance Assessment The main areas of learning and development factors are in line with the studies by Pregnolano et al. (2017).
One of the major limitations of this research is the lack of similar research at the internal level with the integration of all components of the comprehensive reward together. Among other constraints, the cultural factors and policies of small and medium-sized enterprises are stronger than those of large businesses and employer-brand owners, which always address issues such as security and job stability as opposed to individual development and dynamics. Staff mentioned that the above factors have a great impact on the results of the research, because in addition to the high levels of their needs at the most basic level, they need health agents. Thus, conditions such as the recession, the need for job security, stability and meeting health needs have had a real impact. (Banton & Brewer, 2012),
Among the factors that are considered for further consideration in small and medium-sized enterprises are the consideration of the Comprehensive Reward Agreement and how it is communicated as well as the evaluation of the effectiveness of the Comprehensive Reward at the enterprise level. The influence of factors such as age, generation differences, and even the type of expertise and supply and demand in the labor market are among the factors that are recommended for further investigation. Finally, the set of material and non-material rewards is very important in knowledge-employer-employee relationships, and with respect to learning and development strategies and other comprehensive reward components, the results of this study and other similar research serve as retention guidelines. Talents will work.
References
Al Mehrzi N, Singh S K. (2016). Competing through employee engagement: a proposed framework. International Journal of Productivity and Performance Management. 65(6):831-843.
Armstrong M. (2010). Armstrong's handbook of reward management practice: Improving performance through reward. Kogan Page Publishers.
Armstrong M, Brown D. )2005(. Reward strategies and trends in the United Kingdom: the land of diverse and pragmatic dreams. Compensation & Benefits Review. 37(4):41-53.
Armstrong M, Brown D. )2006(. Strategic reward: making it happen. Kogan Page Publishers.
Armstrong M, Stephens T.)2005(. A handbook of employee reward management and practice. Kogan Page Publishers.
Armstrong M, Murlis H. (2007). Reward management: A handbook of remuneration strategy and practice. Kogan Page Publishers. Beechler S, Woodward I C. (2009). The global “war for talent”. Journal of international management. 15(3):273-285.
Chiang F F, Birtch T A. (2005). A taxonomy of reward preference: Examining country differences. Journal of International Management. 11(3):357-375.
Dolmat-Connell J. (1999). Developing a Reward strategy that Delivers Shareholder and Employee Value. Compensation & Benefits Review.31(2):46-53.
Edgar F, Geare A, O'Kane P. (2015). The changing dynamic of leading knowledge workers: The importance of skilled front-line managers. Employee Relations. 37(4):487-503.
Giancola F L. (2009). Is Total Rewards a Passing Fad? Compensation & Benefits Review. 41(4): 29-35.
Giancola F. (2011). Examining the job itself as a source of employee motivation. Compensation & Benefits Review. 43(1):23-29. Hasanavi R, Ramezan M. (2011). Leveraging intellectual capital in organization with learning organization approach. Journal of
management improvement. 5(1):25-39.
Horwitz F M, Heng C T, Quazi H A. (2003). Finders, keepers? Attracting, motivating and retaining knowledge workers. Human resource management journal. 13(4):23-44.
Lei H, Lan J.)2013(. Research into the influence factors of knowledge workers sharing residual claims rights. Journal of Knowledge-based Innovation in China. 5(1):60-72.
Medcof J, Rumpel S.)2007(. High technology workers and total rewards. The Journal of High Technology Management Research. 18(1):59-72.
Onwuegbuzie A J, Leech N L. (2006). Linking research questions to mixed methods data analysis procedures 1. The qualitative report. 11(3):474-498.
Ozdemir O, Kizildag M, Upneja A. )2013(. Does risk matter in CEO compensation contracting? Evidence from US restaurant industry. International Journal of Hospitality Management. 34:372-383.
Perkins S, White G. )2010(. Modernizing pay in the UK public services: trends and implications. Human Resource Management Journal. 20(3):244-257.
Petronio A, Colacino P. )2008(. Motivation strategies for knowledge workers: evidences and challenges. Journal of technology management & innovation. 3(3):21-32.
Pregnolato M, Bussin M H, Schechter A F. (2017). Total rewards that retain: A study of demographic preferences. SA Journal of Human Resource Management. 15(1):1-10.
Rumpel S, Medcof J W. (2006). Total rewards: Good fit for tech workers. Research-Technology Management. 49(5):27-35. Schlechter A, Faught C, Bussin M. (2014). Total rewards: A study of artisan attraction and retention within a South African
context. SA Journal of Human Resource Management. 12(1): 1-15.
Schlechter A, Thompson N C, Bussin M. (2015). Attractiveness of non-financial rewards for prospective knowledge workers: An experimental investigation. Employee Relations. 37(3):274-295.
Shujahat M, Sousa M, Hussain S, Nawaz F, Wang M, Umer M. (2019). Translating the impact of knowledge management processes into knowledge-based innovation: The neglected and mediating role of knowledge-worker productivity. Journal of Business Research. 94:442-450.
Whitaker P. (2010). What non-financial rewards are successful motivators? Strategic HR review.
World at Work. (2015). The World at work Handbook of Compensation, Benefits and Total Rewards: A Comprehensive Guide for Hr Professionals. Wiley.
Zingheim P, Schuster J R.)2005(. The next decade for pay and rewards. Compensation & Benefits Review. 37(1):26-32.