DEMOGRAPHIC RESEARCH
VOLUME 32, ARTICLE 43, PAGES 1177
−
1208
PUBLISHED 3 JUNE 2015
http://www.demographic-research.org/Volumes/Vol32/43/ DOI: 10.4054/DemRes.2015.32.43
Research Article
Long-term trends in living alone among Korean
adults: Age, gender, and educational differences
Hyunjoon Park
Jaesung Choi
This publication is part of the Special Collection on “Living alone: One-person households in Asia,” organized by Guest Editors Wei-Jun Jean Yeung and Adam Ka-Lok Cheung.
©2015 Hyunjoon Park & Jaesung Choi.
This open-access work is published under the terms of the Creative Commons Attribution NonCommercial License 2.0 Germany, which permits use, reproduction & distribution in any medium for non-commercial purposes, provided the original author(s) and source are given credit.
1 Introduction 1178
2 Age, gender, and educational differences in living alone 1180
3 Data and methods 1184
4 Results 1186
4.1 Trends in living alone by age and gender: 1960−2010 1186 4.2 Educational differentials in living alone 1189 4.3 Living alone among the widowed elderly 1193 4.4 Living alone among never-married men and women aged 25 to 34 1197
5 Conclusions 1201
6 Acknowledgements 1203
Long-term trends in living alone among Korean adults:
Age, gender, and educational differences
Hyunjoon Park1
Jaesung Choi2
Abstract
BACKGROUND
One of the major demographic changes in Korea is the rapid increase of one-person households, from 7% in 1985 to 24% in 2010. The increase of living alone has important implications for the traditional family system.
OBJECTIVE
We investigate the long-term trend over half a century in the proportion of people living alone, separately for different age and gender groups. Focusing on two groups, the widowed elderly aged 65 or over and never-married 25 to 34-year-olds, we further examine the relationship between education and living alone.
METHODS
We use 1960 to 2010 Korean Census data to describe the trends in living alone by age and gender. We apply logit models to predict the odds of living alone by education from 1980 to 2010. To facilitate interpretation, we present predicted probabilities of living alone.
RESULTS
There is a continuing increase in solo living among Koreans, albeit to different degrees, for both genders and all age groups. The rising trend in solo living among elderly widows and never-married men aged 25 to 34, in particular, reveals that the propensity for living alone has increased within specific marital status and age groups. We find that those with lower education were more likely to live alone than their counterparts with higher education.
1 Korea Foundation Associate Professor, Department of Sociology, University of Pennsylvania, U.S.A.
E-Mail: [email protected].
2 Corresponding author. Assistant Professor, Department of Economics, Sungkyunkwan University, Seoul,
CONCLUSIONS
The negative relationship between education and living alone in Korea is in contrast to the pattern of ‘buying-out’ living alone in the United States. We interpret the finding in the context of Korean society, which has a long tradition of valuing living together.
1. Introduction
One of the major demographic changes in South Korea (hereafter Korea) is the rapid increase in one-person households. One-person households accounted for only 7% of all households in 1985, but that number had increased to 24% of all Korean households by 2010 (Statistics Korea 2012). The speed of increase in one-person households in Korea is striking compared to the experiences of other countries. For instance, it took a century for the percentage of one-person households in the United States to increase from 5% (in 1900) to 26% (in 2000) (Fischer and Hout 2006). The speed of the increase in one-person households in Korea far exceeds the predictions of earlier researchers. For instance, although Park (1994: 127) recognized the increase of one-person households in the 1990 Korean Census compared to earlier years, he concluded that “it was not clear that growth in the propensity to live alone appears to be pervasive in recent Korea.”
Since the National Statistical Office of Korea (Statistics Korea) released statistics on one-person households in early 2012, news media and scholars have paid increasing attention to the growth of one-person households, discussing its potential effects on consumption patterns, housing markets, and family relationships (Choi 2013; Chung 2012; Han and Lee 2013). Because Korean society has been traditionally characterized by strong family ties, including frequent interactions and exchanges among family members as well as coresidence (Park and Cho 1995; Reher 1998), the rise of one-person households could have particularly important implications for family systems in Korea. In fact, in his study of one-person households 20 years ago, Park (1994) anticipated the limited growth of one-person households in Korea due to persistence of traditional family norms and decrease in rural-to-urban migration. However, as suggested by the rapid increase in divorce in Korea (Park and Raymo 2013), Korean families are experiencing significant changes. The increase in the share of one-person households could be another indication of a new family transition in Korean society. Therefore, it is critical to carefully document trends in one-person households and understand the characteristics of people living alone.
in living alone and its implications. As demographers have consistently indicated, demographic changes have to be compared over time by counting people rather than households (or housing units) (Fischer and Hout 2006; Ruggles and Brower 2003). Specifically, Ruggles and Brower (2003) highlight four limitations of measuring household composition at the household or family level: being sensitive to demographic conditions other than living arrangement preference; difficulty in controlling for age and gender, which are the two most important variables affecting demographic behaviors of individuals but not of households; conflating household composition with household headship; and difficulty in defining populations at risk for given demographic behaviors.
Ruggles and Brower’s points apply well to the case of one-person households. For instance, when we measure the percentage of households that house a single 65-year-old widow, it is difficult to define the population at risk that the widow belongs to at the household level. The whole households that contain at least one 65-year-old widow cannot accurately reflect the population at risk because widows living with other household members might or might not be household heads, depending on the relationship of the widow with other household members (the problem of conflating household composition with household headship). However, defining population at risk at the individual level is straightforward: all widows aged 65. In other words, we simply measure the percentage of those who live alone among all widows aged 65.
In this study we take the approach suggested by Ruggles and Brower (2003: 92−93): “… instead of measuring the percentage of households that fall into a particular category, we should measure the percentage of eligible individuals who reside in a particular family or household situation.” This method of measuring one-person households also facilitates separate examination of trends in living alone with regard to age and gender, as Ruggles and Brower emphasized. Most news media and scholars in Korea have focused on the increase in the proportion of one-person households rather than the proportion of people living alone.3 We examine long-term trends in the proportion of Korean adults who live alone, which might not have changed to the same extent as the proportion of Korean households that house one person. For this analysis we rely on individual-level data from the Korean census, which allow us to trace the historical evolution of living alone among Korean adults over the half century from 1960 to 2010. To the best of our knowledge, our study covers the longest period in investigating the trend in living alone in Korea, especially for both younger and older age groups.
3 One exception is Park’s (1994) study that examined characteristics of individuals who lived alone, using the
2. Age, gender, and educational differences in living alone
To closely examine the types of people who live alone, we examine trends in living alone separately for different age groups, genders, and educational groups. Distinguishing different subpopulations will help identify whether the trend toward solo living has been uniform across different groups or, instead, whether the trend has been more evident for some groups than others. Many previous studies have focused on identifying demographic and socioeconomic characteristics associated with living alone among the elderly, particularly the widowed elderly, as many in this group live alone (Kramarow 1995; McGarry and Schoeni 2000; Ruggles 1996). The increase in living alone has also been considerable among young adults aged less than 35 years in some countries such as the United States, although there has been a recent upward trend of living with parents, particularly during the economic recession (Klinenberg 2012; Qian 2012). Some studies even highlight an increasing trend in living alone among middle-aged people, at least in some Western societies (Jamieson, Wasoff, and Simpson 2009). Along with the overall rise of living alone, however, the nature of living alone, factors associated with living alone, and the implications of living alone may differ across different age groups (cf. Klinenberg 2012; Kramarow 1995; Stone, Berrington, and Falkingham 2011). Therefore it will be useful to examine the evolution of living alone for younger and older age groups simultaneously, in order to obtain a comprehensive picture of living alone.
The characteristics of living alone and their determinants can vary not only by age but also by gender. In the United States the percentage of adult women (aged 18 years or over) who live alone is higher than for men, whereas many European countries have higher percentages for adult men (aged 20 or over) (Wilson and Lamidi 2013; Lodovici et al. 2012). However, the overall percentage of men and women who live alone masks different gender patterns according to age. Because of higher mortality among elderly men than elderly women, in many societies the share of elderly women who live alone is likely to be higher than the corresponding share of elderly men. However, gender differences in living alone among young adults are less straightforward. The gender difference in the timing and the extent to which young adults leave their parental home to form an independent household likely depends on various factors such as gender differences in labor force participation, education, age at marriage, and family norms.
counterparts, or vice versa. Although estimates for return to schooling vary depending on the data and countries studied, research consistently finds a causal relationship between education and higher earnings (Card 1999). Likewise, using Chinese panel data, Su and Heshmati (2013) found that education is an essential determinant of household income. There is some evidence that despite the rapid increase of college graduates in the past two decades in Korea, returns to schooling remain relatively high (Choi 2002). A recent study finds a significant effect of schooling on income even for workers in the agricultural sector (Jung and Choi 2013).
However, we acknowledge the limitation of our focus on educational attainment as a proxy for economic resources, particularly for younger people, because most of them attend college. Hence, the simple measure of having a college degree may be limited in capturing varying economic conditions within this group. Moreover, we recognize that educational attainment may also indicate cultural values and a taste for independence and individualism (Kramarow 1995; Michael, Fuchs, and Scott 1980) distinct from economic resources, although possibly related. Given the lack of direct measures of an individual’s economic resources, we do not attempt to address what education really measures, but rather consider education as reflecting generally ‘advantaged’ socioeconomic status. When educational differences may not reflect economic differences well, our estimate of the education effect may underestimate the difference in living alone among people at the high and low ends of socioeconomic status, as far as there is a systematic relationship between economic resources and living alone.
In order to address at least to some extent the limitation of relying on educational attainment as a proxy for an individual’s economic conditions, we assess the effect of education on living alone with detailed classifications of educational attainment. More detailed measures of education can better reflect differential socioeconomic conditions by education than too simplified measures of education. Moreover, we control for working status of young people in estimating the effect of education on living alone. Although the Korean census data do not provide incomes or earnings, we can identify who is currently working among young people. We consider that controlling for working status helps further differentiate young people’s socioeconomic conditions within the same level of educational attainment.
this goal” (Kramarow 1995: 337). Therefore, education, which reflects overall socioeconomic advantages, is expected to increase the likelihood of living alone. In fact, studies in the United States have shown a positive relationship between education and living alone (McGarry and Schoeni 2000; Michael, Fuchs, and Scott 1980). A recent brief also shows that the percentage of US adults who were living alone in 2011 was highest among those with at least a bachelor’s degree (15%) and lowest among those who did not graduate from high school (12%) (Wilson and Lamidi 2013). In addition, 13% of US adults with some college education and 13% of those with only a high school diploma lived alone. In other words, although the difference between educational groups in the percentage of those living alone is modest, the majority of US adults living alone have at least some college education or more.4
However, it is not yet clear whether a similar pattern of educational differentials in solo living will be found in Korea. Neither news media nor scholars, who have shown increasing concern about one-person households in Korea, have paid systematic attention to educational (or socioeconomic) differentials in the likelihood of living alone. To better understand the nature of living alone and to draw implications from the growing rates of living alone in Korea, it is critical to examine the characteristics of those living alone, especially the socioeconomic characteristics. Is solo living a living arrangement mostly enjoyed by the middle class who can afford to live independently? Or do mostly poor adults live alone, because living together is expensive and difficult to achieve?
Compared to US culture, which values independent living (see Klinenberg 2012), living together has long been a tradition in Korean society. Living with children and grandchildren and receiving support from them has been found to be beneficial to the health and life satisfaction of the elderly (Chang and Park 2012; Cho 2012; Lee, Kim, and Kang 2011). In Korea it is common for many young unmarried men and women to stay with their parents until their late 20s and early 30s, before marriage (Park and Sandefur 2005; Yi et al. 1994). In other words, living together has been a strong cultural norm in Korea for both young and old age groups. In this cultural context, privacy might not be considered as desirable as it is in Western societies. Thus, some older people, especially those with economic resources and spacious housing, may prefer ‘buying coresidence’ to ‘buying privacy’.
Moreover, even if privacy and independence are increasingly valued among young Koreans and thus the share of young people living alone is rising overall, solo living may have a different meaning for young people from advantaged families than for those
4
from disadvantaged families. Economic and emotional support from affluent parents may allow and even facilitate young people to postpone leaving the parental home, especially when it is becoming increasingly difficult and taking much longer for young Koreans to find a stable job after school (see Park 2013). On the other hand, lacking support from parents who are themselves struggling with economic strain and poverty, young people from disadvantaged families may not maintain a strong relationship with family members and may have to live by themselves from earlier ages. In other words, for young people from disadvantaged families, living alone may not be something that can be purchased for privacy and independence but something that is forced on them for survival. Therefore, considering the correlation between family background and education, we may see a greater likelihood of living alone among those with less education compared to those with more education. Indeed, when studying the characteristics of those living alone among “singles” aged 25 to 34 in the 1990 Korean census, Park (1994) found that the most likely to live alone were those with the lowest level of education.
In short, the relationship between education (and socioeconomic status as indicated by education) and living alone often found in the United States and other Western countries might not be generalizable to Korea. Therefore, studying how education is related to living alone in Korea might significantly expand our knowledge about how living alone depends on specific societal contexts. Moreover, the pattern of educational differentials in living alone might have changed over time along with the increased prevalence of living alone and educational expansion in Korea. Therefore in this study we first examine the changing prevalence of living alone by age and gender across the half-century between the 1960 and 2010 census years. We then investigate how the relationship between education and living alone has changed or persisted during the past three decades from the 1980 to 2010 census years, given the fairly low prevalence of living alone until 1980. Such investigation of the temporal trends will provide further understanding of the complex nature of the relationship between education and living alone.
investigating who is more likely to live alone with respect to educational attainment, and whether the relationship between education and solo living has changed over time.
3. Data and methods
To describe trends in living alone by different age, gender, and educational groups, we use individual-level data from 1% microsamples of the 1960 to 2010 Korean censuses. The Korean census has been conducted every five years except for the year 1966. We categorize adults aged 18 years or over into six age groups for both men and women: 18–24, 25–34, 35–44, 45–54, 55–64, and 65 or over. Note that ages are top-coded at 85 in Korean census data. Our classification of adults into six age groups was also used in a recent brief on the prevalence of living alone among US adults (Wilson and Lamidi 2013), which facilitates comparison of our findings to corresponding figures in the United States.
In the first analysis, we describe trends in the proportion of Korean adults in each age-gender group across ten census years (1960, 1966, 1975, 1980, 1985, 1990, 1995, 2000, 2005, and 2010).5 Using information on the number of household members, we consider those who did not have any other household members to be living alone (i.e., living in a one-person household). We also crosschecked the accuracy of our classification using additional information on relationship to the household head. We confirmed that anyone who lived alone was the head of a household, consistent with the survey design of the Korean census.
Our second analysis focuses on educational differentials in the likelihood of living alone and their temporal trends. As shown below in the analysis of overall prevalence of living alone, living alone started to increase around 1980, so it is impractical to examine educational differentials in living alone before 1980 due to the low overall prevalence. Therefore we examine trends in educational differentials in living alone over the three-decade period from 1980 to 2010, compared to over half a century for the analysis of overall prevalence of living alone. Moreover, from the six age groups used in the analysis of overall prevalence, we focus on two age groups for the analysis of educational differentials (25−34 and 65 or over), because the proportion of Korean women who live alone has increased most dramatically among those aged 65 and over, whereas for Korean men those aged 25 to 34 have shown the largest percentage-point increase in living alone.
5 We decided not to use data from the 1970 census because of the quality: there were only 37 individuals aged
When we examine which educational groups were more likely to live alone, we particularly focus on widowed people aged 65 and over and never-married 25 to 34-year-olds. An individual’s education can affect her or his decision to get married, which in most cases means living together (except for those who are married but live apart). It would be interesting to see how educational expansion has led to the trend of delayed marriage, which would naturally increase the prevalence of solo living among young adults, ceteris paribus. However, as mentioned above, we are not particularly interested in the indirect effect of education on solo living through its impact on marriage. Instead, our main focus in this study is to understand the extent to which a person’s education increases or decreases a genuine propensity for solo living, given a marital status. Our approach of narrowing the focus of analysis to the above two subgroups has also been widely adopted in previous studies that attempted to identify factors associated with the likelihood of living alone (Michael, Fuchs, and Scott 1980; Park 1994).
Korea’s rapid educational expansion over the past few decades has resulted in considerable variations in educational distributions for different age groups and census years (see Park 2007). To accommodate these rapid changes in educational attainment across generations we tailor our classification of educational attainment by age. For the elderly, we classify educational attainment into four: less than elementary school (i.e., those who did not go to school at all and those who went to elementary school but did not complete it), completed elementary school (including those who went to middle school but did not complete it), completed middle school (including those who went to high school but did not complete it), and completed high school or more. For never-married 25 to 34-year-olds, we distinguish those who completed a 2-year junior college degree and those who attained a 4-year university degree from their counterparts who did not pursue tertiary education (i.e., those who completed high school education or less). Because the proportion of never-married 25 to 34-year-olds who did not complete high school has decreased to 5% or below since the 2000 census, there is no meaningful variation that we can use by distinguishing those who did not complete high school from their counterparts with a high school diploma.
estimate the effect of educational attainment, we control for whether a young man or woman is currently working. Because the proportion of the elderly currently working is fairly low, it is not practically feasible to control for working status of the elderly population in the analysis. Instead of working status we controlled for the number of (surviving) children. Note that the number of children is available only for certain census years and only for women. Regardless of whether or not the number of (surviving) children was controlled for, the relationship between education and living alone was very similar. Therefore, we decided to present the results without the number of children because then we can present the results of the same model for all census years and for both genders.
4. Results
4.1 Trends in living alone by age and gender: 1960−2010
Figure 1 shows the percentage of Korean adults (age 18 or older) living alone by gender (men, women, and total) and census year. In 1960 less than 1% of Korean adults lived alone. The percentage increased to 1.6% in 1980, 3.8% in 1990, 6.8% in 2000, and 12.1% in 2010. The increasing proportion of Korean adults living alone seems to have been particularly evident since 1980. Although this trend at the individual level is remarkable, it is also worth noting that in 2010 still only 12 out of 100 Korean adults lived alone. The fact that 24% of Korean households housed only one person in the same year, which news media and other scholars exclusively focused on, should be interpreted carefully in light of the trend at the individual level.
Figure 1: Percentage of Korean adults (18 or over) who lived alone by gender and year
Figure 2: Percentage of Korean women who lived alone by age and year
0 1 2 3 4 5 6 7 8 9 10 11 12 13 14 15
1960 1966 1975 1980 1985 1990 1995 2000 2005 2010
%
Total Female Male
0 5 10 15 20 25 30 35 40 45 50
1960 1966 1975 1980 1985 1990 1995 2000 2005 2010
%
18-24 25-34 35-44 45-54 55-64 65+
We now examine the trends in living alone separately by age group. Figures 2 and 3 present the percentages of Korean women and men who lived alone, respectively, by age and census year. In Figure 2 the increase in the percentage of women living alone is observed for all age groups, but it is particularly substantial among those aged 65 and over. In 1960 only 3% of elderly women lived alone, while 31% did so half a century later. With reduced mortality, the proportion of the elderly who are currently married and live with a spouse has increased (Table 1). Therefore, the increase in the proportion of elderly women living alone reflects mostly an increase in the propensity of the widowed elderly to live alone. The separate line for elderly widows in Figure 2 indicates this trend. In 2010 half of elderly widows lived alone, compared with less than 5% in 1960. Women aged 55 to 64 also demonstrated a steady increase in living alone: 13% of women in that age group lived alone in 2010. However, except for these two older age groups, the percentage of Korean women living alone did not exceed 10% in any of the census years for any other age group.
Figure 3: Percentage of Korean men who lived alone by age and year
0 5 10 15 20 25 30 35 40 45 50
1960 1966 1975 1980 1985 1990 1995 2000 2005 2010
%
The trend for Korean men (Figure 3) shows a somewhat different pattern. First, the most substantial increase in living alone occurred among men aged 25 to 34, not among elderly men. No more than 1% of men aged 25 to 34 lived alone in 1960. However, half a century later the percentage has increased to 15%, which was higher than any other age group. This increase, also seen among women in the same age group, may reflect an increase in the proportion of never-married men due to delayed marriage, even if the propensity to live alone given the marital status has not changed. As in many other countries, Korean young men and women have shown evident trends toward delayed marriage (Park and Lee 2014; Park, Lee, and Jo 2013).6 However, the separate line for never-married 25 to 34-year-old men in Figure 3 shows that the propensity to live alone has indeed increased over time among never-married men. The percentage of men living alone has also increased for other age groups. However, except for the somewhat larger percentage of those living alone among men aged 25 to 34, regardless of their age, Korean men showed a similar level of living alone in 2010, all around 10%. In other words, in 2010 the variation by age in the prevalence of living alone in Korea was much smaller among men than among women.
4.2 Educational differentials in living alone
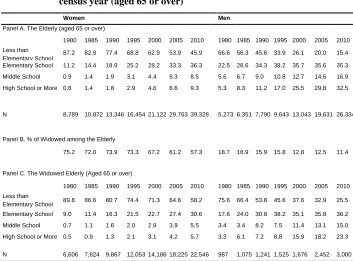
We now examine educational differentials in living alone and their trends over time. Before examining the results of the logit models analyzing trends in living alone and educational differences, we reiterate that educational distributions have changed rapidly during the half century under examination. Panel A in Table 1 displays the distributions (percentages) of educational attainment in each census year for the entire cohort of people aged 65 and over, regardless of marital status. In 1980, 87% of elderly women did not even have elementary school education. This declined sharply to 46% in 2010. Meanwhile the percentage of elderly women with high school education or more increased from less than 1% to 9%. The increased level of educational attainment is similarly observed when only widows of the same ages are considered (Panel C). Only 0.5% of elderly widows had high school or more education in 1980. However, three decades later the corresponding percentage had increased to 6%. Despite similar trends, the overall level of educational attainment tends to be lower among widows than among all elderly women. For instance, the proportion of elderly women who had middle school or higher levels of education was 18% in 2010, but the corresponding proportion for elderly widows was only 11%. Panel B shows that the proportion of widows among
6 Park and Lee (2014) cite statistics from Statistics Korea that the average age at first marriage has increased
women aged 65 and over has decreased over time. In 1980, three out of four women aged 65 and over were widows. In 2010, the proportion had decreased to 57%.
Table 1: Distributions (percentages) of educational attainment by gender and
census year (aged 65 or over)
Women Men
Panel A. The Elderly (aged 65 or over)
1980 1985 1990 1995 2000 2005 2010 1980 1985 1990 1995 2000 2005 2010
Less than Elementary School
87.2 82.8 77.4 68.8 62.9 53.9 45.9 66.6 56.3 45.6 33.9 26.1 20.0 15.4
Elementary School 11.2 14.4 18.9 25.2 28.2 33.3 36.3 22.5 28.6 34.3 38.2 35.7 35.6 35.3
Middle School 0.9 1.4 1.9 3.1 4.4 6.3 8.5 5.6 6.7 9.0 10.8 12.7 14.6 16.9
High School or More 0.6 1.4 1.8 2.9 4.6 6.6 9.3 5.3 8.3 11.2 17.0 25.5 29.8 32.5
N 8,789 10,872 13,346 16,454 21,122 29,763 39,328 5,273 6,351 7,790 9,643 13,043 19,631 26,334
Panel B. % of Widowed among the Elderly
75.2 72.0 73.9 73.3 67.2 61.2 57.3 18.7 16.9 15.9 15.8 12.8 12.5 11.4
Panel C. The Widowed Elderly (Aged 65 or over)
1980 1985 1990 1995 2000 2005 2010 1980 1985 1990 1995 2000 2005 2010
Less than
Elementary School 89.8 86.6 80.7 74.4 71.3 64.6 58.2 75.6 66.4 53.8 45.6 37.6 32.9 25.5
Elementary School 9.0 11.4 16.3 21.5 22.7 27.4 30.6 17.6 24.0 30.8 38.2 35.1 35.8 36.2
Middle School 0.7 1.1 1.6 2.0 2.9 3.9 5.5 3.4 3.4 8.2 7.5 11.4 13.1 15.0
High School or More 0.5 0.9 1.3 2.1 3.1 4.2 5.7 3.3 6.1 7.2 8.8 15.9 18.2 23.3
N 6,606 7,824 9,867 12,053 14,186 18,225 22,546 987 1,075 1,241 1,525 1,676 2,452 3,000
Sources: 1% microsamples from 1980 to 2010.
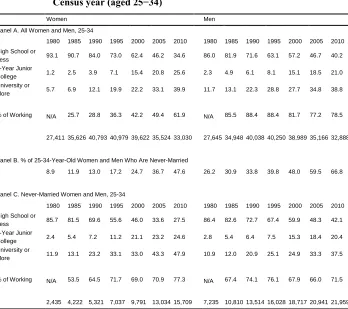
Table 2: Distributions (percentages) of educational attainment by gender and Census year (aged 25−34)
Women Men
Panel A. All Women and Men, 25-34
1980 1985 1990 1995 2000 2005 2010 1980 1985 1990 1995 2000 2005 2010
High School or
Less 93.1 90.7 84.0 73.0 62.4 46.2 34.6 86.0 81.9 71.6 63.1 57.2 46.7 40.2 2-Year Junior
College 1.2 2.5 3.9 7.1 15.4 20.8 25.6 2.3 4.9 6.1 8.1 15.1 18.5 21.0
University or
More 5.7 6.9 12.1 19.9 22.2 33.1 39.9 11.7 13.1 22.3 28.8 27.7 34.8 38.8
% of Working N/A 25.7 28.8 36.3 42.2 49.4 61.9 N/A 85.5 88.4 88.4 81.7 77.2 78.5
N 27,411 35,626 40,793 40,979 39,622 35,524 33,030 27,645 34,948 40,038 40,250 38,989 35,166 32,888
Panel B. % of 25-34-Year-Old Women and Men Who Are Never-Married
8.9 11.9 13.0 17.2 24.7 36.7 47.6 26.2 30.9 33.8 39.8 48.0 59.5 66.8
Panel C. Never-Married Women and Men, 25-34
1980 1985 1990 1995 2000 2005 2010 1980 1985 1990 1995 2000 2005 2010
High School or
Less 85.7 81.5 69.6 55.6 46.0 33.6 27.5 86.4 82.6 72.7 67.4 59.9 48.3 42.1 2-Year Junior
College 2.4 5.4 7.2 11.2 21.1 23.2 24.6 2.8 5.4 6.4 7.5 15.3 18.4 20.4 University or
More 11.9 13.1 23.2 33.1 33.0 43.3 47.9 10.9 12.0 20.9 25.1 24.9 33.3 37.5
% of Working N/A 53.5 64.5 71.7 69.0 70.9 77.3 N/A 67.4 74.1 76.1 67.9 66.0 71.5
N 2,435 4,222 5,321 7,037 9,791 13,034 15,709 7,235 10,810 13,514 16,028 18,717 20,941 21,959
Sources: 1% microsamples from 1980 to 2010.
education.7 Along with educational expansion, the percentage of 25 to 34-year-old women who are currently working also increased substantially, from 26% in 1985 to 62% in 2010.
The rapid expansion of tertiary education is also confirmed when only never-married women age 25−34 are considered (Panel C). The percentage of 25 to 34-year old never-married women with a tertiary education (junior college and university) has increased from 14% to 73% during the past three decades. It is notable that the percentage of never-married women with a tertiary education is actually higher than the corresponding percentage of all women aged 25−34 in every census year. This may reflect the pattern found in earlier studies that in Korea college-educated women are more likely to delay (and possibly forgo) marriage than women without a college education (Park, Lee, and Jo 2013). Also, the temporal trend toward delayed (and forgone) marriage among young women is reflected in the increasing share of never-married women in the entire cohort of women aged 25 to 34 (Panel B).
Korean men aged 25 to 34 also show a substantial increase in educational attainment over time. In our study 14% of men aged 25 to 34 had completed some tertiary education in 1980, whereas 60% had done so three decades later. Similar to women, the share of Korean young men graduating from universities is larger than the share of those graduating from 2-year junior colleges. However, the educational expansion over time has been substantial for 2-year junior colleges as well as universities. When we consider only never-married men in this age group, 14% and 58% of never-married men had tertiary education in 1980 and 2010, respectively. Note that the percentage with a tertiary education is slightly smaller among never-married men than among the entire cohort of men aged 25 to 34, in contrast to the pattern among women. This could in part reflect the positive relationship between men’s education and the transition to marriage in Korea (Park and Lee 2014). Consistent with the trend for women, the share of never-married men in the 25−34 age group increased substantially, from 26% in 1980 to 67% in 2010 (Panel B). Compared to women in the same ages, the share of young men aged 25 to 34 who are currently working has changed little over time, regardless of whether we examine all men in the age group or focus on never-married men only.
The rapid educational expansion for both age groups, illustrated in Tables 1 and 2, requires cautious interpretation with regard to the likelihood of living alone. For
7 In addition to the expansion of higher education, the increased duration of college education might
instance, the social value and meaning of a university degree can differ in a population in which only 12% of a specific age-marital status group has a degree compared to one in which 48% of the group does. Moreover, both the proportion of widows among those aged 65 and over and the proportion of never-married women and men among those aged 25 to 34 have changed over time, adding another layer of complexity to the interpretation of the changing relationship between education and living alone for our two age-marital status groups. When the proportion of a specific marital status group in a given age group changes rapidly over time, its characteristics might also change, making it difficult to compare the effect of education on the likelihood of living alone among the specific marital status group, even if the educational distribution remained constant. As such, we admit that it is a challenge to interpret temporal changes in the effect of education on living alone, accompanied by considerable changes in both educational distributions and the share of a specific marital status group in the population of the age group. Our study is mainly descriptive to precisely document how the relationship between education and solo living given a marital status has changed over time, leaving it to future work to explain why the relationship has or has not changed.
4.3 Living alone among the widowed elderly
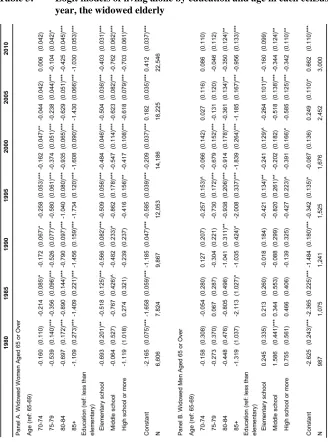
Table 3: Logit models of living alone by education and age in each census year, the widowed elderly
Notes: *** p < .001 ** p < .01 * p < .05 ^ p<.10
To facilitate interpretation of the relationship between education and living alone, in Figure 4.1 we present predicted probabilities of living alone for each educational group of widows in each census year calculated from the results in Panel A of Table 3. Specifically, the predicted probabilities presented in Figure 4.1 are calculated for widows aged 65 to 69 (the reference group). The most evident trend in the figure is the increase in the share of widows who live alone. In 1980 no more than 10% of widows aged 65 to 69 were predicted to live alone, regardless of educational attainment. Three decades later the predicted probability increased to 60% for 65 to 69-year-old widows with less than elementary school education, to 49% for those with elementary school education only, and to 41% for those with middle school education. 43% of widows in the same age group with high school or more education were predicted to live alone.
Figure 4.1: Predicted probability of living alone among widowed women aged 65−69 by year and education
Despite the rising trend of living alone across educational levels, Figure 4.1 shows that 65 to 69-year-old widows with the lowest level of education have consistently had the highest probability of living alone compared to those with any other education level in all census years except 1985. Moreover, the rise of living alone has been more
0 10 20 30 40 50 60 70
1980 1985 1990 1995 2000 2005 2010
%
Year
Less than Elementary School Elementary School
substantial over time for widows with the lowest two levels of education than for widows with the highest two levels of education. Specifically, the predicted probability of living alone among widows with less than elementary school education has increased by 50 percentage points, from 10% in 1980 to 60% in 2010, whereas the corresponding probability of widows with elementary school education has increased by 45 percentage points, from 5% to 50%. In 1980, widows with middle school education showed a similar probability to widows with the lowest level of education. Three decades later, however, the predicted probability is lower by 19 percentage points among widows with middle school education than among those with the lowest level of education. Except for the exceptionally low level of living alone in 1980, the rise of living alone from 1985 to 2010 among widows with high school education or more has been relatively modest compared to the rise for the lowest two levels of education. Like the result of differential trends across educational levels, the gap in the predicted probability of living alone between widows with less than elementary school education and with the highest two levels of education has diverged in terms of the absolute percentage difference.
Looking at the results in Panel B of Table 3 for widowers, we see that the relationship between widowers’ education and living alone has changed since 1990. In both 1980 and 1985, compared to widowers who did not finish elementary school, their counterparts with elementary school education or more did not show lower odds of living alone. Actually they show rather higher odds, if any, as indicated by the significantly positive coefficient of middle school education in 1980. However, the relationship turns negative after 1990 and the negative relationship becomes significant from 1995. Although the magnitude varies across census years, widowers with more education tend to show lower odds of living alone than those with the lowest level of education.
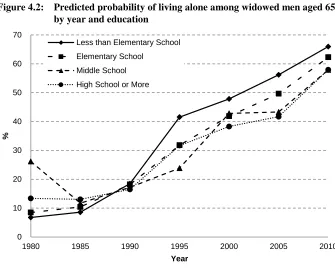
Similar to Figure 4.1 for widows, Figure 4.2 illustrates how the predicted probability of living alone has changed over time among 65 to 69-year-old widowers with different levels of education. The changing relationship between education and living alone around 1990 is clear. After 1995, widowers with the lowest level of education continue to show a higher probability than those with any other level of education. By 2010 widowers with the lowest two levels of education show higher probabilities compared to those with the highest two levels of education.8 In short, for both widowers (since 1995) and widows, the relationship between education and living
8 In the logit model for census 2010, Table 3 shows that widowers with middle school education and
alone has been consistently negative, and this negative relationship has become more evident.9
Figure 4.2: Predicted probability of living alone among widowed men aged 65-69 by year and education
4.4 Living alone among never-married men and women aged 25 to 34
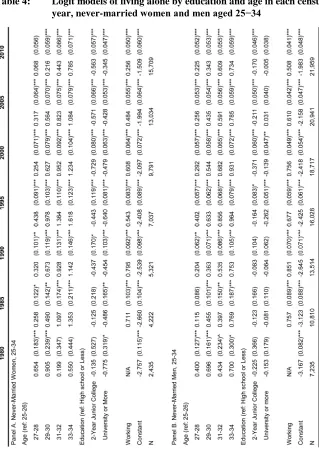
Table 4 displays the results for never-married 25 to 34-year-old Koreans. Note that compared to Table 3, in Table 4 we additionally control for working status when we
9 In a supplementary analysis, we further distinguished widowers with tertiary education (junior college and
university) from widowers with a high school diploma in the census 2010 data, which had 219 widowers with tertiary education. We found that widowers with tertiary education indeed showed the lowest odds of living alone, although the differences to widowers with middle school or high school education were not statistically significant. We also conducted the same supplementary analysis for widows with tertiary education (N = 271) and found that widows with tertiary education had significantly lower odds than widows with the lowest two levels of education and no difference from widows with middle school or high school education.
0 10 20 30 40 50 60 70
1980 1985 1990 1995 2000 2005 2010
%
Year
Less than Elementary School Elementary School
estimate the effects of education on living alone for young adults, except for the year 1980 (because working status information is not available in the 1980 census data). Panel A shows that in all census years, except for the coefficients of 2-year junior college in 1980 and 1985 which are negative but insignificant, never-married women aged 25 to 34 with some tertiary education have significantly lower odds of living alone than those with less than a tertiary education. Although the relative magnitude of university education over 2-year junior college education varies over time and often the size of the negative effect of university education is smaller than that of 2-year junior college education, the evident pattern in Panel A is the significant difference between never-married women with and without tertiary education.
Similar to Figures 4.1 and 4.2, we calculated the predicted probability of living alone among never-married 25 to 26-year-old women who are currently working for each level of education and census year using the estimation results in Panel A of Table 4 (the 25-26 age group is the reference group). Figure 5.1 presents the predicted probabilities from 1985 to 2010, because working status is not available in 1980. We see the rise of living alone over time for all three educational groups. But notable is the continuously higher probability of living alone among never-married 25 to 26-year-old women without tertiary education than among their counterparts with 2-year junior college or university education.
Figure 5.1: Predicted probability of living alone among never-married women who are working, aged 25-26 by year and education
0 5 10 15 20 25
1985 1990 1995 2000 2005 2010
%
Year
Table 4: Logit models of living alone by education and age in each census year, never-married women and men aged 25−34
Notes: *** p < .001 ** p < .01 * p < .05 ^ p<.10
Turning to the results for never-married 25 to 34-year-old men in Panel B of Table 4, we find much smaller numbers of significant coefficients than in the results for women in Panel A. None of the education effects are significant for 1980, 1985, and 1990. The effect of university education is not significant in 2005 and 2010. In other words, evidence for the negative relationship between education and living alone is much weaker among never-married men aged 25 to 34 than never-married women of the same ages. However, it is also notable that there is no evidence for the positive relationship between education and living alone. The statistically significant coefficients in Panel B are actually all negative, indicating that never-married young men with 2-years of junior college or a university education have lower odds of living alone than those without tertiary education.
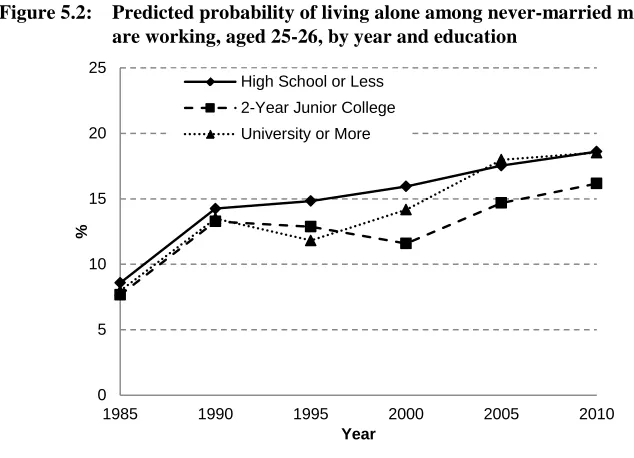
Figure 5.2 presents the predicted probability of living alone for never-married 25 to 26-year-old men, who are currently working, by education across each census year using the results in Panel B of Table 4. Compared to Figure 5.1 for young women, the differences between educational groups are substantially smaller for young men. In particular, there is no difference between never-married 25 to 26-year-old men with high school education and those with university education in the recent two census years. However, those with 2-year junior college education still have a significantly lower probability of living alone in recent census years than those without tertiary education.
Figure 5.2: Predicted probability of living alone among never-married men who are working, aged 25-26, by year and education
0 5 10 15 20 25
1985 1990 1995 2000 2005 2010
%
Year
Although age differences in the likelihood of living alone are not our focus, we will briefly discuss the results from the logit models. Although not all the coefficients of age groups (relative to the reference age group of 65−69) in Table 3 are statistically significant, they tended to become increasingly negative for older age groups for both widows and widowers. In other words, the older widowed elderly had lower odds of living alone than the younger widowed elderly. Presumably, as the elderly get older, they increasingly experience the need to live with someone who can take care of them. By contrast, the relationship between age and living alone was the opposite among never-married Koreans aged 25 to 34 (Table 4), where age was generally associated with increased odds of living alone for both women and men. Finally, both never-married young men and women who are currently working are more likely to live alone than those who are not working, as indicated by significantly positive coefficients of working status across all census years.
5. Conclusions
Research in the United States often depicts living alone as principally a middle-class living arrangement, in which economic resources that allow solo living are an important factor (Klinenberg 2012; McGarry and Schoeni 2000). However, it is not yet clear how straightforwardly this image of living alone can be applied to other societies, especially those where living together has long been a cultural tradition, as in Korea. To understand the nature of solo living and identify the economic and social needs of those who live alone, it is critical to carefully examine the demographic and socioeconomic characteristics of those who live alone. In particular, more studies in non-Western countries are needed, as they can expand the understanding of how the prevalence of solo living and the characteristics of those who live alone vary depending on the specific societal contexts.
Our investigation of long-term trends over a half-century in Korea shows a continued increase in solo living among Koreans, which is generally consistent with the trend observed in many other countries. It is likely that to some extent the increase in solo living reflects various trends such as increased life expectancy, reduced number of children, and delayed marriage, depending on the relevant groups. However, it is also important to note that we found an increasing trend of solo living within specific marital-status groups, such as elderly widows and never-married men aged 25 to 34. In other words, an important and major change that drives overall increases in solo living is the sharp increase in the propensity to live alone given a certain marital status.
widows aged 65 or over are more likely to live with someone than are their less-educated counterparts. Except for 1985, widows with the lowest level of education have the highest probability of living alone. This negative relationship between education and the likelihood of living alone has become even stronger over time, to the extent to which the gap in the probability of living alone between widows with the lowest levels and widows with the highest two levels of education has diverged. Although the educational gaps in living alone among widowers are relatively narrower than the corresponding gaps among widows, the negative relationship between education and living alone is generally observed for widowers as well, especially since 1995.
It is important to notice that this pattern of the negative relationship between education and solo living is observed not only for the elderly but also for never-married young adults in the 25 to 34 age group. Never-married young women with high school education or less were consistently more likely to live alone than their counterparts with tertiary education across most census years. In other words, despite the change in the distribution of educational attainment and the change in the proportion of never-married women in the age group across years, the relationship between education and solo living has been consistently negative over the past three decades among never-married women aged 25 to 34. Meanwhile, education has a relatively tenuous relationship with solo living among never-married 25 to 34-year-old men. For instance, in recent census years those with university education do not differ in their probability of living alone from those without tertiary education. However, some significant effects of education are negative, indicating that never-married young men with high school education or less are more likely to live alone compared to their counterparts with more education, particularly those with 2-year junior college education.
As we pointed out earlier, education might also reflect one’s cultural and personal disposition toward valuing more (and possibly also less) independence, which could have an impact on our findings. In this regard, future work should use more direct measures that can better assess economic resources such as income and wealth, in order to identify the effect of material affluence on the likelihood of living alone separately from the effect of educational attainment, which possibly also includes the influence of cultural values. Moreover, qualitative studies that explore subjective meanings of living alone, particularly for different educational and socioeconomic groups, would greatly advance the understanding of why people with different levels of education vary in their likelihood of living alone and what the underlying causes are.
Finally, we expect that cross-national comparative research on living alone, particularly among East Asian countries, can significantly expand our understanding of how the pattern of living alone is shaped by cultural, economic, and societal contexts. Although they have been declining over time, cultural values and norms of intergenerational coresidence are still substantial in East Asian countries (Yasuda et al. 2011). Moreover, family ties have been particularly important resources for family members’ well-being. Therefore, these similarities in the cultural and family contexts of East Asian countries, particularly Japan, Korea, and Taiwan, provide an excellent opportunity for assessing whether the negative relationship between education (and socioeconomic status) and living alone, found in our study for Korea, can be generalized to other East Asian countries. The above three East Asian countries are also similar in their weak welfare systems. Therefore, the negative relationship between education (and socioeconomic status) and living alone, if found in other East Asian countries as well, may indicate particularly difficult conditions of those at the lower end of the socioeconomic hierarchy who live alone without much support from family and state.
6. Acknowledgements
References
Card, D. (1999). The causal effect of education on earnings. In: Ashenfelter, O. and Card, D. (eds.). Handbook of Labor Economics. Amsterdam: North Holland: 1801−1863. doi:10.1016/S1573-4463(99)03011-4.
Chang, M.S. and Park, K.S. (2012). Factors affecting life satisfaction for the aged: From the ecosystem perspective. Health and Social Welfare Review 32(2): 232−266 (in Korean). doi:10.15709/hswr.2012.32.2.232.
Cho, Y.-J. (2012). A study on the satisfaction of grandchild rearing activities: Focused on the elders’ generativity and family support. Health and Social Welfare Review 32(2): 267−294 (in Korean). doi:10.15709/hswr.2012.32.2.267.
Choi, K. (2002). An analysis of returns to schooling in Korea. Korea Review of Applied Economics 4(2): 5−30 (in Korean).
Choi, Y. (2013). Attracting solos: Rapid rise of ‘solo economy’. Weekly Kyunghyang
1038 (in Korean).
Chung, W. (2012). Is the voting rate of one-person households low? Weekly Kyunghyang 975 (in Korean).
Fischer, C.S. and Hout, M. (2006). A Century of Difference: How America changed in the last One Hundred Years. New York, NY: Russell Sage Foundation.
Han, J. and Lee, Y. (2013). Impact of increasing one-person households on consumption. KIET Industrial Economy June: 22−31 (in Korean).
Jamieson, L., Wasoff, F., and Simpson, R. (2009). Solo-living, demographic and family change: The need to know more about men. Sociological Research Online 14(2). doi:10.5153/sro.1888.
Jung, J. and Choi, H. (2013). The effect of schooling of farm household members on household income. Journal of Agricultural Education and Human Resource Development 45(1): 1−23 (in Korean).
Klinenberg, E. (2012). Going Solo: The Extraordinary Rise and Surprising Appeal of Living Alone. New York: Penguin.
Lee, H. and Ronald, R. (2012). Expansion, diversification, and hybridization in Korean public housing. Housing Studies 27(4): 495−513. doi:10.6107/JKHA.2012.23.4. 049.
Lee, M.-A., Kim, J., and Kang, J. (2011). Living arrangement and the life satisfaction of Korean older adults: Examining the mediating effects of parent-adult child relationship. Public Health and Social Sciences 29: 41−67 (in Korean).
Lodovici, M.S., Semenza, R., Rosa, E.D., Fregoni, M., Naaf, S., Patrizio, M., Pesce, F., and Pinoli S. (2012). Women Living Alone: An Update. Brussels: European Parliament.
McGarry, K. and Schoeni, R.F. (2000). Social security, economic growth, and the rise in elderly widows’ independence in the twentieth century. Demography 37(2): 221−236. doi:10.2307/2648124.
Michael, R.T., Fuchs, V.R., and Scott, S.R. (1980). Changes in the propensity to live alone: 1950-1976. Demography 17(1): 39−56. doi:10.2307/2060962.
Park, H. (2013). Transition to adulthood among Korean youth: Transition markers in productive and reproductive spheres. The Annals of the American Academy of Political and Social Science 646: 129−148. doi:10.1177/0002716212467947. Park, H. (2007). Inequality of educational opportunity in Korea: Gender, socioeconomic
background, and family structure. International Journal of Human Rights 11: 179−197. doi:10.1080/13642980601176324.
Park, H. and Lee, J.K. (2014). Growing educational differentials in the retreat from marriage among Korean men [unpublished manuscript]. Philadelphia: University of Pennsylvania.
Park, H., Lee, J.K., and Jo, I. (2013). Changing relationships between education and marriage among Korean women. Korean Journal of Sociology 47(3): 51−76. Park, H. and Raymo, J.M. (2013). Divorce in Korea: Trends and educational
differentials. Journal of Marriage and Family 75(1): 110−126. doi:10.1111/j.17 41-3737.2012.01024.x.
Park, H. and Sandefur, G.D. (2005). Transition to adulthood in Japan and Korea: An overview. Sociological Studies of Children and Youth 10: 43−73. doi:10.1016/S 1537-4661(04)10004-4.
Park, Y.J. (1994). The rise of one-person households and their recent characteristics in Korea. Korea Journal of Population and Development 23(1): 117−129.
Qian, Z. (2012). During the great recession, more young adults lived with parents. Census Brief prepared for Project US2010. http://www.s4.brown.edu/us2010/. Reher, D.S. (1998). Family ties in Western Europe: Persistent contrasts. Population and
Development Review 24(2): 203−234. doi:10.2307/2807972.
Ruggles, S. (1996). Living arrangements of the elderly in America: 1880-1980. In: Hareven, T. (ed.). Aging and Generational Relations: Historical and Cross-cultural Perspectives. New York: Aldine de Gruyter: 254−263. doi:10.1515/978 3110875522.254.
Ruggles, S. and Brower, S. (2003). Measurement of household and family composition in the United States, 1850-2000. Population and Development Review 29(1): 73−101. doi:10.1111/j.1728-4457.2003.00073.x.
Statistics, Korea (2012). Changes in population and household structure and residential characteristics. Media report (March 21) (in Korean).
Stone, J., Berrington, A., and Falkingham, J. (2011). The changing determinants of UK young adults’ living arrangements. Demographic Research 25: 629−665. doi:10. 4054/DemRes.2011.25.20.
Su, B. and Heshmati, A. (2013). Analysis of the determinants of income and income gap between urban and rural China. Bonn: The Institute for the Study of Labor, (IZA Discussion Paper No. 7162).
U.S., Census Bureau (2012). Table 1. Educational attainment of the population 18 years and over, by age, sex, race, and Hispanic origin: 2012. Current Population Survey, Annual Social and Economic Supplement. http://www.census.gov/hhes/socdemo/education/data/cps/2012/tables.html. Wilson, B. and Lamidi, E. (2013). Living alone in the U.S., 2011. National Center for
Family & Marriage Research, (FP-13-18). http://ncfmr.bgsu.edu/pdf/ family_profiles/file138254.pdf.