in the population sciences published by the Max Planck Institute for Demographic Research Konrad-Zuse Str. 1, D-18057 Rostock · GERMANY www.demographic-research.org
DEMOGRAPHIC RESEARCH
VOLUME 22, ARTICLE 26, PAGES 813-862
PUBLISHED 04 MAY 2010
http://www.demographic-research.org/Volumes/Vol22/26/ DOI: 10.4054/DemRes.2010.22.26
Research Article
Comparisons of infant mortality
in the Austrian Empire
Länder
using the
Tafeln
(1851-54)
Gianpiero Dalla-Zuanna
Fiorenzo Rossi
© 2010 Gianpiero Dalla-Zuanna & Fiorenzo Rossi.
This open-access work is published under the terms of the Creative Commons Attribution NonCommercial License 2.0 Germany, which permits use, reproduction & distribution in any medium for non-commercial purposes, provided the original author(s) and source are given credit.
1 Introduction 814 2 Typology and quality of data 817 3 Life tables for ages 0-3 for the cohort born in 1851 827 4 A brief discussion of territorial differences 846 5 Was there discrimination against female children? 847
6 Conclusions 857
Comparisons of infant mortality in the
Austrian Empire Länder using the Tafeln (1851-54)
Gianpiero Dalla-Zuanna1
Fiorenzo Rossi2
Abstract
In this paper we measure differences in infant mortality among the central European populations of the Austrian Empire during the mid-19th century using data published in the Tafeln zur Statistik der Österreichischen Monarchie (Statistical Tables of the Austrian Monarchy). Our aim is mainly methodological, i.e., to illustrate the extraordinary richness of this data, and to discuss whether the quality of the material on infant mortality published around 1850 in the Tafeln guarantees comparability between regions. This article demonstrates that – with several exceptions – the quality of the material on infant mortality published in the Tafeln around 1850 guarantees reliable comparability between the Empire’s Länder. Data on sex, age at death, and legitimacy were all recorded with great accuracy. This article – of a methodological nature – provides only a few examples of potential analyses which might be carried out using such rich and detailed territorial data. The geography of mortality in the first three years of life varied by age, but according to intervals different than those usually employed when studying early mortality. Four ages can be identified (first month, months 1-5, months 6-17, and months 18-35) with a geography of differing mortality. In all likelihood, in these four age groups, mortality differences between Länder were motivated by diverse reasons.
1. Introduction
In this paper we measure differences in infant mortality among the central European populations of the Austrian Empire during the mid-19th century using data published in
the Tafeln zur Statistik der Österreichischen Monarchie (Statistical Tables of the Austrian Monarchy). Our aim is mainly methodological, i.e., to illustrate the extraordinary richness of this data, and to discuss whether the quality of the material on infant mortality published around 1850 in the Tafeln guarantees comparability between regions. A brief premise concerning the meaning of such an analysis provides additional support for this important methodological investigation.
Over the last few decades, numerous studies have sought to explain historical differences in the risk of dying during the earliest stages of life (see, e.g., Vallin 1991; Lee 1991; Preston and Haines 1991; Bideau, Desjardins, and Pérez Brignoli 1997; Corsini and Viazzo 1997; Bengtsson, Campbell, and Lee 2004; Breschi and Pozzi 2004). Thus far, however, a complete comparative map of infant mortality for the regions of Europe from 1650-1900 is not available. Two important patterns remain less than fully explained. First, although the risk of dying during the first year of life during the ancien régime was everywhere higher than 100‰, considerable differences existed between populations living in adjacent regions and countries (Livi Bacci 1997: point 2). Second, secular trends may have significantly varied between neighbouring populations (Livi Bacci 1997: point 6). Although these issues are not easily disentangled, they are crucial to understanding the historical determinants of infant mortality. The Tafeln are potentially an important source for examining infant mortality in the Austrian Empire during the first half of the 19th century, and for exploring the patterns mentioned above. In this paper, we focus on the first pattern, measuring differences in infant mortality among mid-19th-century Länder through use of published data in the Tafeln. The second
issue will be analysed in the near future.3
The Tafeln include about 20 of the large Empire’s Länder (regions), which during 1815-1861 were home to about 35 million people, and extended from Milan, now in Italy, to Ternopil, now in Ukraine (about 1,200 km West-East); and from Krakow, now in Poland, to Kotor, now in Montenegro (about 1,000 km North-South). This area was characterised by much orographic, climatic, cultural, religious, linguistic and economic
diversity (Table 1 and Figure 1). On the other hand, given the common political (and centralistic) administration across the Länder, it is possible that data was collected following similar norms and procedures. With regard to several aspects concerning infant mortality this is only partially true, although territorial comparability indubitably remains better than in other ancien régime contexts. Moreover, the Tafeln are now available for the period of 1829-65, albeit with different details and territorial coverage. The latter include not only a plethora of demographic information, but also data on the economy and social life. Finally, several time series are long enough to allow for a comparison of temporal trends.
In the following section, we discuss the typology of the data and their quality (completeness, age-heaping, etc.). In the third section, we illustrate the methodology employed to build a life table for the first three years of age for the cohort born in 1851. Age at death is classified in months for the first three months of life, quarterly until the first birthday, bi-yearly until the second birthday, and then annually for the third year of life. For each region, it is possible to calculate life tables for these ages by sex and legitimacy. Data on stillbirths were also collected, although their quality seems relatively poor. The last sections are dedicated to a preliminary discussion of the differences in infant mortality among the Austrian Empire Länder during the mid-19th
century.
Figure 1: The Austrian Empire and its Länder
Table 1: Population of the Länder of the Austrian Empire, 1.1.1851
n Länder Males Females Total
% of total Empire
1 Oesterreich unter der Enns 750,092 787,955 1,538,047 4.23
2 Oesterreich ob der Enns 338,041 368,275 706,316 1.94
3 Salzburg 70,032 75,975 146,007 0.40
4 Steiermark 487,124 518,820 1,005,944 2.76
5 Kärnthen 150,579 168,645 319,224 0.88
6 Krain 219,756 244,200 463,956 1.27
7 Görz, Gradisca, Istrien, Triest
sammt Gebiet 270,548 272,369 542,917 1.49
8 Tirol und Vorarlberg 422,439 435,764 858,203 2.36
9 Böhmen 2,058,645 2,327,249 4,385,894 12.05
10 Mähren 845,734 954,104 1,799,838 4.94
11 Schlesien 202,991 235,595 438,586 1.20
12-13 Krakau und Galizien 2,198,477 2,357,000 4,555,477 12.52
14 Bukowina 188,873 191,953 380,826 1.05
15 Dalmatien 195,871 197,844 393,715 1.08
16 Lombardie 1,383,874 1,360,244 2,744,118 7.54
17 Venedig 1,134,377 1,145,622 2,279,999 6.26
18 Ungern 3,889,269 3,974,993 7,864,262 21.61
19 Serbische Wojwodschaft und
Temeser Banat 716,580 709,641 1,426,221 3.92
20 Kroatien und Slavonien 434,449 434,007 868,456 2.39
21 Siebenbürgen 1,028,577 1,045,160 2,073,737 5.70
22 Militärgränze 450,739 508,138 958,877 2.63
Hierzu das k. K. Militar 648,000 − 648,000 1.78
Total Empire 18,085,067 18,313,553 36,398,620 100.00
2. Typology and quality of data
As mentioned above, the data come from a large collection of information known as the Tafeln. Published between 1829 and 1871 (referencing the period of 1828-65), the Tafeln zur Statistik der Österreichischen Monarchie represent an important stage in the history of public statistics. The evolution of the quantity and quality of the statistics is quite evident. Beginning with only a small office within the Accounting Governance Checks, the management of statistics later passed, in 1840, to the Statistical Administrative Directorate under the Presidium of the Accounting General Directorate; in 1848, it was moved again, this time directly under the Ministry of Commerce, Industry, and Public Works. The first edition contained 104 statistical tables addressing a variety of topics: territory and population, the economy, justice, schools, administration, etc. The 1846 edition (containing data collected in 1841) was renovated in part through the use of printed lead characters, which replaced the manual lithographic edition which preceded it. In addition, the data (with the exception of military and financial information) were made public; beginning in 1846, the Tafeln became available in many public libraries. In 1856, a new series was published, containing data from the period 1849-1856. Starting in 1860, the Tafeln came out every five years. The last edition was published in 1871, using data from 1860-1865. In the years that followed, the Tafeln were substituted by statistical yearbooks and periodical publications focusing on specific issues.
Data relative to the period of 1851-1854 are particularly rich and detailed. Of interest to this paper, births and deaths were recorded in terms of vitality, legitimacy, and sex (eight modalities in total). Death during the first three years of life was differentiated according to nine separate age classifications, as indicated above. Data are available for all of the Länder, with only a few exceptions (see Table 2).
Religious authorities (priests in the Catholic parishes, pastors in the Protestant parishes, rabbis in the Jewish communities, etc.) also served as civil status officials. In this capacity they were responsible, on behalf of the State, for updating the standardised and pre-printed registers of weddings, births, and deaths (which often mirrored those of religious nature). The Tafeln calculations are based upon the data contained in these civil registers.
first three years, while data on births are missing for 1851. Other shortages of data or discrepancies can be overcome. For example, data on both births and deaths for Görz, Gradisca und Istrien were published separately from Triest sammt Gebiet only in the year 1851; in this paper, we always combine them. For the following three Länder, Lombardie, Venedig, and Serbische Wojwodschaft und Temeser Banat, the number of births (B51) for 1851 was published, but not the number of deaths (D51). We thus
estimated the latter, age by age, assuming the same infant mortality as that of 1852: D51=D52x(B51/B52). A check using the cohort of 1852, focusing on the first year of life,
gave reassuring results. Finally, 1851 data for Serbische Wojwodschaft und Temeser Banat include only the total of live births and stillbirths. This distinction is estimated using the same proportion found among the 1852 births.
Table 2: Data on births and deaths under the age of 3.
Länder of the Austrian Empire, 1851-54
n KronLänder Births (*) Deaths aged 0-2 (**)
1a Wien
1b Oesterreich unter der Enns
Separate data for the city of
Wien only in 1851-52 No data for Wien in 1851-52
2 Oesterreich ob der Enns Complete Complete
3 Salzburg Complete Complete
4 Steiermark Complete Complete
5 Kärnthen Complete Complete
6 Krain Complete Complete
7a Görz, Gradisca und Istrien 7b Triest sammt Gebiet
Separate data for the city of Triest only in 1851
Separate data for the city of Triest only in 1851
8 Tirol und Vorarlberg Complete Complete
9 Böhmen Complete Complete
10 Mähren Complete Complete
11 Schlesien Complete Complete
12 Krakau sammt Gebiet Complete Complete
13 Galizien Complete Complete
14 Bukovina Complete Complete
15 Dalmatien Complete No data for the four years
16 Lombardie Complete No data in 1851
17 Venedig Complete No data in 1851
Table 2: (Continued)
n KronLänder Births (*) Deaths aged 0-2 (**)
19 Serbische Wojwodschaft und das Temeser Banat
Only total live births and stillbirths by sex in 1851. Missing data for stillbirths in 1853-54
No data in 1851
20 Kroatien und Slavonien No data in 1851; Only total
live births and stillbirths by sex in 1852-53
No data in 1851-53
21 Siebenbürgen Complete Complete
22 Militärgränze Complete Complete
(*) Data available by sex, legitimacy, and vitality (2x2x2=8 categories).
(**) Data available by sex, legitimacy, and age (in months for the first three months, quarterly until the fifth birthday, bi-yearly until the second birthday, annually for the third year of life (2x2x9=36 categories).
Other authors have considered the demographic balance for years adjacent to the census in order to check the consistency of births, deaths, and census counts (Findl 1979; Ediev and Gisser 2007:338). Those works indicated that there was good coverage of births and deaths, but a sort of “shortage” of infants in census counts for the Austrian Alpenländer. We assess the coverage of the recorded data on births and deaths without considering census data, but using some simple devices. One is to verify whether the sex ratio, taking into account the large scale of the observations, varies significantly from a ratio of 105-106 male births for every 100 female births. This ratio hardly differs across human populations, independent of space and time. Higher values indicate a tendency to ‘under-register’ female infants. For the years under consideration, we observe little more than 106 males for every 100 females, for a total of about 1.4 million live births registered every year (Table 3). In several cases, this value shifts away from the reference ratio, although this occurs predominantly in the relatively small populations. In the more populous regions (Böhmen, Galizien, Ungern), the sex ratio is quite close to 106.
Table 3: Sex ratio for live births (100·M/F).
Länder of the Austrian Empire, 1851-54
n KronLänder
Births
in 1851 1851 1852 1853 1854
1a Wien 21,191 104.1 105.3 − −
1b Oesterreich unter der Enns (*) 40,162 104.8 107.3 104.3 105.1
2 Oesterreich ob der Enns 20,964 102.7 104.8 107.8 105.9
3 Salzburg 4,095 103.1 110.9 104.8 112.4
4 Steiermark 29,982 103.8 106.3 105.4 104.7
5 Kärnthen 9,297 106.8 106.9 106.1 107.4
6 Krain 13,879 102.3 105.1 102.1 105.0
7 Triest,Görz, Gradisca, Istrien (**) 19,354 104.8 106.0 103.1 104.4
8 Tirol und Vorarlberg 26,892 106.6 106.7 107.5 105.7
9 Böhmen 187,335 106.8 106.8 106.3 105.3
10 Mähren 77,019 105.4 106.4 106.1 106.2
11 Schlesien 18,393 104.8 104.4 107.7 107.0
12 Krakau sammt Gebiet 6,320 105.5 102.4 96.9 104.5
13 Galizien 190,145 106.3 106.9 106.7 106.8
14 Bukovina 12,839 105.9 107.6 108.0 103.9
15 Dalmatien 12,994 109.2 106.8 106.9 96.8
16 Lombardie 106,441 106.0 106.9 107.1 107.7
17 Venedig 88,942 107.1 106.7 106.1 107.4
18 Ungern 363,926 105.9 105.5 106.0 105.8
19 Serbische Woiwodschaft und Temeser Banat (***) 68,191 106.3 104.7 105.1 106.8
20 Kroatien und Slavonien (****) 38,326 − 107.5 103.5 106.2
21 Siebenbürgen 76,937 107.0 106.5 106.5 106.7
22 Militärgränze 43,321 105.6 107.7 106.0 105.3
Total Empire 106.0 106.3 106.1 106.0
(*) 1853 and 1854 Wien included.
(**) In 1851 Görz, Gradisca und Istrien 104.9 with 15,135 births; Triest 104.5 with 4,219 births. (***) 1851 calculated on total live births and stillbirths.
(****) 1852 and 1853 calculated on total live births and stillbirths (38,326 in 1852).
among Länder also suggests that the registering criteria were not entirely homogeneous. Nonetheless, understanding the direction of these differences is not simple given that – with the Länder considered as statistical units – the territorial correlation between stillbirths and mortality in the first month of life is next to zero. The sex ratio, on the other hand, is closer to ‘normal’ (136 male stillbirths for every 100 female stillbirths), and is similar to ratios seen in other contexts during this period (an average of 134 in Italy during 1861-1900, Istat 1976), as is the higher percentage of illegitimate infants among stillbirths (18.5%) than among live births (8.3%).
Figure 2: Sex ratio at birth (100 x M/F) by number of births and 95% confidence intervals. Länder of the Austrian Empire, 1851-54
90 95 100 105 110 115 120
1000 10000 100000 1000000
number of births min max 106 M/F %
sort of data. In constructing the life table, we chose not to consider stillbirths, and henceforth estimates of infant mortality indictors are based on live births.
Table 4: Stillbirths: proportion and sex ratio.
Länder of the Austrian Empire, 1851-54
Stillbirths on the sum of live births and stillbirths (%)
% M/F (stillbirths)
KronLänder 1851 1852 1853 1854
Average 1851-54
Wien 4.1 4.3 − − 129.4
Oesterreich unter der Enns (*) 2.5 2.2 2.8 3.1 127.6
Oesterreich ob der Enns 2.1 2.1 2.2 2.2 127.5
Salzburg 1.7 1.6 1.9 1.8 151.1
Steiermark 2.3 2.4 2.3 2.5 124.8
Kärnthen 1.2 1.6 1.9 1.6 133.4
Krain 1.4 1.5 1.6 1.5 137.2
Triest, Görz, Gradisca, Istrien (**) 2.1 2.4 2.3 2.5 139.7
Tirol und Vorarlberg 1.1 1.0 0.9 0.9 171.9
Böhmen 2.4 2.4 2.3 2.3 129.1
Mähren 1.5 1.7 1.8 1.6 128.4
Schlesien 2.0 2.4 2.1 1.8 130.0
Galizien 1.2 1.4 1.4 1.4 138.4
Krakau sammt Gebiet 2.2 2.2 2.1 1.9 142.0
Bukovina 0.3 1.0 1.1 1.0 160.1
Dalmatien 0.3 0.1 0.1 0.3 144.5
Lombardie 1.3 1.7 1.8 1.7 167.2
Venedig 1.1 1.6 1.5 1.3 169.6
Ungern 1.0 1.2 1.1 1.2 132.0
Siebenbürgen 0.8 1.1 0.9 0.9 131.5
Militärgränze 0.9 1.3 1.3 1.4 134.6
Serbische Woiwodschaft und Temeser Banat − 0.6 − − 131.1
Kroatien und Slavonien − − − 0.7 136.2
Total Empire 1.4 1.6 1.5 1.5 136.2
(*) 1853 and 1854 Wien included.
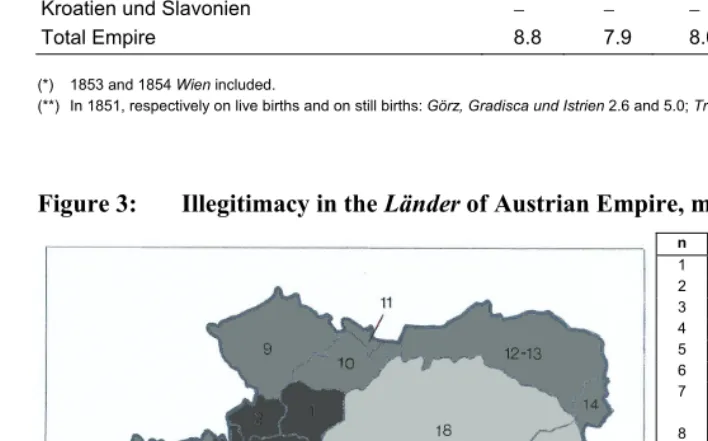
In the Tafeln, births are systematically differentiated by legitimacy (Table 5). Variability between regions is substantial, ranging from over 50% illegitimate births in Vienna (this indicator decreases to 26% when considering the entire territory of Oesterreich unter der Enns), to only 1%-3% in several of the eastern and southern Austrian Empire Länder (Dalmatien, Militärgränze, Serbische Wojwodschaft und Temeser Banat, Venedig). Finally, in 1851, it is possible to observe the difference between Triest (21.9%) and its territory (Görz, Gradisca, Istrien: 2.6%); in the years that followed, however, the data are combined. The high levels observed in Vienna and Trieste may be related to the urban concentration of foundling institutes. More generally, the considerable differences between groups of Länder may be due to different legislation governing marriage. In places where the percentage of illegitimate births is systematically higher – for the most part, German-speaking Länder located in the area which, after 1918, became the Republic of Austria – there were strong legal restrictions on marriage for the poor (Prioux 1993; for Tirol-Vorarlbelg, and mainly the county of Trento, see also Grandi 1995). With regard to legitimacy levels, three groups of Länder can be identified, revealing a certain degree of territorial continuity (Figure 3): high level of illegitimacy (20% or higher during 1851-1854): Oesterreich unter der Enns, Oesterreich ob der Enns, Salzburg, Steiermark, and Kärnthen; medium (5%-20%): Krain, Görz Gradisca und Istrien Triest sammt Gebiet, Tirol und Vorarlberg, Böhmen, Mähren, Schlesien, Krakau sammt Gebiet, Galizien, and Bukovina; and low (5% or lower): Dalmatien, Lombardie, Venedig, Ungern, Serbische Woiwodschaft und Temeser Banat, Kroatien und Slavonien, Siebenbürgen, and Militärgränze.
Table 5: Illegitimacy by vitality (% illegitimate births).
Länder of the Austrian Empire, 1851-54
Live births Stillbirths
KronLänder 1851 1852 1853 1854
Average 1851-54
Wien 51.7 50.5 − − 56.7
Oesterreich unter der Enns (*) 15.7 15.0 26.7 26.6 30.3
Oesterreich ob der Enns 19.3 19.8 20.7 21.4 26.0
Salzburg 25.2 24.0 24.3 25.2 36.7
Steiermark 25.6 24.8 26.0 26.7 36.6
Kärnthen 34.4 35.4 36.4 36.9 48.1
Krain 8.4 7.6 8.7 8.8 17.7
Triest, Görz, Gradisca, Istrien (**) 6.8 7.0 7.7 8.5 15.0
Tirol und Vorarlberg 6.9 4.6 4.6 4.9 11.7
Table 5: (Continued)
Live births Stillbirths
KronLänder 1851 1852 1853 1854
Average 1851-54
Mähren 13.3 12.8 12.7 13.2 25.5
Schlesien 13.1 13.8 13.2 13.4 18.7
Galizien 8.3 7.5 7.3 7.5 16.4
Krakau sammt Gebiet 11.6 11.7 12.3 11.6 20.3
Bukovina 7.6 6.6 8.0 7.0 9.3
Dalmatien 3.3 3.1 2.3 1.8 32.5
Lombardie 4.5 2.8 3.1 3.8 10.7
Venedig 2.6 2.9 3.1 3.2 9.0
Ungern 4.3 4.1 4.1 4.3 9.2
Siebenbürgen 3.2 3.0 3.3 4.0 9.9
Militärgränze 1.6 1.5 1.4 1.3 3.4
Serbische Woiwodschaft und Temeser Banat − 1.7 1.7 1.9 4.5
Kroatien und Slavonien − − − 4.2 10.6
Total Empire 8.8 7.9 8.0 8.4 18.5
(*) 1853 and 1854 Wien included.
(**) In 1851, respectively on live births and on still births: Görz, Gradisca und Istrien 2.6 and 5.0; Triest 21.9 and 37.2.
Figure 3: Illegitimacy in the Länder of Austrian Empire, mean 1851-54
n Länder
1 Oesterreich unter der Enns 2 Oesterreich ob der Enns 3 Salzburg 4 Steiermark 5 Kärnthen 6 Krain
7 Görz, Gradisca, Istrien, Triest sammt Gebiet (Kustenland) 8 Tirol und Vorarlberg 9 Böhmen 10 Mähren 11 Schlesien 13-12 Galizien und Krakau
14 Bukowina 15 Dalmatien 16 Lombardie 17 Venedig 18 Ungern
19 Serbische Wojwodschaft und Temeser Banat 20 Kroatien (A) und Slavonien (B) 21 Siebenbürgen
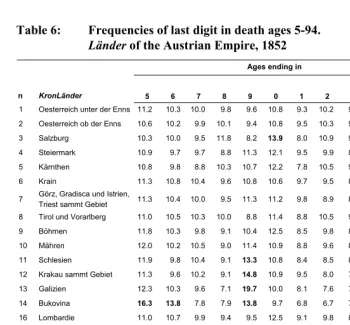
With regard to deaths, one way of evaluating the quality of the registers is to examine the quota of death acts lacking any indication of age. For the period of 1851-1854, the Tafeln include the distribution of deaths by single annual ages for each Land, including additional details (as described above) for ages up to three. Death acts lacking any indication of age are quite rare: 0.11% in the period 1851-1854, when considering the Empire as a whole. Unknown to us, however, is whether this low level (so low as to raise some suspicion) can be linked to a corrective system applied to non-responses of age existent at the local or administrative level.
Another way of evaluating the quality of the data on deaths is to estimate any possible rounding of the age at death recorded on the act. As mentioned above, data on death during the first year of life in the Tafeln are classified by month for the first three months, and then by trimester for the ages that follow. It is, consequently, not possible to conduct a detailed analysis specific to the exact number of months. That said, several results from other studies concerning the first year of life should be mentioned. For example, Ediev (2003), in his work on 1897 Russia, observed a strong attraction to six months in the classification of children less than a year old by single month of age. A similar attraction to six months is present in several parishes of Venedig during the 17th and 18th centuries – albeit to a much lesser degree than is reported in Ediev’s results. The attraction then progressively lessens and then disappears in the 19th century (Rossi and Tesolat 2006).
Further considerations concerning the quality of the data will be presented after we have estimated the probabilities of death and the life table, and compared infant mortality at different ages and by sex across the Länder.
Table 6: Frequencies of last digit in death ages 5-94.
Länder of the Austrian Empire, 1852 Ages ending in
n KronLänder 5 6 7 8 9 0 1 2 3 4 total
Averages of differences from 10% (abs. value) 1 Oesterreich unter der Enns 11.2 10.3 10.0 9.8 9.6 10.8 9.3 10.2 9.0 9.7 100.0 0.51
2 Oesterreich ob der Enns 10.6 10.2 9.9 10.1 9.4 10.8 9.5 10.3 9.4 9.8 100.0 0.40
3 Salzburg 10.3 10.0 9.5 11.8 8.2 13.9 8.0 10.9 9.0 8.4 100.0 1.38 4 Steiermark 10.9 9.7 9.7 8.8 11.3 12.1 9.5 9.9 8.3 9.9 100.0 0.85
5 Kärnthen 10.8 9.8 8.8 10.3 10.7 12.2 7.8 10.5 9.0 10.1 100.0 0.92
6 Krain 11.3 10.8 10.4 9.6 10.8 10.6 9.7 9.5 8.8 8.5 100.0 0.79
7 Görz, Gradisca und Istrien,
Triest sammt Gebiet 11.3 10.4 10.0 9.5 11.3 11.2 9.8 8.9 8.3 9.1 100.0 0.85 8 Tirol und Vorarlberg 11.0 10.5 10.3 10.0 8.8 11.4 8.8 10.5 9.0 9.7 100.0 0.75
9 Böhmen 11.8 10.3 9.8 9.1 10.4 12.5 8.5 9.8 8.3 9.5 100.0 1.00
10 Mähren 12.0 10.2 10.5 9.0 11.4 10.9 8.8 9.6 8.1 9.5 100.0 0.99
11 Schlesien 11.9 9.8 10.4 9.1 13.3 10.8 8.4 8.5 8.4 9.5 100.0 1.28 12 Krakau sammt Gebiet 11.3 9.6 10.2 9.1 14.8 10.9 9.5 8.0 7.7 8.9 100.0 1.43 13 Galizien 12.3 10.3 9.6 7.1 19.7 10.0 8.1 7.6 7.2 8.1 100.0 2.45 14 Bukovina 16.3 13.8 7.8 7.9 13.8 9.7 6.8 6.7 7.1 10.0 100.0 2.79 16 Lombardie 11.0 10.7 9.9 9.4 9.5 12.5 9.1 9.8 8.8 9.5 100.0 0.83
17 Venedig 10.9 10.5 10.3 9.5 9.5 10.8 9.8 9.9 9.0 9.8 100.0 0.50
18 Ungern 13.0 10.7 10.4 8.6 12.6 10.7 8.6 8.4 7.7 9.3 100.0 1.50 19 Serbische Wojwodschaft
und Temeser Banat 12.9 10.2 10.4 8.4 13.3 10.8 9.5 8.5 7.1 8.9 100.0 1.52 21 Siebenbürgen 12.2 8.0 10.1 7.2 17.5 10.0 10.0 7.2 7.4 10.3 100.0 2.03 22 Militärgränze 12.8 9.4 9.7 7.8 19.4 11.2 7.4 6.6 6.3 9.5 100.0 2.68 Total (*) 11.9 10.1 10.1 8.9 12.5 11.2 9.0 8.8 8.0 9.4 100.0 1.16 Total Males 11.9 10.3 10.2 9.1 12.1 10.9 9.2 8.9 8.1 9.3 100.0 1.08
Total Females 11.9 10.0 10.0 8.8 12.9 11.4 8.9 8.7 7.9 9.5 100.0 1.24
Figure 4: Percent of last digit in death ages 5-94.
Länder of the Austrian Empire, 1852
5 8 10 13 15 18 20
5 6 7 8 9 0 1 2 3 4
ages ending in ...
3. Life tables for ages 0-3 for the cohort born in 1851
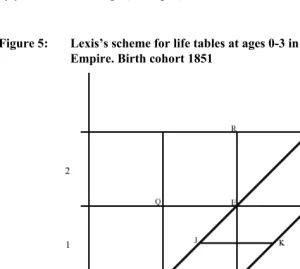
Complete data on deaths by the nine ages marking the first three years of life are available for the years 1851-1854. Consequently, it is possible to build a life table up until the third birthday for the cohort born in 1851 by means of some approximations (Figures 5 and 6). More specifically, the Tafeln include:
For the first year of life:
- Deaths in the first month of life in 1851 and 1852; - Deaths in the second month of life in 1851 and 1852; - Deaths in the third month of life in 1851 and 1852;
- Deaths in the 4th, 5th and 6th months of life in 1851 and 1852;
- Deaths in the 7th, 8th and 9th months of life in 1851 and 1852;
- Deaths in the 10th, 11th and 12th months of life in 1851 and 1852;
For the second year of life:
- Deaths between the 13th and 18th months of life in 1852 and 1853;
The data are not, however, organised by cohort (parallelogram in Figures 5 and 6), but rather by period (rectangles). To calculate the life table for the cohort born in 1851, deaths by year at birth and age (parallelograms) must be estimated, starting from deaths by year at death and age (rectangles).
Figure 6: Lexis’s scheme for life tables at ages 0-11 months in the Länder of the Austrian Empire. Birth cohort 1851
As data are detailed by month (for the first three months of life), quarterly (until the first birthday), bi-yearly until the second birthday, and annually for the third year of life, it is not too rash to suppose that deaths are equally distributed into each of these age classes. Under this hypothesis, it is a simple matter to estimate for each age the number of deaths belonging to the cohort born in 1851. The deaths during the first month for those born in 1851 are estimated as the sum of 23/24 of the deaths which occurred during the first month registered in 1851, and 1/24 of the deaths registered during the first month of 1852. In Figure 6, these two addenda are the trapezium AC1Q1B and the triangle BQ1D1, which are composed in the parallelogram AC1D1B. This method is similarly employed for the other ages, changing the proportions as follows:
Deaths in the 2nd month of life, for those born in 1851:
C1E1F1D1 = 21/24 x Deaths in 2nd month registered in 1851 +
+ 3/24 x Deaths in 2nd month registered in 1852;
Deaths in the 3rd month of life, for those born in 1851:
E1G1H1F1 = 19/24 x Deaths in 3rd month registered in 1851 +
Deaths in the 4th, 5th, and 6th months of life, for those born in 1851:
G1I1L1M1 = 45/72 x Deaths in 4th, 5th, 6th months registered in 1851 +
+ 27/72 x Deaths in 4th, 5th, 6th month registered in 1852;
Deaths in the 7th, 8th, and 9th months of life, for those born in 1851:
I1M1N1L1 = 27/72 x Deaths in 7th, 8th, 9th months registered in 1851 +
+ 45/72 x Deaths in 7th, 8th, 9th months registered in 1852;
Deaths in the 10th, 11th, and 12th month of life, for those born in 1851:
M1CDN1 = 9/72 x Deaths in 10th, 11th, 12th months registered in 1851 +
+ 63/72 x Deaths in 10th, 11th, 12th months registered in 1852;
And in Figure 5:
Deaths in the 13 th-18th month of life, for those born in 1851:
CJKD = 108/144 x Deaths in 13th-18th months registered in 1852 +
+ 36/144 x Deaths in 13th-18th months registered in 1853;
Deaths in the 19 th-24th month of life, for those born in 1851:
JEFK = 36/144 x Deaths in 19th-24th months registered in 1852 +
+ 108/144 x Deaths in 19th-24th months registered in 1853;
Deaths in the third year of life, for those born in 1851: EGHF = 1/2 x Deaths in 3rd year registered in 1853 +
+ 1/2 x Deaths in 3rd year registered in 1854
The live births in 1851 still surviving at each exact age x (Sx) are calculated as:
Sx+1=Sx–Dx. For the first month of life (Figure 5): C1D1=AB–AC1D1B, for the second
month: E1F1=C1D1–C1E1F1D1 etc.
The probabilities of death are calculated as qx=Dx/Sx.
For the first month of life (Figure 6): q1st month=q0=(AC1D1B)/AB; for the second
month: q2nd month=q1=(AC1D1B)/AB, etc.
Some distortions could come from migrations, as some children could be born in one region, and die in another. However, each Land is large enough to suggest that this problem should not be too important.
Table 7 contains these probabilities, indicated in months: nqx is thus the probability
and 10). Table 8 contains the index numbers of death probability qx presented in Table
7 (total Austrian Empire=100). Finally, Table 11 reports annual probabilities q0, q1, q2,
and the three years of probabilities 3q0.
Given that the population numbers in some Länder are relatively low, death probabilities (and, consequently, all of the parameters of the life table) are influenced by random variation. To address this issue, we calculated for the less populous Länder the confidence intervals at 5% for the death probabilities qx:
(
)
x qx x
q 1 q 1.96
x N
−
±
where Nx is the number of people exposed to death, i.e., the denominator of qx (Table
12). Even in the least populated region (Salzburg), the confidence interval for q0 (first
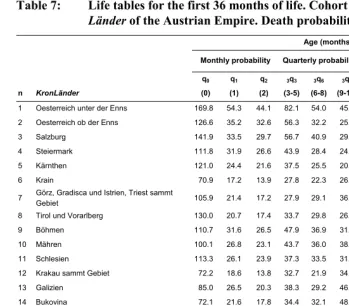
Table 7: Life tables for the first 36 months of life. Cohort born in 1851 in the
Länder of the Austrian Empire. Death probability (1,000 x nqx)
Age (months)
Monthly probability Quarterly probability Biyearly probability
Annual probability q0 q1 q2 3q3 3q6 3q9 6q12 6q18 12q24
n KronLänder (0) (1) (2) (3-5) (6-8) (9-11) (12-17) (18-23) (24-35)
1 Oesterreich unter der Enns 169.8 54.3 44.1 82.1 54.0 45.6 – – –
2 Oesterreich ob der Enns 126.6 35.2 32.6 56.3 32.2 25.8 36.1 20.8 38.9
3 Salzburg 141.9 33.5 29.7 56.7 40.9 29.3 38.8 15.9 19.5
4 Steiermark 111.8 31.9 26.6 43.9 28.4 24.9 38.3 19.4 31.3
5 Kärnthen 121.0 24.4 21.6 37.5 25.5 20.7 27.5 11.9 23.2
6 Krain 70.9 17.2 13.9 27.8 22.3 26.7 41.6 26.5 50.9
7 Görz, Gradisca und Istrien, Triest sammt
Gebiet 105.9 21.4 17.2 27.9 29.1 36.6 55.8 37.5 52.1 8 Tirol und Vorarlberg 130.0 20.7 17.4 33.7 29.8 26.5 42.0 23.2 32.5
9 Böhmen 110.7 31.6 26.5 47.9 36.9 31.5 46.4 27.6 36.4
10 Mähren 100.1 26.8 23.1 43.7 36.0 38.5 54.4 33.9 43.5
11 Schlesien 113.3 26.1 23.9 37.3 33.5 31.9 54.5 35.0 46.5
12 Krakau sammt Gebiet 72.2 18.6 13.8 32.7 21.9 34.3 49.9 39.3 57.3
13 Galizien 85.0 26.5 20.3 38.3 29.2 46.1 46.7 52.2 73.9
14 Bukovina 72.1 21.6 17.8 34.4 32.1 48.9 53.2 65.8 65.6
16 Lombardie 154.8 21.1 17.0 33.2 26.9 30.6 48.8 28.1 36.0
17 Venedig 215.0 19.6 12.7 21.6 18.4 23.8 42.7 26.7 37.9
18 Ungern 123.7 29.4 21.9 38.1 28.3 39.2 50.4 51.9 69.2
19 Serbische Wojwodschaft und Temeser Banat 112.5 20.5 15.0 30.2 22.4 34.3 43.8 44.1 56.9
21 Siebenbürgen 80.9 20.0 13.2 25.4 18.0 28.3 28.8 31.6 44.1
22 Militärgränze 107.6 24.2 20.6 41.4 24.1 46.0 50.1 66.8 85.0
Total Empire (*) 118.4 26.3 20.5 37.4 28.4 35.7 46.5 40.3 54.3
Table 8: Life tables for the first 36 months of life. Cohort born in 1851 in the
Länder of the Austrian Empire. Index numbers of death probability
nqx (Austrian Empire=100)
Age (months)
Monthly probability Quarterly probability Biyearly probability
Annual probability q0 q1 q2 3q3 3q6 3q9 6q12 6q18 12q24
n KronLänder (0) (1) (2) (3-5) (6-8) (9-11) (12-17) (18-23) (24-35)
1 Oesterreich unter der Enns 143.4 206.5 214.7 219.6 190.2 127.8 – – –
2 Oesterreich ob der Enns 106.9 133.7 158.8 150.4 113.7 72.1 77.6 51.5 71.6
3 Salzburg 119.8 127.4 144.9 151.6 144.0 82.1 83.4 39.5 35.9
4 Steiermark 94.4 121.2 129.3 117.3 100.0 69.6 82.4 48.1 57.6
5 Kärnthen 102.2 92.9 105.2 100.4 90.0 57.8 59.2 29.5 42.7
6 Krain 59.9 65.3 67.7 74.2 78.4 74.7 89.5 65.8 93.7
7 Görz, Gradisca und Istrien, Triest sammt
Gebiet 89.4 81.4 83.7 74.5 102.6 102.5 120.0 93.2 95.9 8 Tirol und Vorarlberg 109.8 78.7 85.0 90.2 105.0 74.2 90.2 57.7 59.9
9 Böhmen 93.5 120.2 128.9 128.1 129.9 88.2 99.8 68.4 67.1
10 Mähren 84.6 102.0 112.3 116.7 126.7 107.7 116.9 84.1 80.1
11 Schlesien 95.7 99.3 116.6 99.7 118.1 89.4 117.2 86.9 85.7
12 Krakau sammt Gebiet 61.0 70.6 67.4 87.4 77.1 96.0 107.2 97.5 105.4
13 Galizien 71.8 100.7 98.8 102.3 102.8 129.0 100.4 129.6 136.1
14 Bukovina 60.9 82.1 86.9 92.1 113.0 136.8 114.4 163.2 120.8
16 Lombardie 130.7 80.3 82.9 88.6 94.9 85.7 105.0 69.8 66.2
17 Venedig 181.6 74.5 61.8 57.7 64.7 66.5 91.8 66.2 69.8
18 Ungern 104.5 111.6 106.5 101.8 99.6 109.7 108.4 128.7 127.5
19 Serbische Wojwodschaft und Temeser Banat 95.1 77.9 73.0 80.6 78.8 96.0 94.1 109.4 104.8
21 Siebenbürgen 68.3 76.0 64.3 67.8 63.3 79.3 61.9 78.4 81.2
22 Militärgränze 90.9 92.1 100.4 110.8 84.8 128.7 107.7 165.7 156.6
Total Empire (*) 100.0 100.0 100.0 100.0 100.0 100.0 100.0 100.0 100.0
Standard deviation 29.9 34.0 37.7 36.6 29.5 23.3 17.7 38.7 32.0
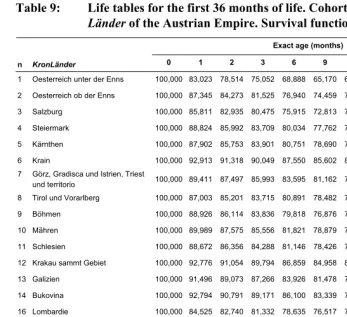
Table 9: Life tables for the first 36 months of life. Cohort born in 1851 in the
Länder of the Austrian Empire. Survival function lx
Exact age (months)
n KronLänder 0 1 2 3 6 9 12 18 24 36
1 Oesterreich unter der Enns 100,000 83,023 78,514 75,052 68,888 65,170 62,196 – – –
2 Oesterreich ob der Enns 100,000 87,345 84,273 81,525 76,940 74,459 72,540 69,922 68,471 65,809
3 Salzburg 100,000 85,811 82,935 80,475 75,915 72,813 70,677 67,935 66,855 65,548
4 Steiermark 100,000 88,824 85,992 83,709 80,034 77,762 75,829 72,924 71,511 69,275
5 Kärnthen 100,000 87,902 85,753 83,901 80,751 78,690 77,064 74,943 74,053 72,337
6 Krain 100,000 92,913 91,318 90,049 87,550 85,602 83,318 79,850 77,732 73,776 7 Görz, Gradisca und Istrien, Triest
und territorio 100,000 89,411 87,497 85,993 83,595 81,162 78,189 73,825 71,055 67,355 8 Tirol und Vorarlberg 100,000 87,003 85,201 83,715 80,891 78,482 76,402 73,196 71,494 69,170
9 Böhmen 100,000 88,926 86,114 83,836 79,818 76,876 74,453 70,998 69,042 66,527
10 Mähren 100,000 89,989 87,575 85,556 81,821 78,879 75,845 71,719 69,289 66,275
11 Schlesien 100,000 88,672 86,356 84,288 81,146 78,426 75,922 71,783 69,269 66,045
12 Krakau sammt Gebiet 100,000 92,776 91,054 89,794 86,859 84,958 82,044 77,954 74,893 70,605
13 Galizien 100,000 91,496 89,073 87,266 83,926 81,478 77,724 74,095 70,226 65,036
14 Bukovina 100,000 92,794 90,791 89,171 86,100 83,339 79,267 75,049 70,113 65,514
16 Lombardie 100,000 84,525 82,740 81,332 78,635 76,517 74,176 70,553 68,569 66,102
17 Venedig 100,000 78,499 76,961 75,985 74,343 72,978 71,244 68,203 66,384 63,868
18 Ungern 100,000 87,625 85,052 83,192 80,024 77,763 74,715 70,948 67,268 62,610 19 Serbische Wojwodschaft und
Temeser Banat 100,000 88,746 86,927 85,623 83,041 81,184 78,400 74,968 71,662 67,582 21 Siebenbürgen 100,000 91,908 90,071 88,882 86,628 85,072 82,664 80,285 77,750 74,320
22 Militärgränze 100,000 89,238 87,075 85,280 81,746 79,778 76,111 72,298 67,471 61,733
Total Empire (*) 100,000 88,160 85,842 84,079 80,934 78,638 75,829 72,301 69,388 65,620
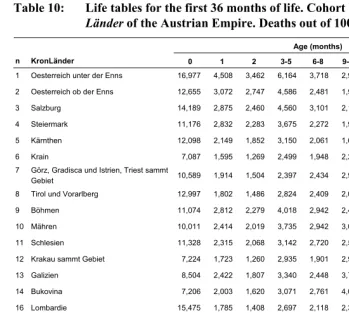
Table 10: Life tables for the first 36 months of life. Cohort born in 1851 in the
Länder of the Austrian Empire. Deaths out of 100,000 births ndx
Age (months)
n KronLänder 0 1 2 3-5 6-8 9-11 12-17 18-23 24-35 1 Oesterreich unter der Enns 16,977 4,508 3,462 6,164 3,718 2,974 – – –
2 Oesterreich ob der Enns 12,655 3,072 2,747 4,586 2,481 1,919 2,618 1,451 2,662
3 Salzburg 14,189 2,875 2,460 4,560 3,101 2,137 2,741 1,081 1,306
4 Steiermark 11,176 2,832 2,283 3,675 2,272 1,933 2,905 1,413 2,236
5 Kärnthen 12,098 2,149 1,852 3,150 2,061 1,626 2,122 890 1,716
6 Krain 7,087 1,595 1,269 2,499 1,948 2,284 3,467 2,118 3,956 7 Görz, Gradisca und Istrien, Triest sammt
Gebiet 10,589 1,914 1,504 2,397 2,434 2,973 4,363 2,771 3,699 8 Tirol und Vorarlberg 12,997 1,802 1,486 2,824 2,409 2,080 3,206 1,701 2,324
9 Böhmen 11,074 2,812 2,279 4,018 2,942 2,423 3,455 1,956 2,515
10 Mähren 10,011 2,414 2,019 3,735 2,942 3,034 4,126 2,430 3,014
11 Schlesien 11,328 2,315 2,068 3,142 2,720 2,504 4,139 2,515 3,224
12 Krakau sammt Gebiet 7,224 1,723 1,260 2,935 1,901 2,913 4,090 3,062 4,288
13 Galizien 8,504 2,422 1,807 3,340 2,448 3,754 3,629 3,868 5,191
14 Bukovina 7,206 2,003 1,620 3,071 2,761 4,073 4,218 4,936 4,599
16 Lombardie 15,475 1,785 1,408 2,697 2,118 2,341 3,622 1,984 2,467
17 Venedig 21,501 1,539 976 1,641 1,365 1,734 3,041 1,819 2,516
18 Ungern 12,375 2,573 1,860 3,168 2,261 3,048 3,767 3,680 4,658 19 Serbische Wojwodschaft und Temeser
Banat 11,254 1,819 1,304 2,582 1,857 2,784 3,432 3,306 4,080 21 Siebenbürgen 8,092 1,837 1,189 2,254 1,556 2,408 2,379 2,535 3,431
22 Militärgränze 10,762 2,163 1,795 3,534 1,968 3,667 3,813 4,827 5,737
Total Empire (*) 11,840 2,319 1,763 3,145 2,296 2,809 3,527 2,913 3,768
Table 11: Life tables for the first 3 years of life. Cohort born in 1851 in the
Länder of the Austrian Empire. Annual death probability (1,000 x qx)
Annual probability
3 years probability
n KronLänder q0 q1 q2 3q0
1 Oesterreich unter der Enns 378.0 - - -
2 Oesterreich ob der Enns 274.6 56.1 38.9 341.9
3 Salzburg 293.2 54.1 19.5 344.5
4 Steiermark 241.7 56.9 31.3 307.3
5 Kärnthen 229.4 39.1 23.2 276.6
6 Krain 166.8 67.0 50.9 262.2
7 Görz, Gradisca und Istrien, Triest sammt Gebiet 218.1 91.2 52.1 326.4
8 Tirol und Vorarlberg 236.0 64.2 32.5 308.3
9 Böhmen 255.5 72.7 36.4 334.7
10 Mähren 241.6 86.4 43.5 337.3
11 Schlesien 240.8 87.6 46.5 339.6
12 Krakau sammt Gebiet 179.6 87.2 57.3 294.0
13 Galizien 222.8 96.5 73.9 349.6
14 Bukovina 207.3 115.5 65.6 344.9
16 Lombardie 258.2 75.6 36.0 339.0
17 Venedig 287.6 68.2 37.9 361.3
18 Ungern 252.9 99.7 69.2 373.9
19 Serbische Wojwodschaft und Temeser Banat 216.0 85.9 56.9 324.2
21 Siebenbürgen 173.4 59.4 44.1 256.8
22 Militärgränze 238.9 113.5 85.0 382.7
Total Empire (*) 241.7 84.9 54.3 343.8
Table 12: Confidence intervals for the death probabilities during the first 36 months of life. Länder with the lowest number of births in 1851 (see first column of table 3)
Age (months)
Länder and births in 1851 0 1 2 3-5 6-8 9-11 12-17 18-23 24-35
Salzburg qx 141.9 33.5 29.7 56.7 40.9 29.3 38.8 15.9 19.5
(4,095) Intervals ± 11.5 ± 6.1 ± 5.8 ± 8.1 ± 7.1 ± 6.1 ± 7.2 ± 4.7 ± 5.2
Krakau qx 72.2 18.6 13.8 32.7 21.9 34.3 49.9 39.3 57.3
(6,320) Intervals ± 6.6 ± 3.5 ± 3.0 ± 4.7 ± 3.9 ± 5.0 ± 6.1 ± 5.5 ± 6.8
Karnthen qx 121 24.4 21.6 37.5 25.5 20.7 27.5 11.9 23.2
(9,297) Intervals ± 7.1 ± 3.4 ± 3.2 ± 4.3 ± 3.6 ± 3.3 ± 3.8 ± 2.6 ± 3.6
A first look at the differences between regions suggests that some information may have been under-registered. In five of the regions, the probability of dying during the first month is lower than 100‰. In the regions of Krain and Krakau, this relatively low level corresponds to low mortality during the two months which follow, whereas in Bukovina, Galizien, and Siebenbürgen, this does not occur (Table 7). Consequently, in these three Länder neonatal mortality may have been under-registered.
We now turn to the results in Table 7, where the probabilities nqx, are expressed in
months, by age intervals of different size n. After three months of life, in some Länder the probability of death at several ages is higher than the analogous probability at the preceding age. For example, 3q6 is greater than 3q3 only in the Länder Görz, Gradisca
und Istrien, and Triest sammt Gebiet; but 3q9 is higher than 3q6 in many central-eastern
Länder (Table 13). Similarly, 6q12 is higher than 6q6 in only one Land, (Venedig), but 6q18 is higher than 6q12 in six Länder (Galizien, Bukovina, Ungern, Serbische
Wojwodschaft und Temeser Banat, Siebenbürgen, and Militärgränze). Although such situations are not impossible, they are rather rare. For example, among the English population between 1580 and 1837 (Wrigley et al. 1997:226), in 11 periods of about 25 years each, the ratio 3q6 / 3q3 is (only slightly) greater than one only once, and the ratio 3q9 / 3q6, only twice. These results strongly suggest that great caution should be used
A strong suspicion that probabilities of death at 9-12 months had been overestimated in several Länder motivated us to join this age class with the two contiguous classes, and hence to jointly calculate the probabilities of death at 6-18 months (Table 14). The greater regularity of these results (only one Land with a higher probability than that of the preceding age class remains) leads us to conclude that the interval of 9-12 months attracts, in part, that of 6-9 months, and, to a lesser extent, that of 12-18 months. However, a somewhat suspect situation still remains – in the Länder with anomalous attractions to numbers – due to the probability of death at ages 18-24 months, which in some cases was found to be higher than that of the preceding semester. The entity of possible error is, however, much smaller than in the preceding case.
Taking all of these observations into consideration, in order to succinctly compare mortality during the first three years of life in the Länder, while simultaneously avoiding problems linked to age-heaping, we use four intervals (Table 14):
- the first month of life (q0);
- the following five months (5q1), given that the territorial series of probabilities
q1, q2, 3q3 are highly correlated;
- the 12 months which run from the 7th to the 18th months of life ( 12q6);
- the 18 months which run from the 19th to the 36th months of life ( 18q18).
Table 13: Death probability in the first 36 months of life. Ratio between probabilities (*) for selected periods of life. Cohort born in 1851 in the Länder of the Austrian Empire
Quarterly probability
Biyearly probability
Annual probability
Länder 3q6/3q3 3q9/3q6 6q12/6q6 6q18/6q12 12q24/12q12
1 Oesterreich unter der Enns 0.66 0.84 – – –
2 Oesterreich ob der Enns 0.57 0.80 0.63 0.58 0.69
3 Salzburg 0.72 0.72 0.56 0.41 0.36
4 Steiermark 0.65 0.88 0.73 0.51 0.55
5 Kärnthen 0.68 0.81 0.60 0.43 0.59
6 Krain 0.80 1.20 0.86 0.64 0.76
7 Görz, Gradisca und Istrien, Triest sammt
Gebiet 1.04 1.26 0.86 0.67 0.57
8 Tirol und Vorarlberg 0.88 0.89 0.76 0.55 0.51
9 Böhmen 0.77 0.85 0.69 0.59 0.50
10 Mähren 0.82 1.07 0.74 0.62 0.50
11 Schlesien 0.90 0.95 0.85 0.64 0.53
12 Krakau sammt Gebiet 0.67 1.57 0.90 0.79 0.66
13 Galizien 0.76 1.58 0.63 1.12 0.77
14 Bukovina 0.93 1.52 0.67 1.24 0.57
16 Lombardie 0.81 1.14 0.86 0.58 0.48
17 Venedig 0.85 1.29 1.02 0.63 0.56
18 Ungern 0.74 1.39 0.76 1.03 0.69
19 Serbische Wojwodschaft und Temeser
Banat 0.74 1.53 0.78 1.01 0.66
21 Siebenbürgen 0.71 1.57 0.63 1.10 0.74
22 Militärgränze 0.58 1.91 0.73 1.33 0.75
Total Empire (**) 0.76 1.26 0.74 0.87 0.64
Males 0.74 1.21 0.72 0.86 0.64
Females 0.78 1.32 0.76 0.87 0.64
Total Empire (**) 0.76 1.26 0.74 0.87 0.64
(*) The probability 6q6 is obtained by: 3q6+(1-3q6)3q9; the probability 12q12 is obtained by: 6q12+(1-6q12) 6q18.
Table 14: Life tables for the first 36 months of life. Cohort born in 1851 in the
Länder of the Austrian Empire. Death probability nqx for selected
periods of life
Level (x 1,000) Rank
q0 5q1 12q6 18q18 36q0 q0 5q1 12q6 18q18 36q0
n Länder (0) (1-5) (6-17) (18-35) (0-35) (0) (1-5) (6-17) (18-35) (0-35)
1 Oesterreich unter der Enns 170 170 --- --- --- 19 20 --- --- ---
2 Oesterreich ob der Enns 127 119 91 59 342 15 18 6 5 13
3 Salzburg 142 115 105 35 345 17 19 11 2 14
4 Steiermark 112 99 89 50 307 10 16 5 3 5
5 Kärnthen 121 81 72 35 277 13 10 1 1 3
6 Krain 71 58 88 76 262 1 3 4 11 2
7 Görz, Gradisca und Istrien, Triest
sammt Gebiet 106 65 117 88 326 7 6 16 13 8 8 Tirol und Vorarlberg 130 70 95 55 308 16 8 7 4 6
9 Böhmen 111 102 111 63 335 9 17 12 6 9
10 Mähren 100 91 124 76 337 6 15 18 10 10
11 Schlesien 113 85 115 80 340 12 13 14 12 12
12 Krakau sammt Gebiet 72 64 103 94 294 3 4 9 14 4
13 Galizien 85 83 117 122 350 5 11 17 17 16
14 Bukovina 72 72 128 127 345 2 9 19 18 15
16 Lombardie 155 70 103 63 339 18 7 10 7 11
17 Venedig 215 53 83 64 361 20 1 3 8 17
18 Ungern 124 87 113 118 374 14 14 13 16 18
19 Serbische Wojwodschaft und Temeser
Banat 113 64 97 98 324 11 5 8 15 7 21 Siebenbürgen 81 57 73 74 257 4 2 2 9 1
22 Militärgränze 108 84 116 146 383 8 12 15 19 19
Total Empire (*) 118 82 107 92 344 --- --- --- --- ---
Figure 7: Life tables for the first 36 months of life. Cohort born in 1851 in the
Länder of the Austrian Empire. Death probability for the first month of life (q0)
n Länder
1 Oesterreich unter der Enns 2 Oesterreich ob der Enns 3 Salzburg 4 Steiermark 5 Kärnthen 6 Krain
7 Görz, Gradisca, Istrien, Triest sammt Gebiet (Kustenland) 8 Tirol und Vorarlberg 9 Böhmen 10 Mähren 11 Schlesien 13-12 Galizien und Krakau
14 Bukowina 15 Dalmatien 16 Lombardie 17 Venedig 18 Ungern
19 Serbische Wojwodschaft und Temeser Banat 20 Kroatien (A) und Slavonien (B) 21 Siebenbürgen
Figure 8: Life tables for the first 36 months of life. Cohort born in 1851 in the
Länder of the Austrian Empire. Death probability from the 2nd to 6th months for those surviving to the 1st month (5q1)
n Länder
1 Oesterreich unter der Enns 2 Oesterreich ob der Enns 3 Salzburg 4 Steiermark 5 Kärnthen 6 Krain
7 Görz, Gradisca, Istrien, Triest sammt Gebiet (Kustenland) 8 Tirol und Vorarlberg 9 Böhmen 10 Mähren 11 Schlesien 13-12 Galizien und Krakau (*)
14 Bukowina 15 Dalmatien 16 Lombardie 17 Venedig 18 Ungern
19 Serbische Wojwodschaft und Temeser Banat 20 Kroatien (A) und Slavonien (B) 21 Siebenbürgen
Figure 9: Life tables for the first 36 months of life. Cohort born in 1851 in the
Länder of the Austrian Empire. Death probability from the 7th to 18th months for those surviving to the 6th month (12q6)
n Länder
1 Oesterreich unter der Enns 2 Oesterreich ob der Enns 3 Salzburg 4 Steiermark 5 Kärnthen 6 Krain
7 Görz, Gradisca, Istrien, Triest sammt Gebiet (Kustenland) 8 Tirol und Vorarlberg 9 Böhmen 10 Mähren 11 Schlesien 13-12 Galizien und Krakau (*)
14 Bukowina 15 Dalmatien 16 Lombardie 17 Venedig 18 Ungern
19 Serbische Wojwodschaft und Temeser Banat 20 Kroatien (A) und Slavonien (B) 21 Siebenbürgen
Figure 10: Life tables for the first 36 months of life. Cohort born in 1851 in the
Länder of the Austrian Empire. Death probability from the 19th to 36th months for those surviving to the 18th month (18q18)
n Länder
1 Oesterreich unter der Enns 2 Oesterreich ob der Enns 3 Salzburg 4 Steiermark 5 Kärnthen 6 Krain
7 Görz, Gradisca, Istrien, Triest sammt Gebiet (Kustenland) 8 Tirol und Vorarlberg 9 Böhmen 10 Mähren 11 Schlesien 13-12 Galizien und Krakau
14 Bukowina 15 Dalmatien 16 Lombardie 17 Venedig 18 Ungern
19 Serbische Wojwodschaft und Temeser Banat 20 Kroatien (A) und Slavonien (B) 21 Siebenbürgen
Figure 11: Life tables for the first 36 months of life. Cohort born in 1851 in the
Länder of the Austrian Empire. Death probability for the first 3 years of life (36q0)
n Länder
1 Oesterreich unter der Enns 2 Oesterreich ob der Enns 3 Salzburg 4 Steiermark 5 Kärnthen 6 Krain
7 Görz, Gradisca, Istrien, Triest sammt Gebiet (Kustenland) 8 Tirol und Vorarlberg 9 Böhmen 10 Mähren 11 Schlesien 13-12 Galizien und Krakau (*)
14 Bukowina 15 Dalmatien 16 Lombardie 17 Venedig 18 Ungern
19 Serbische Wojwodschaft und Temeser Banat 20 Kroatien (A) und Slavonien (B) 21 Siebenbürgen
4. A brief discussion of territorial differences
The main aim of this article is methodological: to test the quality of detailed data published in the mid-19th century Tafeln on infant mortality in the Austrian Empire
Länder. In the previous section, we suggested that the quality of the data is relatively good, with the exception of information on stillbirths and that on age at death in some Länder. In these final sections, we conclude by briefly discussing several substantive topics, emphasising geographical aspects.
A complete comparison of the Länder must take into account the larger demographic history of each Land (or at least infant mortality).The Tafeln may be very useful for describing the long-term processes of infant mortality, as they cover the long time-span of 1829-1871. These statistical tables also allow scholars to cross infant mortality with several specific characteristics of the Länder, such as education, urbanization, religion, economic situation, etc. The published life tables presented here thus represent only a snapshot of a potentially much broader picture.
In addition, data of this type (when sufficient quality exists) allow for regional comparisons of an Empire that was home to 35 million people—an uncommon situation during the ancien régime. Our results provide support for Livi Bacci’s argument cited at the beginning of this article: territorial variability is notable, and standard deviations are large and similar for each series of death probabilities. Moreover, in some cases, bordering Länder are characterised by opposite levels (see for example, the differences among the Länder in actual Austria (the first five rows of Table 8), as already emphasised by other authors (Prioux 1993; Kytir, Köck, and Münz 1995; Viazzo 1997).
Overall mortality in the first three years of life is quite variable, as has already been observed (Figures 11 and 12). High levels, or those of 350‰ and beyond, appear in the eastern (Galizien, Bukovina, Ungern), southern (Militärgränze), and western (Venedig, Salzburg) regions. Nonetheless, the distribution by age at death across the first three years of life in the different regions is quite diverse (Figures 7-10). Mortality is rather high in the first month throughout a vast western and central area, which reaches as far as Ungern. Between the second and the sixth months, the probability of death is instead higher in the central regions. Indeed, a closer look at Figure 8 shows great continuity, but also a certain gradient towards the more peripheral areas, particularly the more southern regions (with the exception of Militärgränze). For the age interval between the 7th and the 18th months (Figure 9),we see almost the inverse:
Figure 12: Life tables for the first 36 months of life. Cohort born in 1851 in the
Länder of the Austrian Empire. Variability of the survival function lx
Krain
Venedig Empire
60000 70000 80000 90000 100000
0 3 6 9 12 15 18 21 24 27 30 33 36 39
5. Was there discrimination against female children?
Table 15: Life tables for the first 36 months of life. Cohort born in 1851 in the
Länder of the Austrian Empire. Death probability (1,000xnqx) for
males and females
Age (months)
Monthly probability
Quarterly probability
Biyearly probability
Annual probability
Q0 q1 q2 3q3 3q6 3q9 6q12 6q18 12q24
Sex (0) (1) (2) (3-5) (6-8) (9-11) (12-17) (18-23) (24-35)
Males 129.8 28.3 22.2 40.8 30.3 36.7 47.5 40.8 55.3
Females 106.3 24.2 18.8 33.9 26.4 34.8 45.6 39.8 53.3
Total Empire (*) 118.4 26.3 20.5 37.4 28.4 35.7 46.5 40.3 54.3
100 x Ratio
Males/Females 122.1 116.9 118.0 120.5 114.8 105.4 104.2 102.6 103.9
(*) Oesterreich unter der Enns, Dalmatien, and Kroatien und Slavonien not included.
Figure 13: Life tables for the first 36 months of life. Cohort born in 1851 in the
Länder of the Austrian Empire. Survival function lx for males and
females
Males
Females
Total
50000 60000 70000 80000 90000 100000
Table 16: Life tables for the first 36 months of life. Cohort born in 1851 in the
Länder of the Austrian Empire. 100 x Ratio Males/Females of death probability nqx
Age (months)
Monthly probability Quarterly probability Biyearly probability
Annual probability q0 q1 q2 3q3 3q6 3q9 6q12 6q18 12q24
n KronLänder (0) (1) (2) (3-5) (6-8) (9-11) (12-17) (18-23) (24-35)
1 Oesterreich unter der Enns 122.8 117.6 115.4 116.7 113.1 113.6 – – –
2 Oesterreich ob der Enns 129.8 132.1 121.7 127.4 122.3 105.2 101.6 110.6 113.6
3 Salzburg 125.3 135.2 111.2 138.0 118.4 96.1 84.8 63.3 105.1
4 Steiermark 133.8 130.1 129.1 132.2 119.4 120.5 111.6 113.1 117.2
5 Kärnthen 135.5 115.8 132.1 133.3 121.8 104.7 106.3 85.3 99.6
6 Krain 133.4 146.4 137.3 130.2 118.3 114.2 110.6 115.2 112.0
7 Görz, Gradisca und Istrien,
Triest sammt Gebiet 122.7 112.2 126.0 125.1 110.4 116.1 106.4 98.7 90.4 8 Tirol und Vorarlberg 125.9 136.0 140.9 118.0 114.8 92.1 96.6 104.2 98.4
9 Böhmen 126.0 120.0 120.1 124.2 119.1 107.2 107.0 108.4 104.9
10 Mähren 135.6 115.9 122.9 134.9 118.3 118.5 112.4 109.3 107.9
11 Schlesien 117.9 105.8 103.0 122.2 113.6 110.0 118.6 105.0 101.6
12 Krakau sammt Gebiet 129.9 144.0 117.8 136.1 145.7 105.5 111.5 118.3 99.4
13 Galizien 126.2 120.5 112.0 122.9 113.8 102.2 103.5 102.4 102.6
14 Bukovina 116.5 115.4 102.8 103.5 94.2 100.1 99.1 94.1 80.4
16 Lombardie 129.9 117.8 123.9 121.6 118.3 111.9 106.1 105.9 100.9
17 Venedig 111.5 108.5 110.2 96.0 114.8 106.8 102.5 99.7 99.2
18 Ungern 116.9 113.6 118.9 118.7 113.1 102.6 101.7 100.0 105.8
19 Serbische Wojwodschaft und
Temeser Banat 121.4 110.1 111.2 122.8 107.9 101.4 102.5 103.6 98.2 21 Siebenbürgen 126.0 113.4 111.2 103.5 111.8 105.3 103.0 97.6 109.1
22 Militärgränze 115.1 111.2 114.5 110.3 108.6 104.6 98.9 99.3 99.7
Total Empire (*) 122.1 116.9 118.0 120.5 114.8 105.4 104.2 102.6 103.9
(*) Oesterreich unter der Enns, Dalmatien, and Kroatien und Slavonien not included.
Generally, for all of the Empire, mortality up until three years of age (344‰) is decomposed between endogenous mortality (87‰, equal to 25%) and exogenous mortality (257‰, equal to 75%). The ratio between female and male exogenous mortality is much less variable than the analogous endogenous ratio, and in only a few cases does exogenous female mortality resemble that of male mortality. These cases include Salzburg, Tirol und Vorarlberg, Serbische, and Militärgränze; while Venedig, and above all Bukovina, are the only Länder in which exogenous female mortality surpasses male mortality. With regard to the lowest ratio levels, only Steiermark and Krain have values that fall below 0.9, but these two regions are also among the Länder with the lowest mortality rates between the ages of 0-2. Figure 14 and Table 17 show that the Länder “suspected” of under-registering endogenous female mortality are Krain, Krakau, Bukovina, and Galizien, which coincide quite closely with – when observing the probabilities of death in the first three years of life independently of sex – the areas in which we noted that neonatal mortality seemed too low with respect to the months which followed (see above).
Figure 14: Ratios of male to female endogenous and exogenous mortality rates, ages 0-2 years. Cohort born in 1851 in the Länder of the Austrian Empire (*) 0,8 1,0 1,2 1,4 1,6 1,8 2,0 2,2 Bu ko vi na M ilit är gr än ze V ene di g Un ger n Se rb is ch e W oj w ods chaf t Ga liz ie n Gö rz , G rad is ca un d S iebe nbü rg en S chl es ien T irol und V or ar lber g S alz bur g Bö hm en Lo m bar di e Kr ak au s ammt G ebi et M ähr en O es ter re ic h ob de r E nns Kr ai n Kä rn th en S tei er m ar k total endogenous exogenous
Table 17: Ratio male to female mortality, ages 0-2 years: total, endogenous and exogenous mortality. Cohort born in 1851 in the Länder of the Austrian Empire
ratio male to female mortality n Länder 3q0 (total) 3q0 (endo) 3q0 (exo)
2 Oesterreich ob der Enns 1.177 1.388 1.084
3 Salzburg 1.128 1.372 1.002
4 Steiermark 1.216 1.423 1.130
5 Kärnthen 1.196 1.430 1.064
6 Krain 1.191 1.735 1.118
7 Görz, Gradisca und Istrien, Triest sammt Gebiet 1.093 1.416 1.023
8 Tirol und Vorarlberg 1.128 1.409 1.005
9 Böhmen 1.142 1.364 1.071
10 Mähren 1.176 1.555 1.098
11 Schlesien 1.104 1.211 1.072
12 Krakau sammt Gebiet 1.161 1.855 1.099
13 Galizien 1.092 1.713 1.027
14 Bukovina 0.990 2.498 0.937
16 Lombardie 1.157 1.392 1.038
17 Venedig 1.067 1.134 0.995
18 Ungern 1.080 1.286 1.025
19 Serbische Wojwodschaft und Temeser Banat 1.083 1.362 1.011
21 Siebenbürgen 1.100 1.430 1.025
22 Militärgränze 1.049 1.352 1.001
Total Empire (*) 1.106 1.347 1.036
(*) Oesterreich unter der Enns, Dalmatien, and Kroatien und Slavonien not included.
Zealand (all tables considered to be of high quality). They compared their expected results with those actually found in recent investigations conducted in different developing countries, building a measure of discrimination disfavouring female children; or, to be more exact, as clarified by the authors, the actual discrimination in several developing countries with respect to the discrimination in countries more than a century ago, which were chosen to build the tables (Hill and Upchurch 1995:132)
Our data allow us to build probabilities of death only up until the third birthday, and thus a direct comparison with Hill and Upchurch’s standard tables is not possible. On the other hand, it is feasible to construct the same relationships observed by the two authors using data on male mortality at ages 0-2 in the 19 Länder for which data are available (Table 18 and Figure 15). The index of discrimination is calculated as the difference between the actual ratio qF/qM,, and the theoretical ratio if gender
discrimination were the mid-19th-century Austrian Empire’s “average,” as expressed by
the interpolating line.
Figure 15: Ratios of female to male mortality rates in childhood by mortality level. Cohort born in 1851 in the Länder of the Austrian Empire
Infant mortality y = 0,526x + 0,6668
0,600 0,700 0,800 0,900 1,000 1,100 1,200
0,250 0,270 0,290 0,310 0,330 0,350 0,370 0,390 3q0 (M )
q
0
(F)/
q
0
(M
Figure 15: (Continued)
Young child mortality
y = 0,3857x + 0,8448
0,600 0,700 0,800 0,900 1,000 1,100 1,200
0,250 0,270 0,290 0,310 0,330 0,350 0,370 0,390
3q0 (M )
2q
1(
F
)/
2q
1(
M
)
Under-3 mortality y = 0,4485x + 0,7386
0,600 0,700 0,800 0,900 1,000 1,100 1,200
0,250 0,270 0,290 0,310 0,330 0,350 0,370 0,390
3q0 (M )
3q
0(
F
)/
3q
0(
M
Table 18: Index of female mortality disadvantage (*). Cohort born in 1851 in the Länder of the Austrian Empire
Index of female mortality disadvantage
n Länder
infant q0
young
2q1
under 3
3q0
2 Oesterreich ob der Enns -0.045 -0.062 -0.055
3 Salzburg -0.027 0.194 -0.016
4 Steiermark -0.053 -0.093 -0.067
5 Kärnthen -0.031 0.044 -0.037
6 Krain -0.030 -0.059 -0.027
7 Görz, Gradisca und Istrien. Triest sammt Gebiet 0.002 0.039 0.023
8 Tirol und Vorarlberg -0.001 0.040 0.002
9 Böhmen -0.014 -0.042 -0.023
10 Mähren -0.054 -0.073 -0.052
11 Schlesien 0.031 -0.062 0.007
12 Krakau sammt Gebiet -0.038 -0.039 -0.019
13 Galizien 0.005 -0.011 0.014
14 Bukovina 0.098 0.123 0.118
16 Lombardie -0.040 -0.025 -0.037
17 Venedig 0.052 0.006 0.032
18 Ungern 0.015 -0.021 0.013
19 Serbische Wojwodschaft und Temeser Banat 0.031 0.015 0.033
21 Siebenbürgen 0.064 0.016 0.050
22 Militärgränze 0.034 0.010 0.039
*) The actual ratio of female to male mortality minus the expected ratio according to the average situation of the Empire.