in the population sciences published by the Max Planck Institute for Demographic Research Konrad-Zuse Str. 1, D-18057 Rostock · GERMANY www.demographic-research.org
DEMOGRAPHIC RESEARCH
VOLUME 22, ARTICLE 35, PAGES 1097-1142
PUBLISHED 24 JUNE 2010
http://www.demographic-research.org/Volumes/Vol22/35/ DOI: 10.4054/DemRes.2010.22.35
Research Article
A fish stinks from the head:
Ethnic diversity, segregation,
and the collapse of Yugoslavia
E. A. Hammel
Carl Mason
Mirjana Stevanovi
ć
© 2010 E. A. Hammel, Carl Mason & Mirjana Stevanović.
This open-access work is published under the terms of the Creative Commons Attribution NonCommercial License 2.0 Germany, which permits use, reproduction & distribution in any medium for non-commercial purposes, provided the original author(s) and source are given credit.
1 Introduction 1098
2 Historical background 1099
3 The Yugoslav Censuses 1101
3.1 Ethnicity in the Yugoslav Censuses 1102
3.2 Territorial organization in the Yugoslav Censuses 1102
4 Ethnic classification in this analysis 1103
5 Methods 1109
5.1 Diversity 1109
5.2 Segregation 1110
6 Caveats 1115
7 Results 1116
7.1 Diversity (HS) 1116
7.2 Segregation (HT) 1118
8 Statistical significance 1120
9 Implications of opština boundary changes 1124
10 Some supplemental evidence 1124
11 Summary, reflections, and conclusion 1125
12 Acknowledgements 1128
Notes 1129
A fish stinks from the head
1:
Ethnic diversity, segregation, and
the collapse of Yugoslavia
iE. A. Hammelii Carl Masoniii Mirjana Stevanovićiv
Abstract
Demographic analysis clarifies political issues in the collapse of Yugoslavia. In most regions, 1961-1991, ethnic diversity (estimated by informational entropy) increased and segregation (estimated by Theil’s H) decreased. In a few regions there was a reversal in 1991 as migration flows or presentations of self perhaps changed in anticipation of war. The analysis strengthens refutations of the view that long standing ethnic hatreds were the root cause of the Yugoslav collapse and supports analyses that attribute collapse to general economic crisis, economic competition between regions, and failures at the peak of government.
i Hammel was responsible for final preparation of the data sets for analysis. Mason, and secondarily Hammel,
were responsible for the statistical analysis. Stevanović was responsible for initial preparation of the data sets and for contacts with demographers in Belgrade. Hammel and Mason wrote the paper.
iiii Emeritus Professor of Demography and Anthropology at the University of California, Berkeley
iii Director of the Computing Laboratory at the Department of Demography, University of California,
Berkeley
1. Introduction
We seek here to throw some demographic light on the collapse of Yugoslavia in the 1990s. We include data as late in time before the collapse as possible and thus incorporate information from the census of 1991, although its form and scope are less than ideal.2 We extend the analysis as early as we can where the data are reasonably
consistent in ethnic classification and territorial organization, namely to the census of 1961. We use data at the lowest level of aggregation in the census, namely the village or urban neighborhood, because we feel that ethnic diversity is most important socially and psychologically to individuals at that level.3 However, we extend the analysis
upward to higher levels as well. The paper makes use of work in sociology, history, ethnography, and political science as background to the demographic analysis.
What can demographic analysis tell us that other studies have not? This paper will show that, with some illuminating exceptions, ethnic diversity was increasing, and ethnic segregation decreasing at all census administrative levels 1961-91, but that there were even in these trends some prophetic local reversals between 1981 and 1991. These observations raise a series of interpretive questions that go beyond demographic analysis. Nevertheless, the demographic analysis is embedded in and motivated by them, so that they must be addressed. At the same time it is not our intention nor within our competence to offer a complete analysis from the viewpoints of sociology or political science. There already exist other analyses from those and other perspectives.4
Our intent is to supplement them with a statistical analysis of ethnic distributions.
• Can the ethnic violence and collapse of Yugoslavia be attributed simply to long-standing and pervasive ethnic hatreds? This notion is the usual journalistic explanation.
• Can the violence be attributed to the processes of ethnic diversification and desegregation themselves? Could the inhabitants of Yugoslavia simply not endure the increasingly cosmopolitan character of their environment?
• Can the violence and separatism instead be attributed to a loss of control by the League of Communists of Yugoslavia, weakened by the economic crises of the 1980s and the rise of competition and dissatisfaction between constituent republics defined by dominant ethnicities? Did regional politicians seize on ethnicity as a device in quest of power?
2. Historical background
Yugoslavia was cobbled together at the Paris Peace Conference in 1919 as part of an attempt to unite similar ethnic groups as a cordon sanitaire around a defeated German-Austrian alliance.5 Like many regions of southeastern Europe, it held a congeries of
ethnic groups, the jetsam of tribal and imperial waves that had swept across the Balkans for millennia. In the several centuries before World War I three major empires had held sway: the Venetian along the Adriatic, the Austro-Hungarian in the northwest, and the Ottoman in the southeast. Their boundaries did not coincide with divisions between ethnic groups. Many of these groups, especially pastoral ones, had been traditionally mobile. Many had scattered from southeast to northwest in flight from the Ottoman advance, and Serbs in particular fled or were invited into Habsburg territory to serve as frontier guards. Local relationships between these groups were often economically symbiotic, not always cordial, but not necessarily hostile unless poisoned by the influence of imperial masters. Figure 1 shows the geographical distribution of the principal ethnic groups in majority across the territory in 1991.6 The map is a rough
guide. It does not tell us much about areas in which no group had a majority but may have had a plurality, especially in Bosnia.7 It does not tell us how diverse a region was
ethnically, no matter which group was in majority. We seek here to draw a more detailed picture statistically if not cartographically.
This ethnic diversity is illustrated in some ways by the multiplicity of distinct languages natively spoken in the region, that is by groups with long historical depth.8
One authoritative count lists 22.9 Of the non-Slavic languages, only Albanian and
Hungarian had large numbers of native speakers within Yugoslavia. Of the Slavic languages, Bulgarian and Slovak had few, leaving the major languages of the former Yugoslavia, from northwest to southeast: Slovenian, Croatian, Serbian, Macedonian. The disappearance of “Serbo-Croatian” and its replacement by Serbian, Croatian, and now Bosnian confirms the classic quip of linguists, “A language is a dialect with an army.”
throughout the former Yugoslavia are geographically rather than politically defined, even though the several standard languages are politically defined. Ethnicity can also be signaled by items of traditional costume.10,11
Figure 1: Majority ethnic distributions in Yugoslavia at the municipal level
according to the 1991 census
3. The Yugoslav Censuses
Our analysis is based on the published tabulations contained on the CD issued by the Federal Statistical Office of Yugoslavia (Yugoslavia 1998). This source is unusual in that it is not only machine-readable but also provides preliminary tabulations on several demographic variables for the census of 1991 and also a series of tables of ethnic distributions in prior censuses back to 1921. For the later censuses, the tables provide data at the lowest level of aggregation (see below). While these data are essential for an historical overview of ethnic distributions, they have limitations that must be kept in mind. These stem from the nature of the census process itself.
1. The first step in the process is the interaction between the census taker and the respondent. Not until 1971 were the data on the question of ethnicity based entirely on the voluntary declaration of the respondent (including the declaration of the ethnicity of children under age 15 by their parents). Before that date, the census-taker played some role in offering examples, or in the earlier post-war censuses (1948, 1953), simply assigning ethnic membership.12
2. The second step is the reduction of a large number of ethnic groups to a smaller number of categories, including a residual “Other”. It is important to note that “Other” is not the only residual category. A second residual category is “Yugoslav – unallocated”, often tabulated simply as “Yugoslav”, that is, persons of Yugoslav citizenship or heritage (poreklo) who did not declare or were not assigned to a specific ethnic group. The degree of residuality of “Yugoslav”, however, differs in different censuses. In 1953 Yugoslav ethnic Muslims (thus not Muslim ethnic Turks, or Albanians, etc.), whether or not they practiced Islam, were allocated to the “Yugoslav” category.
3. The third step is the tabulation of the data into an even smaller number of categories for purposes of publication. As with most census data in all countries, the degree of specificity is greatest at the highest levels of aggregation and vice-versa. For example, the tables of ethnic membership for the historical censuses of Yugoslavia in the data source for this analysis provide much more detailed specifications of ethnic affiliation at the municipality level than they do for the lower, settlement, level.
even affected the conduct of that census; some regions did not participate in the pre-test, some omitted questions, some apparently did not report the results at the lowest level of aggregation to the Federal Statistical Office (Mrdjen 2002). Indeed, insurgency had already begun in Serbian majority regions of Croatia when the census was taken on March 31, 1991, as a result of Croatia’s declaration of independence and legislative changes that would have altered the historical status of Serbs in Croatia.13
3.1 Ethnicity in the Yugoslav Censuses
Ethnicity or its plausible indicators have been tabulated in the censuses of Yugoslavia since the first national count in 1921. In 1921 and 1931 mother tongue and religious affiliation were tabulated but unfortunately not cross-tabulated. Thus, the data from those years cannot be easily transformed into the ethnic categories used later because the fit between language, religion, and ethnicity is not clear cut. For example, Serbs and Croats were both listed as speakers of “Serbo-Croatian” and cannot be distinguished on linguistic grounds. All Orthodox in a region are not necessarily Serbs, nor are all Catholics necessarily Croats. Neither are all Muslims Muslim Slavs.14 Although it
would have been interesting to examine data on ethnicity beginning with the first postwar census (1948), the published data do not permit it. It is difficult to create a consistent data set from 1948 onward because the system of ethnic classification in the tabulations did not stabilize until the census of 1961. Indeed, it is consistent only 1961-1981 across all segments of the territory. In 1991 it continues in almost consistent form for Serbia and Montenegro (who jointly formed the rump Yugoslavia after the secessions), but the categorization employed in the published tables at the lowest level of aggregation is drastically simplified in Bosnia and Croatia. There are no useful data for Kosovo and two municipalities of Central Serbia in 1991, and there are no data in our source at the lowest level of aggregation for Slovenia and Macedonia in that year.15
3.2 Territorial organization in the Yugoslav Censuses
From 1961 onward the lowest level of aggregation in the census tables was the naselje
(pl. naselja).16,17 The next higher level was the opština (pl. opštine, approx.
The next higher level was the republic, although Serbia itself was divided at an intermediate level into Central Serbia and two other regions with a degree of autonomy that had varied over time – the Voyvodina in the north and Kosovo in the south. In this analysis we treat all of these entities above the opština as equivalent in level, i.e., the republics other than Serbia and the three sections of Serbia as described, and call them all regions.
Before 1961 data were not published at the naselje level, and the lowest level fluctuated in scope and name but was higher than the naselje. We do not use censuses before 1961 not only because they do not have data at the naselje level but also, as noted, because their classifications of ethnicity are not consistent with those 1961-1991. The geographical boundaries of census units above the naselje and below the region are also rather volatile over time, so that these units form a time series with changing content. Naselja are more consistent, but they, too, pose problems. Some naselja disappear from the census; these seem often to be small villages that were abandoned, but they may also be urban neighborhoods that were renamed. Some naselja appear in the middle of the census series; these appear to be genuinely new settlements, although they, too, may be old naselja renamed. While the renaming of naselja is not as frequent as the politically driven ubiquitous renaming of streets, it does occur.18 More
problematic than renaming is the varying spelling in the different censuses of the names of naselja that seem almost surely to be the same places. 19
It is important to note, however, that the analysis presented here is not one of a time series of the naselja themselves but rather a time series of cross-sections of naselja. Each observation that we examine is a naselje at a point in time, located in its opština and its region at that point in time, and we do not rely, in our main analysis, on whether these points, even if identically named, are the same across the four censuses. Similarly, analysis of opštine over time is one of a time series of cross-sections. These caveats do not apply to regions, the borders of which appear to be quite stable over the time span 1961-1991.20
4. Ethnic classification in this analysis
21presumably be classified as “Yugoslav – unallocated” if they were Yugoslav citizens or of Yugoslav heritage, or as “Other” if they were not.
Yugoslav political philosophy was very sensitive to issues of ethnicity, especially to the history of conflict between the major ethnic groups. Under the Yugoslav constitution(s) after 1945 there were five “constitutive ethnicities”, called narodi22,
each associated with one of the republics, which was its historical homeland, if not the residence, of all its members: Croatian, Macedonian, Montenegrin, Serbian, and Slovenian. Serbs, for example, also formed large minorities in Croatia and Bosnia and decreasingly so over time in Kosovo. Serbs resident in Croatia were also a constitutive ethnicity in Croatia, since they had formed a large portion of the population of Croatia since the 16th century. There were, in addition, a number of other recognized ethnic
groups, called narodnosti23,living in Yugoslavia but having a recognized homeland
outside Yugoslavia (or no recognized or uncontested homeland, such as Roma, Cincari, Bunjevci, Vlachs, and others) and thus not having a republic that was ethnically, historically, and constitutionally their own. The largest of these groups were the Albanians, mostly concentrated in Kosovo, and Hungarians, mostly concentrated in Voyvodina. Although a republic, Bosnia did not have a constitutive ethnicity.24 The
central problems of Yugoslav ethnic politics are that some narodi had a large presence in a region not their own, and some very numerous narodnosti had no constitutional home.25
Two other “ethnicities” are of particular interest, and they are interrelated. One is that of “unallocated Muslims” (neopredeljeni Muslimani). These are persons who identify themselves as Muslim in the ethnic sense, but who are not necessarily observant Muslims.26 These would include Muslims of Yugoslav origin27, such as those
in Bosnia or the Sandžak (the territory between Kosovo, Montenegro, and Hercegovina). In theory, persons of Muslim faith who were not of Yugoslav origin could not claim to be Muslims in the ethnic sense. Persons of Muslim faith who had declared another ethnicity, such as Albanian, would not be included in this “unallocated Muslim” category. The other category of interest is “Yugoslav”, or more precisely “unallocated Yugoslav.” It can be construed as a residual category of Yugoslav citizens who did not declare any ethnic tie, or who declared an ethnicity that was not separately tabulated, or of those who chose “Yugoslav” because it superceded previous ethnic divisions.
the ethnicity of the respondent, but there was no “unallocated Muslim” category published in the tables. The census taker was also instructed to write “Yugoslav-unallocated” for respondents “of Yugoslav origin … who had not been ethnically more closely allocated.” In 1961 the designation, “Muslim”, was defined as “in the ethnic sense” and applied only to persons of Yugoslav origin, i.e., not to Albanians, Turks, etc. and further not to ethnic Serbs, Croats, and others who were of Islamic faith. These allocations, according to the instructions, were apparently determined by the census taker, presumably after querying the respondent.
In 1971, there was a marked change in the instructions, namely that the respondent was to be recorded according to his or her own declaration, with the ethnicity of children under age 15 declared by their parents. The instructions explicitly state that respondents who do not wish to declare their ethnicity need not do so. Throughout the series of censuses, various terms, such as “ethnic membership”, “ethnic minority”, “nationality”, etc., were used interchangeably and without definition. The term, “minority”, was eventually dropped because it might be thought derogatory.
The second category of special interest is “Yugoslav”. In the earlier censuses before 1961 it appears to have been a residual category for persons of Yugoslav origin or citizenship for whom the census taker could not determine an ethnic category, or those respondents who did not respond with an ethnic category. The number of persons in Yugoslavia listing Yugoslav as their ethnicity (or having it determined for them) is never large, except in Bosnia, although its proportional fluctuations may be. There may be a categorical equivalent of “Muslim” and “Yugoslav” in some censuses (see below). Otherwise, “Yugoslav” appears to have been a response of members of the League of Communists, of military officers, or of dedicated supporters of the national unity of Yugoslavia even if they were not members of the League, or, as suggested above, especially of Muslims or others who did not wish to identify themselves in traditional ethnic terms.28 It may also have provided an opportunity for the children of ethnically
mixed marriages or spouses in such marriages to choose a neutral ethnic alternative.29
This declaration (“Yugoslav”) is of special interest because it is unambiguously a political statement. However, it is important to note that all declarations of ethnicity in Yugoslavia (and perhaps universally) are in some sense political statements.30 (See also
Urdal 2001.)
“unallocated Yugoslavs” did. Muslims in Bosnia increased by 640,000 or 76 percent; “Yugoslavs” decreased by 232,000 or 84 percent. Even if all of the increase in Muslims was simply an “ethnic migration” of “Yugoslavs” into “Muslims”, there are still about 400,000 people unaccounted for. Assuming (and not unreasonably) that crude death rates were about the same for Muslims and non-Muslims, and also that Muslim crude fertility rates were as much as double those of non-Muslims (also not unreasonable), the numbers still do not balance. There may have been other trading partners in this network. Serbs and Croats, the other two major ethnic groups in Bosnia, show almost no change in number between 1961 and 1971. It is possible that they actually experienced some population growth but that some proportion of their population, having reported as non-Muslim in 1961, elected to report as Muslim in 1971. It is also possible that some non-Yugoslav Muslims (ethnic Albanians, ethnic Turks, etc.) may have claimed Yugoslav Muslim ethnicity.31
The usual “balance equation” for demographic analysis contains three terms: births, deaths, and net migration. The balance equation for ethnic groups in Yugoslavia (and doubtless elsewhere) contains four: births, deaths, net geographical migration, and net ethnic redefinition. Even if good data were available for births and deaths by ethnicity by fairly small regions, we would still need accurate data on geographical migration to net out the “migration” by ethnic redefinition. We do not have the necessary data to solve this puzzle.
We should also note that ethnic redefinition is not a new phenomenon, historically, either for individuals or for populations. For example, some tribes of old Montenegro, such as the Klimenti, are reputed to be of “Albanian” (Gheg) origin. Thus at some historical point, perhaps about the same time as the introduction of Orthodox Christianity or later during the hegemony of the Serbian Empire, they and some other Ghegs adopted Orthodox Christianity and the Klimenti were Slavicized. One may speculate that they had already been bilingual.32 Other, small but distinct ethnic groups
cautiously, to see what demography can contribute. In sum, we may say that the demographic picture obtainable from these censuses is like that from many other excellent censuses. It shows a population responding to rates of birth and death, people moving across landscapes, and people oozing in and out of social categories. We accept those ambiguities, for what interests us is how people viewed themselves and how they might think their neighbors viewed them.
Ambiguity does not end with this recitation. Although shifts in the count of persons by ethnicity can occur by self-definition, changes in self-definition can reflect either confidence or fear, acceptance of diversity, or the rise of defensive nationalism. Further, the census counts of persons by ethnicity may suffer from nonrandom error. (We address random error in a later section.) Such errors are commonplace in the censuses of other countries, where they have been detected by post-enumeration surveys. Different segments of the population are counted with differing degrees of accuracy; minorities and the poor are often undercounted, the rich may be counted more than once if the census is residence-based. We are not aware of accessible post-enumeration survey data that would allow us to take undercounts and overcounts into consideration for the censuses that we analyze here.33 In fact, such errors make our
interpretations conservative. Correction of undercounts of minority populations would
increase our measure of diversity.34 Note also that the enumerations of persons by
ethnicity include the population of Yugoslav citizens living abroad. The ethnic distribution of Yugoslavs living abroad differs by region, by ethnicity, and by point in time. If the enumeration of such persons is subject to nonrandom error, the reported ethnic proportions will be biased in some unknown direction and degree. The issue is complicated not only by errors in the reporting of departures and returns, but also by the reporting of births and deaths in the population living abroad. We have no way to estimate these errors. If a population living abroad is undercounted and also the majority population in its home area, correction of the error will decrease our measure of diversity; if that undercounted population is not the majority population in its home area, correction of the error will increase our measure of diversity.
The censuses are all we have. We must interpret them with caution. In the end, we can only fall back on philosophical statements, for example, that “statistics is the blind man’s cane”, or quote 1 Corinthians 13 to remark that “for now we see through a glass, darkly”.
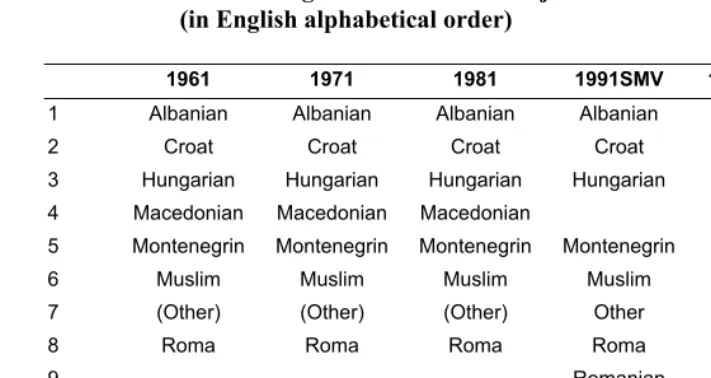
Table 1 shows the ethnic classifications published for the censuses of Yugoslavia 1961-81 at the naselje level and in those of the reporting successor states in 1991.35 We
Table 1: Ethnic categorization at the naselje level 1961-1991 (in English alphabetical order)
1961 1971 1981 1991SMV 1991BOS 1991CRO
1 Albanian Albanian Albanian Albanian
2 Croat Croat Croat Croat Croat Croat
3 Hungarian Hungarian Hungarian Hungarian 4 Macedonian Macedonian Macedonian 5 Montenegrin Montenegrin Montenegrin Montenegrin
6 Muslim Muslim Muslim Muslim Muslim Muslim
7 (Other) (Other) (Other) Other Other Other
8 Roma Roma Roma Roma
9 Romanian
10 Serb Serb Serb Serb Serb Serb
11 Slovak
12 Slovene Slovene Slovene
13 Yugoslav Yugoslav Yugoslav Yugoslav Yugoslav Yugoslav
Note: SMV = Central Serbia, Montenegro, Voyvodina
“(Other)” is implicit, calculated by subtraction of all other categories from the total population. “Other” is explicitly given in the census. The order of the categories in this table is not the same as their order in the published data or in Mrdjen’s summary (2002) but is uniformly alphabetical (in English); the ordering in the source tables, where alphabetic, is sometimes in the Cyrillic rather than the Latin alphabet. The historical ordering of ethnic categories in the published tables is both complex and political. In 1948-1961 the tables list “Narodnost” (“Nationality”). In 1971 they list “Narodnost ili Etnička Pripadnost” (“Nationality or Ethnic Membership”). In 1981 they list “Narod, Narodnost ili Etnička Pripadnost” (“Nation, Nationality or Ethnic
Membership)” (Mrdjen 2002). In 1948 all groups were listed in order of numerical preponderance. Subsequently, groups of Yugoslav origin were in a first sublist, all others in a second sublist. The Yugoslav groups in 1953 and 1961 were ordered by numerical preponderance except that “unallocated Yugoslavs” were placed last in the sublist; all non-Yugoslav groups were unordered in the second sublist. In 1971 there were three sublists. The first was of narodi (the constitutive nations). The second was of narodnosti (the non-constitutive nationalities), and the third was of all other reported groups. In all censuses except 1953, Muslims (in the ethnic sense) are listed specifically; in 1953 they were part of the “(unallocated) Yugoslav” category. In 1948 Jews are not listed separately. In 1953 they are listed as Židovi. Subsequently they are listed as Jevreji (“Hebrews”) in the “foreign” sublist, and in 1971 in the third or “most foreign” sublist, despite the fact that Romaniote Jews had been resident in the Yugoslav lands probably at least since the destruction of the Second Temple, and other Jews certainly since the expulsion of the Sephardim from Spain in the 15th Century. Like Mrdjen, we see a lot of political nuance in these
details, in a struggle to accommodate diversity and unity at the same time.
Slovenians in the three-member collective but substantial numbers of Slovaks and Romanians in the Voyvodina. Montenegro conformed in this, as a member of the rump Yugoslavia at the time of census publication. Our task would have been simpler and the results more useful if the available machine-readable data were consistently structured in 1991, as they were in the previous three censuses. It is important to stress again that our analysis is based on the published tabulations at the naselje level (Yugoslavia 1998). More detailed specification of ethnic distributions is available in that source for 1991, but only at the opština level and above, and not for all regions. The tables at the opština level for Bosnia in 1991 show only five categories, Croatia 29, Montenegro nine, Macedonia six, Slovenia 29, and all three regions of Serbia 22. A separate analysis of diversity and segregation at the opština level and above would still be limited by the five-category structure reported for Bosnia.
5. Methods
Following the lead of Fischer et al. (2004) and predecessors (e.g., Theil 1967) we examine two measures, one of diversity, the other of segregation.36
5.1 Diversity
The diversity measure, applied to all levels of census aggregation from the naselje to the region, is one of informational entropy, first proposed by Shannon in 1949 (Shannon and Weaver 1949). In this application it expresses the uncertainty (HS) about
1
ln( )
n
S i i
i
H p p
=
= −
∑
(1)where Hs is Shannon’s entropy, pi is the proportion of the population in category i and
ln is the natural logarithm.37 We use H
s to distinguish Shannon’s entropy from the Theil
measure described below.
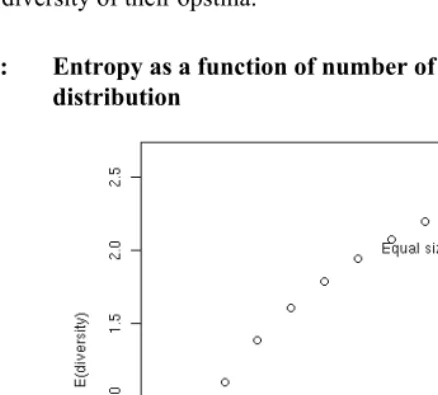
Where p=0, the value of p*ln(p) is assumed to be zero. Thus an empty category contributes nothing to the sum. If one category contains all of the observations so that all other categories are empty, the value of Hsis 0, and there is no uncertainty about the
identity of an observation. While Hs always has a lower bound of zero, its upper bound
is a function of the number of non-empty categories. Hs is maximized for any number
of categories when the distribution across them is equal. The circular points (o) in Figure 2 show how Hs increases with the number of categories under conditions of
perfect equality between the categories. The dashed points (-) show a very simple scenario of variable inequality for a two-category system. In this, the first category has, successively, shares of 0.1, 0.2, 0.3, 0.4, 0.5, and the second category has the residual, thus 0.9, 0.8, 0.7, 0.6, 0.5. Entropy increases with equality of sharing and is thus maximal with perfect equality. The topmost dashed point has the same value as the circular point for a two-category system with equal shares. The plus marks (+) show the result of a distribution in which only one of the census ethnic categories has any members in a given community, regardless of the number of categories in the census; entropy, i.e. diversity, in such circumstances is zero, since ln(0) is by definition zero. Thus, although entropy has a lower bound of zero, it has no fixed upper bound, since it depends on the number of groups as well as on their proportional distribution.
5.2 Segregation
The segregation measure (HT, Theil 1967) is applied to any superordinate level of
census aggregation, that is, from the opština to the region. It expresses the degree to which units of the immediately subordinate level differ in their entropy (Hs) one from
another, analogous to a measure of the variance between subsamples. The lower and upper bounds of HT are [0,1]. (Our notation attempts to keep the relationship between
formulae (1) and (2) transparent.) Note especially that HT cannot be calculated for the
lowest level of aggregation; thus here it cannot be calculated for naselja. That restriction is unfortunate, because some naselja in some censuses are relatively large and are almost surely ethnically diverse, divided into traditional subunits, such as the mahala
1
k m
S S
k T
k S
H H
N H
N H
=
⎛ − ⎞
⎜ =
⎜
⎝ ⎠
∑
⎟⎟ )
) (2)
where m is the number of subordinate units (for example naselja in an opština), N is the total population of the superordinate unit (for example the opština), Nk is the total
population of subordinate unit k (for example each constituent naselje), Ĥs is the overall entropy of the superordinate unit, and HSk is the entropy of each subordinate unit. HT is
thus a weighted average of the relative differences of the diversity (entropy) of naselja from the diversity of their opština.
Figure 2: Entropy as a function of number of categories and equality of distribution
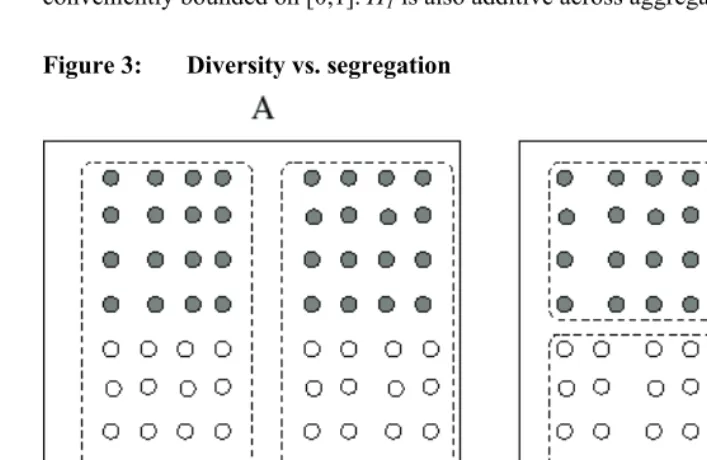
A simple hypothetical example will suffice to illustrate the difference between HS
and HT. Suppose two opštine, A and B, each with two naselja, X and Y. AX, AY, BX,
calculation of HT is more revealing than simple comparison of means and is
conveniently bounded on [0,1]. HT is also additive across aggregation levels.38
Figure 3: Diversity vs. segregation
Note: Note that E1 and E2 are equally represented in AX and AY. The value of HS in AX and AY is 0.69 in both, as calculated from
the formula given for HS. It can be simply represented in this case as -1*([0.5*ln(0.5)]+ [0.5*ln(0.5)]). (See also the value shown
for two groups equally represented, in Figure 2.) This is the maximum attainable value for two ethnic groups. Since AX and AY have the same distribution of ethnic groups, the value of HT is at its minimum, namely zero. On the other hand, each ethnic
group is represented in only one village in the set consisting of BX and BY. Since there is only one group in each of BX and BY the value of HS in each of them is zero (since ln(0) is here by definition zero), and in consequence the value of HT is at its
maximum, namely 1.
To give a quick sense of ethnic distributions in Yugoslavia, Table 2 shows that despite the great diversity of ethnicities, monoethnicity, i.e., all inhabitants of a naselje reported to have the same ethnicity, was sometimes the mode, usually the second most frequent pattern, and that having only two ethnic groups in a naselje was usually the mode. Only the Voyvodina diverges from this predominance at the lower numbers of ethnicities present.39 Indeed, monoethnicity is the historical norm at the level of the
groom resided in the household of the groom’s father. Other brothers (if any) would coreside, so that on the death of their father a patrilineally extended household with more than one married son would become a fraternal joint one. As the sons (if any) of this joint household matured, they would marry (almost always endogamously in respect of ethnicity), bringing in their wives, and the adult sons of these brothers would be co-resident cousins. Eventually such a household might divide, but its constituent sections might continue to live in close proximity. Thus, with any degree of demographic growth, the village or mahala would become populated with patrilineally related kin, thus of the same ethnic group. Longer range migration might involve such complex family units, which would re-establish a monoethnic residential microregion. Households of different origin would on migration tend to seek out co-ethnics as neighbors even if only on grounds of common religion, a lower potential for interhousehold violence, and facilitation of the ethnic marriage market.40 Table 2
presages what we will learn in more detailed analysis later: the decline in monoethnicity, sometimes ragged, the increase in just a few areas, and the increase in 1991 in a few of those in which it had previously declined, as the clouds of war began to gather. The decline in monoethnicity was driven especially by internal migration from diverse monoethnic locations to urban centers, and by the disappearance of small villages as the young migrated to cities and the older generation died. To some extent this trend was offset at the higher level geographical units, since migrants to the cities tended to stay within territories dominated by their own ethnicity – Serbs in Serbia tended to relocate within Serbia, and so on (Hoffman 1973, Sharp 1975, Thomas 1979).
Table 2: Proportion of naselja with n ethnic groups, by region and census year
N Ethnic Groups Region:
Date 1 2 3 4 5 6 7 8 9 10 11 N
Naselja
BOS:61 0.213 0.236 0.216 0.159 0.086 0.036 0.021 0.013 0.008 0.011 0.001 6078 BOS:71 0.208 0.264 0.218 0.146 0.083 0.039 0.016 0.010 0.004 0.009 0.003 5873 BOS:81 0.169 0.223 0.202 0.169 0.116 0.065 0.024 0.012 0.008 0.006 0.006 5851
BOS:91 0.282 0.229 0.165 0.152 0.171 * 5488
CRO:61 0.248 0.281 0.203 0.123 0.058 0.033 0.022 0.013 0.008 0.010 0.001 6756 CRO:71 0.219 0.255 0.188 0.145 0.075 0.046 0.025 0.017 0.012 0.012 0.005 6675 CRO:81 0.113 0.181 0.210 0.216 0.124 0.065 0.037 0.020 0.013 0.013 0.008 6623
CRO:91 0.1330 0.289 0.214 0.227 0.137 * 6293
KOS:61 0.168 0.227 0.236 0.177 0.097 0.054 0.015 0.007 0.007 0.005 0.007 1437 KOS:71 0.273 0.278 0.193 0.134 0.061 0.020 0.009 0.007 0.007 0.008 0.009 1435 KOS:81 0.334 0.233 0.168 0.110 0.064 0.034 0.021 0.009 0.008 0.008 0.009 1444 KOS:91 *
MAC:61 0.279 0.332 0.186 0.104 0.039 0.027 0.012 0.009 0.002 0.009 0.000 1696 MAC:71 0.340 0.330 0.164 0.083 0.041 0.018 0.007 0.004 0.003 0.010 0.000 1643 MAC:81 0.344 0.263 0.177 0.090 0.050 0.029 0.021 0.007 0.005 0.013 0.000 1629 MAC:91 *
MNT:61 0.388 0.275 0.142 0.092 0.044 0.016 0.016 0.008 0.010 0.007 0.002 1259 MNT:71 0.175 0.261 0.226 0.156 0.072 0.044 0.019 0.015 0.014 0.014 0.003 1259 MNT:81 0.206 0.222 0.205 0.147 0.095 0.054 0.023 0.015 0.015 0.011 0.006 1231 MNT:91 0.149 0.236 0.233 0.160 0.108 0.048 0.030 0.015 0.007 0.006 0.007 1172 SLV:61 0.564 0.271 0.104 0.032 0.013 0.005 0.004 0.003 0.003 0.000 0.000 6034 SLV:71 0.548 0.269 0.099 0.040 0.017 0.010 0.006 0.004 0.006 0.001 0.000 6004 SLV:81 0.463 0.259 0.121 0.069 0.038 0.020 0.010 0.008 0.009 0.003 0.000 5933 SLV:91 *
SRB:61 0.419 0.280 0.120 0.070 0.035 0.021 0.014 0.010 0.012 0.010 0.009 4101 SRB:71 0.158 0.302 0.219 0.129 0.062 0.037 0.022 0.017 0.018 0.014 0.022 4101 SRB:81 0.119 0.219 0.235 0.149 0.103 0.061 0.034 0.025 0.014 0.017 0.024 4154 SRB:91 0.134 0.196 0.229 0.182 0.111 0.059 0.032 0.017 0.013 0.011 0.015 4122 VOY:61 0.000 0.022 0.033 0.086 0.109 0.140 0.135 0.140 0.151 0.118 0.067 451 VOY:71 0.002 0.018 0.018 0.035 0.060 0.089 0.135 0.122 0.160 0.153 0.208 451 VOY:81 0.004 0.009 0.017 0.030 0.045 0.130 0.098 0.105 0.145 0.158 0.259 468 VOY:91 0.002 0.006 0.004 0.030 0.065 0.112 0.110 0.125 0.134 0.209 0.203 464 N Naselja 26481 24908 18048 13170 7946 3425 1926 1280 1057 1050 834 100125
Note: BOS=Bosnia, CRO=Croatia, KOS=Kosovo, MAC=Macedonia, MNT=Montenegro, SLV=Slovenia, SRB=Central Serbia, VOY=Voyvodina
6. Caveats
A caveat on this and later interpretations of the data, is our inability to assess the separate effects of fertility, mortality, migration, and ethnic self-definition on ethnic balances. We have no ethnospecific data on fertility and mortality at the lower levels of census aggregation, let alone such information that indicates urban versus rural settlement. Thus, although we know in general at the national level that Albanian fertility rates are higher than Serbian rates, we do not know how great these discrepancies are within urban and rural contexts, or within lower level census units. Nevertheless, historical observations suggest that although fertility decline in some ethnic groups may shift the ethnic balance in some regions (for example, perhaps among Serbs in Kosovo), a major driving force in these balances has been migration, especially at lower levels of aggregation where occupational diversity is less and social conditions more similar among inhabitants (Allcock, op.cit., Ch. 6).41
Because of the minor changes in ethnic tabulation in Serbia and Montenegro in the 1991 census and the drastic changes in Bosnia and Croatia in that year, and since we wish to include what we can of data from 1991, we are obliged to modify the system of ethnic classification for analysis. There is no perfectly satisfactory way to do that. Table 1 shows that the standard 11-category system employed 1961-81 was altered in Serbia-Montenegro in 1991 to add Romanians and Slovaks but transferred to Yugoslav the Slovenes and Macedonians.42 In Bosnia and Croatia in 1991 there were only five
categories published at the naselje level, and these transferred to Yugoslav or Other some groups numerically preponderant in other regions but minor in Croatia and Bosnia, such as Albanians and Montenegrins. Thus it is impossible to compare diversity or segregation across all census years and regions based on particular ethnic groups, since they are not consistently listed. Our solution was to reduce all of the 11-category systems to five categories, taking the four most numerous named categories in each region separately, and putting all other persons in a fifth category, Other. Note that selection of the four most populous categories in each region means that the ethnicities so chosen are not the same across the regions.43 The different nominal identity of the
five categories has no effect on the calculation of the two indices (HS, HT), although it
may affect their interpretation. Of the 100,125 observations of naselja across the four censuses, 26,481 or 26 percent were monoethnic. Of the remainder, 64,072 or 64 percent contained from 2 to 5 ethnic groups. Thus for 90 percent of the naselja, the reduction to a 5-category system has no effect.44 Only the remaining 9,572 or 10
percent contained more than 5 groups.45 Sixteen percent of these were in the Voyvodina
7. Results
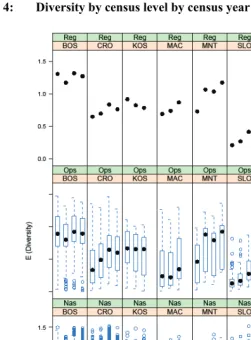
7.1 Diversity (HS)
Figure 4 is a series of boxplots showing the levels of ethnic diversity (entropy) at the levels of naselje, opština, and region, for each region, by census year. 46 “Serbia” in this
analysis means Central Serbia (sometimes called in the literature “Serbia Proper”), but here not including in any year the opštine of Bujanovac and Preševo because of the data deficiencies already noted.47 Each segment of the series can have up to four boxes, one
for each census. There is no fourth box for Slovenia, Macedonia, or Kosovo because of the absence of useful data.
Note that each location at the regional level has only one observation, and the plot contains only the dot for the median. The variability and skewness of the distributions below the region vary inversely with administrative level, greatest for naselja and less for opštine. Although the diversity within regions changes over time, roughly speaking Voyvodina has the greatest diversity48, followed closely by Bosnia, then Montenegro,
then the roughly equivalent Croatia, Kosovo, and Macedonia, then Serbia, then the least diverse, Slovenia. It is worth noting that the major element of diversity in Voyvodina is the number of ethnic groups reported, while the major element of diversity in Bosnia is the near-equal balance between the major groups.
At the regional level, diversity in Bosnia fell between 1961 and 1971, rebounded in 1981, then declined slightly in 1991. The drop in 1971 may be related to the change in census protocol, with self-declaration becoming the norm. In Croatia, diversity rose steadily 1961-81, then fell slightly in 1991. In Kosovo, diversity fell steadily 1961-81. In Macedonia, it did just the reverse. In Montenegro, diversity increased substantially 1961-91, with a slight dip in 1981. In Slovenia, diversity increased steadily 1961-81. In Serbia, it increased 1961-81 with a slight decline in 1991. In Voyvodina, it was steady 1961-71, increased slightly in 1981, then fell slightly in 1991. Overall, there was discernible although irregular increase in six of the regions, no clear change in one, and a decline in one.
At the opština level, the patterns of the medians in most regions are almost identical to those at the regional level. However, in Kosovo, there is little change in the medians, and the the distributions are more skewed downward over time, with more obvious outliers where lessening of diversity was stronger.
Figure 4: Diversity by census level by census year
Note: REG = region, OPS = opština, NAS = naselje BOS = Bosnia, CRO = Croatia, KOS = Kosovo, MAC = Macedonia, MNT = Montenegro, SRB = Central Serbia, SLO = Slovenia, VOY = Voyvodina
The anomalous pattern at the opština level in Kosovo suggests that persons were moving out of naselja where they were in the minority to naselja where they were not, but still within the same opština.49 From Table 2 it is evident that, uniquely among the
not be changed by intra-opština migration. The downturns in 1991 in most of the remaining regions suggest that migration anticipating the wars may have already begun, and that inhabitants were leaving locations where they were in the minority. It is also possible that individuals were identifying themselves differently as tensions increased. Overall, in 17 of the 24 observational frames, the pattern is one of increase in diversity, even if slight. Change is negative in only two, and these are both in Kosovo. Five frames show effectively no overall change.
The terminal drop in Bosnia may only be part of a fluctuating pattern of diversity of varying cause. The underlying raw data show that the proportion reporting Muslim ethnicity was 0.26, 0.40, 0.40, 0.44 in the successive censuses. There appears to be no simple trade-off with the reporting of Yugoslav identity, which appears as 0.08, 0.01, 0.08, 0.05. Nevertheless, some shift in ethnic identification must have played a role (see Mrdjen 2002). The proportions reporting as Croat or Serb both show steady decline, while the proportions reporting as Other (which would include some persons declining to identify an ethnicity) show a steady but slight increase. We have no direct information on internal migration rates by ethnicity, but unknown changes in rates of natural increase in the different ethnic groups may play a role. Similarly, we have no direct information on the propensity to report alternative ethnicity.
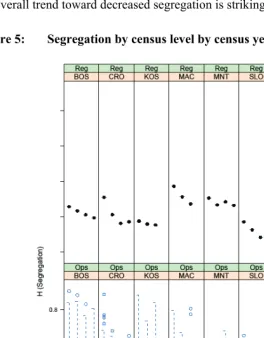
7.2 Segregation (HT)
Figure 5 examines segregation patterns. Note that only two levels are examined – opština and region, since segregation cannot be calculated at the lowest (naselje) level. As before, there is only one observation per region and thus only the median dot is shown at that level.
Fischer et al. (2004)50 suggest that changes in H
T as small as 0.02 are substantively
show small increases in segregation 1981-1991. These shifts in Croatia and Serbia may reflect changes (in residence or reporting habits) of members of the Serb minority in Croatia or of the Croatian minority in the Voyvodina county of Srem. Large numbers of Serbs were displaced from Croatia after 1991, but some anticipatory changes may have occurred and may have involved reciprocal property exchanges and relocations (see Čapo-Žmegač 2007 on such changes after 1991). Despite these sorts of irregularities, the overall trend toward decreased segregation is striking.
8. Statistical significance
How significant are the patterns that we observe? Could they be the result of chance alone? The question is complex.
1. The data examined here are not a sample but the universe of data collected. We should not ask the question of significance in the usual framework of assessment of sampling error.
2. We can, however, rephrase the question as one about measurement error and try to approach it by bootstrapping (Efron and Tibshirani 1993). We decided to ask the simplest and most fundamental question: did the observed change in the median entropy (segregation) between 1961 and 1981 exceed a level that could reasonably be attributed to random variation? We did not include 1991 for two reasons: (1) the absence of useful data for three regions in 1991 and (2) the clear change in slope from 1981 to 1991 in some regions and the complexity that would be introduced by trying to test a nonmonotonic pattern. It is important to note that this test of change from 1961 to 1981 examines only those two time points and does not address any nonlinearity, such as can be seen in the more informative boxplots. Nevertheless, this limited test does address the issue of the reliability of our interpretations by focusing on a subset that reflects the general problem of the reliability of the census and the sensitivity of interpretations to random error. Our procedure is as follows:
introduction of irrelevant variance between regions and censuses at the different dates.
- We generate Z statistics for the difference between median naselje level entropy in each republic in 1961 and 1981 as well as differences in opština and regional level entropy and segregation over the same period. (Recall that segregation cannot be examined at the naselje level.)
3. Table 3 shows the results. We ask whether the observed difference is likely to have occurred by chance alone, and we judge that likelihood as described above. Because our interpretations are directional, we double the usual critical value of alpha (0.05) to 0.10, and we accordingly mark as “significant” (in italics) those p-values that are less than 0.10.
4. Naselje Diversity: The p-values for naselje diversity are all vanishingly close to zero. None of the observed differences between the median diversity of naselja in 1961 and 1981 in any region are likely to have occurred by chance alone. Note, however that Figure 4 is more informative. The overall pattern for Bosnia is one of fluctuation that is, on average, flat. Croatia, Serbia, and Voyvodina show a flattening or downturn in 1991. While the decline in Macedonia is unlikely to be the result of chance alone, it is quite small on average, and the overall pattern over time is flat.
5. Opština diversity: All but two results are unlikely to have occurred by chance alone. The two exceptions are Bosnia and Kosovo. In neither of these regions do the boxplots show any important change between the two census dates, hence the high p value, since what we see in the differences between medians is estimates of zero.
interpretation of the graphical result, we would enjoy odds of 9:1; that is not a bet we would refuse.
7. Examining regional diversity we see that in all regions but Bosnia the p values are below 0.10. In Bosnia again, the pattern of fluctuation means that there was effectively no difference between 1961 and 1981, which is just what the bootstrap shows.
8. Examining now regional segregation, we see that all but two p values are less than alpha. The exceptions are Kosovo and Montenegro. Both of these slopes from 1961 to 1981 are very small. If the comparison in Montenegro had been 1961-1991 the difference, seen from the boxplots, would have been steeper. While we would have judged both cases to have shown decline, we must admit that at these modest declines, a small drop is not far from zero.
9. The upshot of this testing between 1961 and 1981 is that although we could not apply a general test across all four censuses in all eight regions, bootstrapping shows that where we could conduct a reasonable inferential test, our judgments were on the whole reliable. The doubtful cases are those in which a very slight decline cannot be easily distinguished from no decline, at the chosen alpha level. But in our view, art trumps probability theory. That our interpretations of the boxplots were clearly correct in almost all cases strengthens our view that in the marginal cases we were probably not far off target.
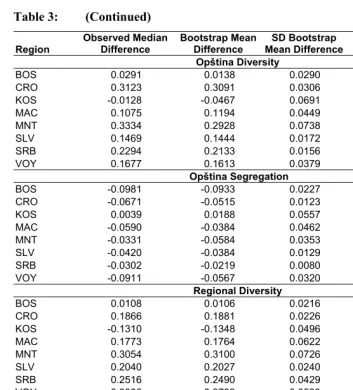
Table 3: Bootstrap results 1961 vs. 1981
Region
Observed Median Difference
Bootstrap Mean Difference
SD Bootstrap
Mean Difference Z p
Naselje Diversity
BOS 0.0605 0.0601 0.0098 6.1586 0.0000
CRO 0.1543 0.1539 0.0040 38.5852 0.0000
KOS -0.1101 -0.1105 0.0145 -7.5688 0.0000
MAC -0.0080 -0.0079 0.0030 -2.6654 0.0038
MNT 0.1080 0.1083 0.0091 11.9290 0.0000
SLV 0.0344 0.0342 0.0023 15.1044 0.0000
SRB 0.0664 0.0661 0.0017 38.4875 0.0000
Table 3: (Continued)
Region
Observed Median Difference
Bootstrap Mean Difference
SD Bootstrap
Mean Difference Z p
Opština Diversity
BOS 0.0291 0.0138 0.0290 1.0046 0.1575
CRO 0.3123 0.3091 0.0306 10.2135 0.0000
KOS -0.0128 -0.0467 0.0691 -0.1850 0.4266
MAC 0.1075 0.1194 0.0449 2.3941 0.0083
MNT 0.3334 0.2928 0.0738 4.5179 0.0000
SLV 0.1469 0.1444 0.0172 8.5384 0.0000
SRB 0.2294 0.2133 0.0156 14.7072 0.0000
VOY 0.1677 0.1613 0.0379 4.4230 0.0000
Opština Segregation
BOS -0.0981 -0.0933 0.0227 -4.3287 0.0000
CRO -0.0671 -0.0515 0.0123 -5.4656 0.0000
KOS 0.0039 0.0188 0.0557 0.0707 0.4718
MAC -0.0590 -0.0384 0.0462 -1.2783 0.1006
MNT -0.0331 -0.0584 0.0353 -0.9355 0.1748
SLV -0.0420 -0.0384 0.0129 -3.2502 0.0006
SRB -0.0302 -0.0219 0.0080 -3.7831 0.0001
VOY -0.0911 -0.0567 0.0320 -2.8495 0.0022
Regional Diversity
BOS 0.0108 0.0106 0.0216 0.4999 0.3086
CRO 0.1866 0.1881 0.0226 8.2515 0.0000
KOS -0.1310 -0.1348 0.0496 2.6408 0.0041
MAC 0.1773 0.1764 0.0622 2.8483 0.0022
MNT 0.3054 0.3100 0.0726 4.2083 0.0000
SLV 0.2040 0.2027 0.0240 8.4897 0.0000
SRB 0.2516 0.2490 0.0429 5.8624 0.0000
VOY 0.0806 0.0793 0.0533 1.5123 0.0652
Regional Segregation
BOS -0.0458 -0.0462 0.0172 2.6592 0.0039
CRO -0.1474 -0.1537 0.0184 8.0283 0.0000
KOS -0.0218 -0.0167 0.0261 0.8353 0.2018
MAC -0.1000 -0.0906 0.0418 2.3913 0.0084
MNT -0.0212 -0.0193 0.0482 0.4387 0.3304
SLV -0.0879 -0.0901 0.0251 3.4968 0.0002
SRB -0.1513 -0.1551 0.0379 3.9873 0.0000
VOY -0.0675 -0.0768 0.0284 2.3808 0.0086
9. Implications of opština boundary changes
As already noted, naselja that are almost surely the same places in different censuses are sometimes located in different opštine. The extent of these changes varies greatly across regions, and changes are most frequent in the first decade. Preliminary analysis shows that a common outcome of opština boundary shifts is to increase the measure of segregation. There are two plausible conjectures to explain the changes. The first is that they reflect ethnic gerrymandering, strongest in the earliest period but diminishing. The second is that they are an inevitable result of combining relatively monoethnic but ethnically different opštine side by side in a new opština, as improvements in communications allowed simplification of the administrative structure of government.52
We defer exploration of this question, since it requires detailed geographical analysis.53
10. Some supplemental evidence
Botev (1994) offers a sophisticated analysis of ethnic endogamy and exogamy in Yugoslavia from about the beginning of our data up to a few years before its end. Marriage event data are not recorded in the censuses; only marital status is. Botev uses event data from annual statistical reports, at the regional level. He is skeptical about journalistic reports that focus on the disruption of interethnic marriages by interethnic conflict (as are we) and sees no consistent trend in the incidence of interethnic marriages. There is an apparent contradiction between his results and ours. Botev sees no consistent trend in the degree of exogamy by region. We do see trends in the ethnic diversity of regions. Indeed, our results on ethnic diversity at the regional level are in rough agreement with Botev’s basic data on proportions of exogamic marriage in six of the eight regions. What we describe is the local residential population at various levels, approximately the structure of supply in the marriage market. Our results (on residence) are in rough concordance with Botev’s raw data on marriage events; the simple conclusion from this concordance is that the structure of supply was changing but demand was relatively constant. In an interesting log-linear analysis, Botev identifies the structure of marital preferences. Given those preferences, marriage events are still conditioned by the supply of potential spouses, which we show to be moving toward greater local diversity. A caveat on this discussion, and on Botev’s results, is that the marriage market in the former Yugoslavia was not strictly local and may have transcended regional boundaries. See also Mrdjen’s discussion of interethnic marriages (Mrjden 1996).
they would accept a person of ethnicities B…X in particular social relationships, ranging from coresidence in the same country to marriage with a close relative of the respondent. Surveys of this kind had been carried out in Yugoslavia between 1960 and 1990 (see Bogardus 1926 on the fundamental concepts of social distance). The surveys are not identical in the ethnic structure of their samples, the questions are not identical, and there are other formal differences between them, so that close comparison is not possible. One must also take the veracity of responses with a grain of salt; almost surely, given official government attitudes toward ethnic relations, respondents were likely to give politically safe answers. Nevertheless, the results are illuminating. According to Kuzmanović the earlier surveys manifest perceived distance between ethnic groups in Yugoslavia that is relatively low in comparison to that found in other, modern, multi-ethnic countries. Even in the time of economic and political crises in the 1980s, the level of ethnic intolerance (as expressed in the survey responses) was relatively low. By 1990, with the outbreak of violent rebellion in the Serb-dominated areas of Croatia, surveys show much higher perceived distance. Kuzmanović concludes that the political quarrels and economic rivalries between the republics led to an increase in expressed inter-ethnic antagonism that peaked especially after the outbreak of open hostilities between the Serbian-controlled JNA (Yugoslav National Army) and breakaway forces in Slovenia and Croatia. Prior to that, the data appear to show that interethnic antagonism was usually lower in the more diverse republics than in the more homogeneous ones. One might then expect that in the absence of armed conflict, the history of increasing diversity would have led to a diminution of interethnic social distance.
11. Summary, reflections, and conclusion
Using two commonly employed measures of ethnic diversity and segregation, we examined the censuses of Yugoslavia 1961-91. We did not attempt coverage before 1961 because the systems of administrative organization and the categorization of ethnicity varied too much from those employed 1961-91. Even inclusion of data from 1991 posed problems, requiring a simplification of ethnic classification.
furthers their political interests, especially in a country in which census takers may be regarded as agents of the police. Under the first alternative, our data show that coresidential ethnic mixture was on the whole objectively increasing. Under the second, our data show that respondents felt increasingly at ease in representing themselves as members of other than the regionally dominant ethnic group. The political implications of the two alternatives are the same.
The extraordinary ethnic diversity of the territory of Yugoslavia was historically one of local mono-ethnicity, expanding to multi-ethnicity in ever larger geographical units. Imperial conquest, refugee flight, and more recently urbanization and the disappearance of small, usually monoethnic, rural settlements over time resulted in greater mixture of the population. Over the period 1961-91 diversity at all levels mostly increased, and segregation mostly decreased. Where exceptions appear, such as in Kosovo, there is a longer recent history of severe ethnic conflict, leading to separation, rather than integration, of rival ethnic groups. While we do not yet have detailed data at all local levels to support the assertion, it is apparent from general information that the refugee flows during, following, and to some extent before the wars of separation have reversed the trends toward integration seen in the census data 1961-91. Indeed, events in Kosovo even during that period suggest that political rivalry and separatist politics were instrumental in triggering ethnic separation.
There can be no question that ethnic hostility has a long history in the region, bred of conflicts between empires and their ethnic surrogates. There can be no question but that these conflicts have erupted with sufficient frequency over historical time so that every generation has been subject to atrocity or tales of it. Nevertheless, two factors seemed to dampen such resurgence. One was state policy, perhaps most draconian in Yugoslavia after 1945, in which even telling or collecting ethnic jokes was subject to penalty.54 The other was the inexorable march of industrialization and urbanization that
mixed together populations that had previously lived in isolation, sometimes achieving diversity by deliberate encouragement of internal migration, as in the replacement of expelled German-speaking (Volksdeutsche) populations of the Voyvodina by inhabitants from distant Yugoslav areas. General measures of social distance between ethnic groups appear also to have increased as hostilities intensified, but are inversely correlated with local diversity.55
Yugoslavia. We cannot attempt to review it but simply proceed to consider the obvious alternatives.
Perhaps the most discouraging interpretation of the flow of historical events is that increasing diversity itself led to interethnic antipathy. Although direct evidence from surveys of interethnic attitudes is not as strong as we might wish, that explanation seems unlikely. Antipathy as expressed in the surveys appears to decrease with increased diversity. Further, strong evidence of interethnic antipathy seems to have appeared only after the outbreak of open conflict.
An alternative explanation would be that ethnic dissension was held in check by an authoritarian government until the discipline of the League of Communists was undermined by economic and constitutional crises after Tito’s death in 1980. This is the most plausible of the alternatives.56 Economic rivalry between the republics, and
resentment over large transfers from the wealthier regions (Slovenia, Croatia, and to some extent Serbia) to the poorer ones (Kosovo, Macedonia) grew during the 1980s. Since the 1970s the central government had pursued a path of decentralization and federalization, granting virtual autonomy even to the regions of Serbia that did not have the status of republics (Kosovo, Voyvodina). This course proved impossible to reverse and aroused secessionist tendencies simply on a regional basis but easily transformed into inter-ethnic resentment.57 Playing the ethnic card may simply have been a
convenient option for politicians seeking broad support.
Other actors, European and American, dithered until it was too late. It has been said that the alacrity of German recognition of Croatia and Slovenia after their secession, contrary to the position of the European Union, brought to mind the alignments of 1914 and 1941 (Crawford 1996). The United States and NATO were reluctant to protect the populations of Yugoslavia from nationalist frenzy until the military situation was hopeless. Why? By 1991 there were tectonic shifts in the power relationships of European states. Exhausted by the war in Afghanistan, plagued by economic difficulties, Party hegemony weakened by glasnost, the Soviet Union was collapsing. The Berlin Wall had come down in 1989. Yugoslavia was no longer important to the West as a client and entry point to the socialist and Third worlds, as an example of a socialist state independent of the USSR. Burdened by foreign debt, challenged by demands from the International Monetary Fund for repayment and recentralization of its banking system, suffering from hyperinflation and unemployment, unable to control its otherwise laudable efforts toward federalism, Yugoslavia would have needed firm support from the EU and NATO. Efforts to create a customs union or arrange entry into the European Union would have helped. That support was not forthcoming.58
Communists diminished, with an ideology that denied class distinctions and thus an alternative scenario for alignment, and with a one-party system, ethnicity as a political mobilizer was the only convenient organizational alternative (Allcock op. cit., Lipset and Rokkan 1967).
There is nothing in the demographic record to suggest that ethnic separatism was inevitable, absent the emergence of economic and political rivalry at the highest levels of government. Although Yugoslav society had its share of ethnic intolerance, there is nothing in the population record to suggest that intolerance by itself would have led to mass separatism. Our contribution has only been to add to the evidence information on population distribution that has not been part of the debate. That information supports the arguments put forth by Allcock, Denitch, and Woodward, among others, that the collapse of Yugoslavia was from the top. As the Serbian proverb prophetically informs us, this fish did stink from the head.
12. Acknowledgements
Notes
1 Translation of the Serbian proverb, “Riba smrdi od glave”. This proverb is
widely known in other European languages and is often attributed to the philosopher Erasmus (c.1466-1538) as Piscis primum a capite foetet, although it may have an older Greek origin.
2 Later censuses for some successor states exist but vary even more in coverage
and format and are not all at the same date. A carefully controlled comparative examination of the data after 1991 is not feasible at this time. There is also a rich literature on the social, political, and humanitarian outcomes of the violent collapse of Yugoslavia, especially regarding Bosnia-Hercegovina, Kosovo, and the Serbian exodus from Croatia. These works are primarily from a political science or humanitarian perspective, and we do not discuss them here because they fall outside of our time range.
3 Ethnic relations in the workplace are also important especially given the
Yugoslav practice of workers’ self management. However the census gives us no information on workplace ethnic distributions.
4 The literature on this topic is enormous. Excellent overviews from sociology,
political science, and anthropology are: Allcock (2000), Denitch (1994), Woodward (1995) and Halpern and Kideckel (2000). For an extensive view of similar issues in what have been called the wars of the communist succession, see Kaufman (2001). For problems in state formation in the Balkans, see Weiner (1971). For a general theory of geographical factors in ethnic violence, see Toft (2003). See also Goldstone (2002), Hammel (1993, 1997, 2000), Hayden (1996), Kertzer and Arel (2002), Slack and Doyon (2001), Urdal (2001), and Weiner and Teitelbaum (2001).
5 This first “Yugoslavia” was initially named the Kingdom of Serbs, Croats and
Slovenes. By virtue of its status as a large independent state rather than a part of any empire in 1914 (Croatia and Slovenia were part of Austria-Hungary, Macedonia part of the Ottoman Empire, Montenegro was small), and as an independent combatant against Austria-Hungary and the Ottomans, Serbia was given pride of place. Thus the seeds of dissension were sown.
6 Presumably, these majority stakes were calculated at the level of the municipality
in order to show differences within the superordinate level of the republic or autonomous region.
7 For brevity we use the word, Bosnia, throughout to mean Bosnia-Hercegovina.