*
Abstract— Quality Function Deployment is a qualitative
tool used in various industries to promote the quality of production process and products. Fuzzy Topsis method has been applied to overcome the inaccuracy and inconsistency in judgments for the previous matrix assessment of quality function deployment. In previous studies, using this method was problematic in the house of quality matrix. The present study examines the primary matrix (house of quality). The data related to customers’ demands have been collected from the target population and technical requirements related to these demands have been determined through expertise. Later, the influencing factors on buying shirting fabrics are prioritized using Fuzzy Topsis method. The findings reveal that main priorities are delicacy and softness, durability and loss of shirting fabrics.
Keywords: Fuzzy Topsis method, predicting production,
quality function deployment, shirting fabrics, structure of pattern and color
I.INTRODUCTION
obby fabrics cover a considerable part of textile industry. Briefly, the fabrics that can be made in this system include worsted fabrics, manteau (gown) fabrics, shawl and scarf fabrics, veiling fabrics, seat covers, certain vertical blinds, travel blankets, sheets, and shirting fabrics. Regarding the capabilities of Dobby machinery, all possible patterns for the above fabrics include striped, checkered (plaid), simple and aberrant tetron, motif background, paneled, and concentration change. With the intention of promoting the culture of producing such fabrics (men’s shirt), the present study primarily tries to investigate the entity and nature of these fabrics. In fact, production of shirting fabrics with present structure does not have a long history [1]. The researchers try to look over the process of designing shirting fabrics from the viewpoint of fashion designers who plan the market policy.
Shirting fabrics involve a significant part of clothing culture of a community, men’s clothing in particular. Furthermore with regards to the special design of shirting fabrics, the pattern and color of such fabrics are of great significance [2]. Pattern and color are among the primary components encouraging consumers to buy the fabric.
A. Davodi Roknabadi is with the Department of Design and Clothing, Yazd Branch, Islamic Azad University, Yazd, Iran. Correspondence should be addressed to A. Davodi Roknabadi (E-mail: [email protected]).
Moreover, they complement one another’s concept altogether forming the design of the fabric. Apparently in implementing the design of a dobby shirting fabric, the designer confronts with certain restrictions recognition of which can pave the way for forming the primary idea of the design. Pattern and color are two important factors in fabric designing since they are considered as the most important visual factors of designing and can attract the consumers. To overcome the present restrictions and in order to manage the present innovative designs a designer should seek answers to the following questions: 1. What position the new designs will take in comparison with old ones? 2. What position will be taken by new colors? 3. What kind of texture and design of colorful threads is more attractive? 4. Will the proposed design be admitted by the consumer? The texture and decorating colorful threads are two primary facilities to pattern the fabrics, and the designer realizes his/her desired design using these factors. Dobby fabrics affect a huge part of textile industry [3].
Some studies propose methodologies in which the criteria are selected based only on their weight, given by several decision makers. In this case, the decision on what alternative criteria to pick is based on a single factor: the relative importance judged by the decision makers. However, the decision on which criteria to choose should be based on multiple requirements related to performance and strategic objectives, which in turn depends on the type of item to be purchased as well as on the type of industry [18].
In addition to design and color which are important ascetic factors, other qualities such as delicacy and softness and ironing abilities are also considerable. Such qualities represent the inner feelings of the designers and encourage the consumers to buy the fabrics. However, consumers’ personal impressions of the physical properties of the fabric may be different from the technical terms of the manufacturers and vendors. In general, physical properties of a textile fabric depends on various factors such as the type of fibers, type of the thread, type of texture, and type of coloring. Each of these factors plays a role in determining the final characteristics of the product.
Quality and customer orientation have been considered as two important competitive challenges; therefore, to preserve and extend the domestic and foreign markets offering high quality products and services through meeting customers’ needs is required. As a means of comprehensive quality management, Quality Function Deployment (QFD) allows realization of the above
D
Analyzing the Structure of Pattern and Color of Shirting
Fabrics and Predicting their Production and Prioritizing the
Factors Affecting their Buying
considerations for manufacturing and service providing industries [4]. Expressing customers’ needs in form of technical characteristics of the products is difficult even when products are designed by multifunction teams. Customers’ needs are often ambiguous and even sometimes contradictory. Since the time for expressing the technical characteristics is different from that of expressing customers’ needs, customers’ voice is often lost, the result of which is a product which does not fully meet the needs of the customers. QFD is a premium method to hear customers’ voice. QFD assures that the customer is at the center of all designing practices and that he determines all designing interaction [5].
II.THEORETICAL FOUNDATIONS
A. Structure
In general, the term ‘structure’ is attributed to the pattern or the tangible/ intangible relationships among the components of a group, which is realizable through observation or recognition of the pattern. The term ‘structure’ is used in various sciences such as chemistry, construction, biology, music, social sciences, and computer suggesting different concepts. Moreover, in art structure refers to the location of motif and design, which suggests kind of composition in works of art including applied and utter arts.
B. Pattern
Based on the present study, pattern is defined as “the use of colorful threads in warp and/or woof and combining the fibers of the sinew via weaving formulations in order to manufacture fabrics with striped, checkered, aberrant, solid, and motif background designs.
C. Color
Creating a particular dimension in the fabric via textile chemistry technics is defined as color. In other words, color is a reflection of light which turns out in different forms and includes a wide range.
D. Shirting Fabric
This is a layered flexible fabric made of a web of natural or artificial threads or fibers. Here, the type of the threads and their structure make up the physical properties of the fabric. In terms of weaving methods, fabrics can be divided in various groups including warp-woof, annular tissue, tying etc. In respect with the used materials, fabrics can be cotton, woolen, silk etc. Warp-woof methods are used to make shirting fabrics [6].
E. Quality Function Deployment
QFD is a noble manner in which customers’ demands are heard throughout the organization. QFD is a systematic strategy to make sure of considering the voice of the consumers in all stages of planning and designing the product [10]. This method consists of four matrices. Since full implementation of the four-matrix approach is time demanding, the present study concentrates on the first matrix, namely house of quality. Generally in this matrix, customers’ needs should firstly be recognized and
prioritized; then, technical requirements must be determined in order to meet the needs. The next step examines the relationship between the customers’ needs and technical requirements. Finally, the technical requirements are ranked. QFD first emerged in Japan in 1966. In 1972, the developed version of QFD was applied in Kobe Shipyard by Akaou. In 1986, Ford employed this method, after which the method was developed in Europe and the U.S [11]. Through considering the customers’ needs in designing the product and the process, QFD increases the competitive capabilities of the organization, decreases loss and rework, increases the speed of responding market needs, and increases the organization profitability [12]. Multi-attribute decision making methods are seeking to solve the problems [13]. In the past decade, various studies have been conducted on quantifying the discussions on house of quality mostly concentrated on identifying customers’ needs. Among these, one can refer to fuzzy theory for ranking customers’ needs; employing fuzzy theory together with multi-attribute decision making approaches [14]; employing hierarchical analysis to determine the relative significance of customers’ needs [15]; employing linear planning model in designing products in order to maximize customers’ satisfaction; and employing hierarchical analysis together with QFD. Furthermore, some have tried to promote QFD; for instance, it has been tried to present a 3-matrix version of the method [16]. The problem of the method in identifying customers’ needs is that the digits within the matrices may be incompatible. The integrated approach in the current study can remove this shortage. In the process of using Fuzzy Topsis in QFD, in some studies, Fuzzy Topsis has solely been used to calculate the weights of the customers’ needs. Some studies have also used an integrated approach of QFD and Fuzzy Topsis. In some studies, this method has been used to calculate the digits within the matrices, which is a modified version of the second mode in the present study.
On the other hand, the texture of a fabric, type of treatment, weight and some other factors are also important in forming the physical properties of the fabric, some of which will be discussed below.
1) Softness
Softness is regarded as the resistance and reactions of the fabric surface against touching. In general, fabrics with a fluffy surface are softer, and by increasing the fluffy coverage, the softness also increases [2].
2) Ironing ability
Ironing ability is an important factor desired by consumers, which is related with wrinkling. In few cases combining of various fibers in spinning process results in fabrics with high ironing ability.
quality, fabrics are usually subjected to anti-wrinkling treatment [2].
3) Color transparency
Shirts with live and transparent colors are more favored by the consumers rather than shirts with opaque colors. It must be noted that by transparent and opaque colors we do not mean light and dark colors. For example, while speaking of black as the darkest color, it covers different tones ranging from absolute black which is transparent to smoky black which is an opaque color.
4) Delicacy
Delicacy of a fabric has a positive relationship with delicacy of the used fibers and threads. Fiber delicacy (tenderness) is an important factor determining the use of the fiber. For instance, thick fibers are not commonly used in textile industries; rather, they are used in products such as brush or broom [2].
Threads used in shirting fabrics are pretty delicate. In the system of synthetic yarns, threads with numbers of 100 and 150 Denier are usually preferred. Also in metric system, 30.2 and 40.2 ply yarns are commonly used.
5) Color stability
A great majority of the complaints made by consumers of textile products are concerned with their color stability. Color stability varies based on the type of the dye, depth of the shade and the process of dying. The dye represents different behavior when subjected to different materials. The behavior is set depending on the type of the application.
Any textile product is to be subjected to various materials and factors. Factors such as light, rinse, dry cleaning, water, sweat, and ironing affect the color stability [2].
6) Dimensional stability of the fabric
So far, the most concentration on shrinkage has been concerned with length and width. However in some cases, dimensional changes occur in cloths leading to changes in the form and model. This instability is most apparent in knitted fabrics since there is more possibility of movement of the knitted rings.
In respect with shirting fabrics, lack of consolidation in the process of final treatment can be a factor in determining the dimensional stability. Indeed, the factor may be shrunk or tightened in length or width. Even sometimes the fabric may be puckered in the place of the seam [2].
7) Durability
Durability and lifetime of a fabric strongly depend on the type and amount of use. Therefore if a fabric is made regardless of the type of use (application), it will soon lose its quality. The most important factors in this regard include selection of an appropriate fiber and the structure of the fabric [2].
8) Loss
One of the properties which play an important role in determining the quality of a fabric is the loss of the fabric.
Fabric weight and dryness are the factors affecting this loss. In fact increased weight and dryness of a fabric lead to increased loss. Therefore, an appropriate balance in weight and dryness of a fabric results in desired loss [2].
Type of the fibers used in the fabric is also effective on the loss. In general, fabrics made of high-tense fibers have better loss [2].
9) Lack of odor
Regarding the fabric material and the type of the yarns being used is very important. Cotton cloths absorb sweat much better while nylon cloths absorb less sweat and the sweat remains on the body surface causing terrible odor. However, the most important factor regarding the odor is the type of the final chemical treatment on the fabric. In fact, this can be realized via nanotechnology. Moreover, type of the texture may result in a fabric with better ventilation of the skin preventing unpleasant odor [2]. 10) Fabric permeability against wind and thermal (cooling) characteristics
One of the most important reasons for wearing cloths, regardless of their coverage, is protection of the body against atmospheric conditions. These conditions include heat, coldness, moisture, dryness, and wind. The fabric appropriately chosen against each of these conditions can be of great comfort.
F. Methodology
The present research was a descriptive-correlative study conducted as a field work. Regarding the goals of the study, the population was determined to be the customers, production managers, and the supervisors of the companies located in Yazd. Morgan table was used to calculate the sample size which was determined to be n= 36. In order to increase the accuracy, 40 individuals were selected via random sampling, 36 of which accepted to cooperate with the researcher. Questionnaires were used to collect data. The components of the questionnaire were determined based on the review of the literature and expertise poll via Delphi method.
In order to determine the validity, the questionnaire was examined by professors and experts of fabric designing. After validation of the questionnaire, a primary study was conducted. With regards to the reliability of the questionnaire, the obtained Cronbach’s alpha (α= 0.853), the reliability was confirmed.
Three main goals of the study include applying Fuzzy Topsis approach in QFD in order to remove the incompatibilities in the decision making of the customers and the QFD team, finding a solution to the problem concerning the use of QFD in house of quality, and prioritizing the technical requirements and employing them in the process of manufacturing shirting fabrics.
On the other hand, the secondary goals of the study may include identifying the needs of the consumers of shirting fabrics, and identifying technical requirements concerning these needs.
hierarchical analysis; also whether it is possible to respond customers’ needs more appropriately through employing a moderated QFD technique.
The data for the present study was collected from the related magazines, documents, and customers’ complaints as well as field studies consisting of interviewing the customers, production managers, and supervisors. Fundamental practices of the process include identification of the customers’ needs and the relationships between the needs and technical requirements. Customers’ demands were ranked by identifying the main buyers and normal customers, and distributing questionnaires among them. Customers’ needs and demands were identified through the review of the documents and complaints, and interview the final consumers and vendors of shirting fabrics. Final analysis has been done by the company officials.
The process of the research is as follows:
Formation of QFD team: it was tried to employ individuals with various levels of knowledge and various attitudes in the team in order to achieve optimal results. The team tried to identify the customers and their needs and to investigate how to realize these needs. Based on Cochran’s formulation, questionnaires were distributed among the customers of the company including main buyers (those who frequently buy the products of the company) and normal buyers.
Primary demands of the customers included application of shirting fabrics in different places and situations, lack of odor, dimensional stability, durability, color stability, color transparency, delicacy, ironing capability, appropriate loss, and softness.
G. QFD Method
QFD is a tool converting customers’ needs into characteristics of products/ services. In this method, customers’ needs are collected in an organized manner. Then regarding the organization resources and capabilities, it is tried to respond to the needs and demands. In fact, QFD is a system translating customers’ needs into appropriate products.
1) Customer’s needs
Here, needs refer to the demands which can satisfy the customer in change of buying products or services. Customer’s needs are divided into three groups:
2) Basic needs
These are characteristics of the product removing customers’ needs regarding the main goal of manufacturing the product. These needs should necessarily be considered in product regardless of the customer’s desire.
3) Functional needs
These needs are concerned with quality function whose increase results in increased satisfaction in customers. In other words, these needs are the voice of the customers. 4) Motivating needs
Here, the customer may be unaware of the need and does not feel any urgent need. However, embodiment of the feature in the product increases the customers’ satisfaction. Realizing such needs may result in re-buying. In defining QFD, product function has been emphasized. Notably, function is different from feature. Function is a qualitative factor while feature is quantitative. Put in simple words, function refers to the efficacy, and the tool capabilities of product seek to remove more needs of the customers [7]. H. Fuzzy Topsis Technique
Topsis is one of the common methods in Multi-Attribute Decision Making (MADM). To implement this method, we need a decision making matrix whose rows are, indeed, the alternatives and the columns are the attributes. Using a systematic approach, one can extend Topsis method to fuzzy environment. Based on this method which was presented in 1981 by Huang and Yong, any MADM problem with m alternatives analyzed by n criteria can be regarded as a geometric system consisting of m points in an n-dimensional space. The technique is based on the concept that the selected alternative should have the least distance from the negative ideal solution (the worst solution). It must be noted regarding ranking the factors that in a case where quantitative data are required, they can be presented in numbers and digits but when the study is
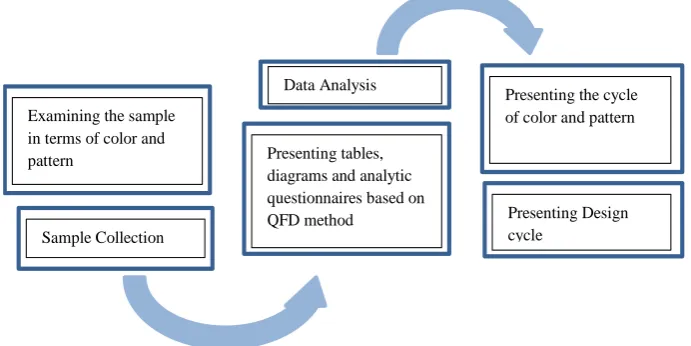
Fig. 1. Methodology flowchart. Examining the sample
in terms of color and pattern
Sample Collection
Presenting the cycle of color and pattern
Presenting Design cycle
Presenting tables, diagrams and analytic questionnaires based on QFD method
conducted in qualitative environment and the knowledge is unclear and relative, data cannot be presented in digits and numbers. Hence, a realistic view would prefer verbal and fuzzy data rather than digits and numbers. This verbal model is applicable to a wide range of problems, among which one can refer to data recovery, medical diagnosis, education, choosing suppliers, and decision making [8].
The purpose of this paper is to contribute the notion of ordered fuzzy numbers (OFNs) to deal with problems defined in this way and involving uncertain information given in linguistic terms which is difficult for the experts to express when making decisions. We show that OFNs allow us to take into account the ambiguities occurring when expressing linguistic variables. Trapezoidal ordered fuzzy numbers are employed to deal with imprecisely expressed intermediate quantities, such as “more than 2” or “less than 2” together with exact quantities, such as “2”. To express such fuzzy preferences we use trapezoidal ordered fuzzy numbers because they are easy to use and interpret [17].
I. Research Questions
The main questions in the present study are as follows: 1. What is the condition of the structure of pattern
and color, and the prediction of the production of shirting fabrics in Iran?
2. What are the priorities of the factors effective in producing shirting fabrics in Yazd Province?
III.RESULTS AND DISCUSSION
In order to implement QFD, firstly a set of customers’ ideas and opinions was collected through distributing a questionnaire. As it is obvious, all the characteristics considered for appearance and customers’ needs are composed of a set of qualitative features, and the interests of the participants, based on QFD, are classified as much, mean, and little. These three alternatives are starting points to quantify the features and prioritize the customers’ ideas. After completion of the questionnaire by the participants in the project, the three characteristics mentioned in the questionnaire were weighted and averaged. For instance the number of individuals selecting much, mean, and little for striped design was summed up. The same process was performed for all the components of the questionnaire before entering the next stage of the project. After this stage, based on mathematic calculations and fuzzy Delphi method, the following numbers were attributed to the alternatives: Much: (6, 8, 10, 10); Mean: (3, 4, 4, 7); Little: (0, 0, 2, 4).
Now the project enters the next stage where components which are closer to the alternative “much” are selected and given to the participants again in a different chart. Finally, all characteristics were determined using fuzzy Delphi. Then certain weights were attributed to the characteristics using hierarchical analysis, the result of which is reported in the column of house of quality.
A. House of Quality (HOQ)
This technique is one of the best known ways to implement QFD. In this manner, prioritization of
customers’ needs is done via marketing and via themselves. Some regard HOQ as the basis of QFD, and consider it as the best technique of comprehensive quality management. This technique is the developed version of QFD. Product planning, promotion, development of the elements, process planning, and production practices are the main elements of HOQ.
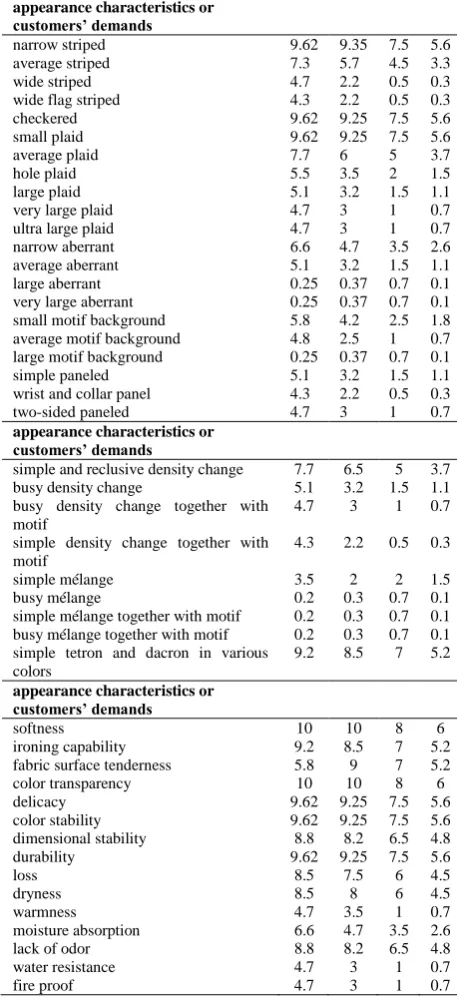
TABLE I
APPEARANCE CHARACTERISTIC OR CUSTOMER DEMANDS (QUESTIONNAIRE AVERAGE)
appearance characteristics or customers’ demands
narrow striped 9.62 9.35 7.5 5.6
average striped 7.3 5.7 4.5 3.3
wide striped 4.7 2.2 0.5 0.3
wide flag striped 4.3 2.2 0.5 0.3
checkered 9.62 9.25 7.5 5.6
small plaid 9.62 9.25 7.5 5.6
average plaid 7.7 6 5 3.7
hole plaid 5.5 3.5 2 1.5
large plaid 5.1 3.2 1.5 1.1
very large plaid 4.7 3 1 0.7
ultra large plaid 4.7 3 1 0.7
narrow aberrant 6.6 4.7 3.5 2.6
average aberrant 5.1 3.2 1.5 1.1
large aberrant 0.25 0.37 0.7 0.1
very large aberrant 0.25 0.37 0.7 0.1 small motif background 5.8 4.2 2.5 1.8 average motif background 4.8 2.5 1 0.7 large motif background 0.25 0.37 0.7 0.1
simple paneled 5.1 3.2 1.5 1.1
wrist and collar panel 4.3 2.2 0.5 0.3
two-sided paneled 4.7 3 1 0.7
appearance characteristics or customers’ demands
simple and reclusive density change 7.7 6.5 5 3.7 busy density change 5.1 3.2 1.5 1.1 busy density change together with
motif
4.7 3 1 0.7 simple density change together with
motif
4.3 2.2 0.5 0.3
simple mélange 3.5 2 2 1.5
busy mélange 0.2 0.3 0.7 0.1
simple mélange together with motif 0.2 0.3 0.7 0.1 busy mélange together with motif 0.2 0.3 0.7 0.1 simple tetron and dacron in various
colors
9.2 8.5 7 5.2 appearance characteristics or
customers’ demands
softness 10 10 8 6
ironing capability 9.2 8.5 7 5.2
fabric surface tenderness 5.8 9 7 5.2
color transparency 10 10 8 6
delicacy 9.62 9.25 7.5 5.6
color stability 9.62 9.25 7.5 5.6 dimensional stability 8.8 8.2 6.5 4.8
durability 9.62 9.25 7.5 5.6
loss 8.5 7.5 6 4.5
dryness 8.5 8 6 4.5
warmness 4.7 3.5 1 0.7
moisture absorption 6.6 4.7 3.5 2.6
lack of odor 8.8 8.2 6.5 4.8
water resistance 4.7 3 1 0.7
fire proof 4.7 3 1 0.7
yet can be identified, and low optional technical responses can be recognized. The appearance of this model looks like a house, and therefore, it is called house of quality. What follows is a simplified sample of house of quality for substituting the components of the project.
TABLEII
HOUSE OF QUALITY MATRIX FOR PHYSICAL CHARACTERISTICS EXPECTED BY THE CUSTOMERS
ty p e o f th e te x tu re s us ed i n t h e fa b ri c ty p e o f fi n a l tr ea tm en t (c h emi ca l) ty p e o f fi n a l tr ea tm en t (p h y si ca l) ma te ri a l a n d t h e w a y o f u sa g e fa b ri c w ei g h t si n ew ( w a rp a n d w o o f) d en si ty project requirements significance customers’ needs 0.2775 lack of odor
0.1045 dimensional stability 0.1003 durability 0.0984 color stability 0.0874 color transparency 0.07992 delicacy 0.0724 dryness 0.06864 ironing capability 0.0616 loss 0.0447 softness
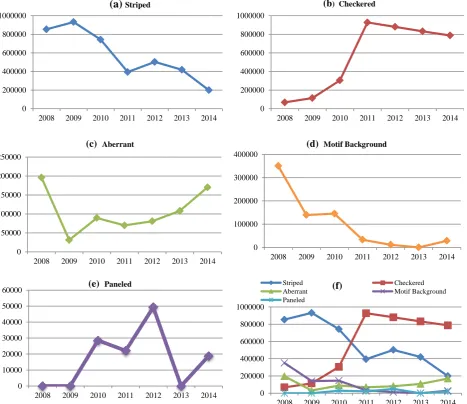
Relationship: Strong Average Weak After weighting and determining the importance rank of each of the components, the relationship between customers’ needs and designing requirements will be examined and the diagrams corresponding to each of the components will be drawn. On this basis, the area covered by each of the designs in the target population during the
studied period can be represented in separated tables as in the following. The number of the shirts of each design and their dispersion during the period 2008-2014 are presented as follows (Fig. 2).
In order to examine the research question regarding the priority of the effective factors in production of shirting fabrics, Fuzzy Topsis which is one of MADM methods has been used. Table IV represents the output of this technique composed according to the formulations presented in the discussion on Fuzzy Topsis.
TABLE IV
RESULTS OF PRIORITIZING THE COMPONENTS AND CRITERIA OF POWER DISTRIBUTION COMPANY
code functional criterion
d
id
i significancepercentage
A1 softness 0.01 0.035 0.782
A7 durability 0.011 0.032 0.749
A8 loss 0.013 0.031 0.697
A9 lack of odor 0.016 0.026 0.616 A2 ironing capability 0.018 0.024 0.569 A6 dimensional stability 0.021 0.024 0.525 A5 color stability 0.028 0.015 0.351 A3 color transparency 0.031 0.014 0.304 A10 permeability against wind and
thermal properties of the fabric 0.031 0.013 0.3
A4 delicacy 0.033 0.012 0.272
IV.CONCLUSION AND RECOMMENDATIONS So far, brief explanations were presented to a Dobby designer, according to which a Dobby designer can take advantage of the facilities in pattering fabric surface with various textures, colorful yarns, motif, and a combination of these factors. Hence, enough knowledge on each of these factors can contribute to make a more nearly complete pattern because combining these factors can arise new issues. For instance, if a designer uses a particular yarn without having enough information on it, the knitting machine will confront serious problems within the first several meters. Therefore as it was seen, having enough knowledge on the structure of yarns and textures is inevitable to a designer in a Dobby, Jacquard, or annular
TABLE III
HOUSE OF QUALITY MATRIX FOR APPEARANCE CHARACTERISTICS EXPECTED BY THE CUSTOMERS
v ia d ec o ra ti n g t h e co lo rs a n d sm a ll w a rp r a p p o rt s v ia d ec o ra ti n g t h e co lo rs a n d a v er a g e w a rp r a p p o rt s v ia d ec o ra ti n g t h e co lo rs a n d l a rg e w a rp r a p p o rt s v ia d ec o ra ti n g t h e co lo rs a n d sm a ll s in ew r a p p o rt s v ia d ec o ra ti n g t h e co lo rs a n d a v er a g e si n ew r a p p o rt s v ia d ec o ra ti n g t h e co lo rs a n d l a rg e si n ew r a p p o rt s b a si c te x tu re s in n o v a ti v e te x tu re s (m o ti f) v ia v a ri o u s d en si ti es in we a v in g sh o u ld er fa n cy y a rn s co lo rf u l y a rn s a rr a n g eme n t a n d t h e ca p a b il it ie s o f p o ly w ir in g d ev ic es n o . o f b la d es a n d f ee d in g th e b la d es o f w ea v in g ma ch in er y project requirements significance customers’ needs 0.451 dacron and simple tetron
in various colors
0.253 checkered 0.167 plaid 0.126 striped
system. In fact, if a fabric designer regards himself as an artist solely, or as a textile engineer solely, he cannot finish the designing process appropriately. In other words, fabric designing is an art-industry.
By identifying the problems of the organization, managers can lead the organization towards perfection. They can become aware of the customers’ needs through techniques such as QFD, and can provide the customers with best appropriate products. Employing quality techniques regardless of the proper principles and stages can discourage the employees. On the contrary, considering the pre-requisites and stages, selection of appropriate control diagrams, and logical sampling decrease the costs and increase productivity.
As it can be seen from the results of house of quality and the diagrams of customers’ needs, significance of 0.451 corresponding to aberrant and simple Tetron designs got the first rank, which is in agreement with the progress in the area covered by this design in 2014. This shows that based on the voice of the customers, these designs are well accepted by them and may continue to be the first choice in
the several next years. Also plaid and checkers designs with a significance of 0.253 and 0.167 respectively stand on the second and third ranks. Finally, narrow striped design with the significance of 0.126 is the fourth rank regarding the customers’ demands. The falling curves of these designs confirm this finding. It seems that the designs with low ranks, paneled and motif background in particular, may create nostalgia for the customers sometime in the future and may be demanded again. Based on the study of the trend of demanding designs and patterns, one can predict the market of shirting fabrics in the future years. However, this cyclic trend cannot be a very regular one, as in 2006, after the checkers design, aberrant and striped designs were demanded while in 2014, firstly aberrant design was demanded followed by demands for checkers and striped designs. A close study of this issue can be an interesting topic for future research.
Another finding of this research project was that the three designs with most demands were accompanied with lower risks on the part of manufacturers. As it can be observed in the community, individuals who select shirt as
Fig. 2. Sample area covered by a) Stripes, b) Checkered, c) Aberrant, d) Motif Background , e) Paneled ; within 2008-2014 . f) Shirt design and their dispersion (2008-2014).
0 200000 400000 600000 800000 1000000
2008 2009 2010 2011 2012 2013 2014
(a) Striped
0 200000 400000 600000 800000 1000000
2008 2009 2010 2011 2012 2013 2014
(b) Checkered
0 50000 100000 150000 200000 250000
2008 2009 2010 2011 2012 2013 2014 (c) Aberrant
0 100000 200000 300000 400000
2008 2009 2010 2011 2012 2013 2014 (d) Motif Background
0 10000 20000 30000 40000 50000 60000
2008 2009 2010 2011 2012 2013 2014 (e) Paneled
0 200000 400000 600000 800000 1000000
2008 2009 2010 2011 2012 2013 2014
Striped Checkered
Aberrant Motif Background
Paneled
the first choice for clothing are mostly above 30 years old or prefer a classic clothing appropriate to their jobs and position. They may add a jacket or a suit to complement their clothing style. Apparently selecting a solid shirt or a checkers/striped one to fit the suit/jacket seems much easier than selecting a paneled or motif background one. This may add to the area covered by simple tetron, aberrant, checkers, and narrow striped. As it was mentioned before, individuals who select shirt as the first choice for clothing are mostly above 30 years old or prefer a classic clothing appropriate to their jobs and position. Therefore, future research can be done to examine the relationship between the designs proposed in worsted fabrics of suits and shirt patterns. Since these two items are usually complementary, they might be interactive in terms of design or pattern. In the end, it is hoped that the current study manages to pave the way for promoting the level of producing Dobby products and shirting fabrics in particular.
REFERENCES
[1] A. Ahmadi, A. Davoudi, and A. Ayati zadeh, “Designing shirting fabrics using Jacquard equipment”, 3rd National Seminar on Textile
and Garbage, 2011 (in Persian).
[2] F. Dadashian and G. Goudarzi, “Physical tests on fabrics”, Jahad Daneshghahi Press, Amir Kabir University, 2005 (in Persian). [3] H. Sherafat and A. Behdane, “Investigating the effect of ironing on
common shirting fabrics", 3rd National Seminar on Textile and
Garbage, 2011(in Persian).
[4] M. Ghasedi and M. Ghasedi, “Increasing customers’ satisfaction in software services via house of quality", The International Conference on Management and Humanities, 2015 (in Persian). [5] S.Golshan, H. Javanshir, and F. Ma’danchi, “employing quality
function deployment in producing men’s shirt", The 4th National
Seminar of Engineering and Innovation Management, 2012 (in
Persian).
[6] A. Norouzi, M. Zarei, and P. Mustafa Abidi, “Investigating the reasons for employees’ unwillingness to learn english (second language) using AHP technique and presenting strategies using house of quality", 3rd National Seminar on Pathology of
Organizational Education, 2014 (in Persian).
[7] B. K. Behera, “Role of fabric properties in the clothing-manufacturing process", Gar. Manu. Technol, Woodhead Publishing, pp. 59–80, 2015.
[8] M. Khani and K. Feizi, “Assessment of the quality of E-Services using web quall model", International Conference on Quality Engineering, 2012 (in Persian).
[9] L. Tseng, C. C. Tang and C. J. Sun, “A study on the Braille elevator signage system in public buildings: The QFD perspective”, Procedia Soc. Behav. Sci., vol. 85, pp. 152-163, 2013.
[10] L. H. Chen and M. C. Weng, “A fuzzy model for exploiting quality function deployment", Math. Comput. Model, vol. 38, pp. 559-570, 2003.
[11] H. Ashtiani and M. Houshyar, “Customer-centered approach to planning and improving the quality of products", Tehran: Atena, 2001 (in Persian).
[12] L. K. Chan and M. L. Wu, “Quality function deployment: a literature review", Eur. J. Oper. Res.,vol. 143, no. 3, pp. 463-497, 2002.
[13] M. Momeni, “New research discussions in operations", Tehran University, College of Management, 2006 (in Persian).
[14] G. Z. Jia and M. Bai, “An approach for manufacturing strategy development based on fuzzy-QFD", Comput. Ind. Eng, vol. 60, no.3, pp. 445-454, 2011.
[15] R. A. Hunt and F. B. Xavier, “The leading edge in strategic QFD",
Int. J. Qual. Reliab. Manag.,vol. 20, no. 1, pp. 56-73, 2003. [16] M. Zarei, M. B. Fakhrzad, and M. J. Paghaleh, “Food supply chain
leanness using a developed QFD model", J. Food. Eng., vol. 102, no 1, pp. 25-33, 2011.
[17] E. Roszkowska, and D. Kacprzak, “The fuzzy saw and fuzzy TOPSIS procedures based on ordered fuzzy numbers”, Inf. Sci., vol. 369, pp. 564-584, 2016.