Vol.7 (2017) No. 6
ISSN: 2088-5334
Structural Behaviour of Steel Building with Modified X-Braced EBF
(Eccentrically Braced Frames) by Pushover Analysis
Yakni Idris
#, Saloma
#, Hanafiah
#, and Federico
##
Civil Engineering Department, Sriwijaya University, Indralaya, Sumatera Selatan 30662, Indonesia E-mail: [email protected]
Abstract—In this paper, modified X-braced EBF steel frame is designed using pushover analysis. This study discussed five models of a
steel building with 10 floors. The dimension of each model is 18 m width, 18 m length, and 4 m height. The building has a function as an office in Palembang. The building uses two types of EBF bracing, that is X with a vertical link and horizontal link. The result of the study shows that X bracing, with horizontal link model, has the best effectiveness to increase building stiffness and strength. Model 5 with X Bracing and horizontal link can reduce storey drift to 57.71 %, and drift ratio is 72.38%. By pushover analysis, this model gained the most effective performance point with base shear of 441.67 ton. The performance of the five building models is immediate occupancy (IO).
Keywords— pushover analysis; performance point; immediate occupancy
I. INTRODUCTION
One of the systems that are used to decrease a risk of damage caused by an earthquake is the bracing system. Generally, the bracing system used in the steel structure. The design of steel structure has three types. They are moment resisting frame (MRF), concentrically braced frame (CBF), and eccentrically braced frame (EBF). EBF is a combination of two conventional bracing systems namely MRF and CBF. The characteristic of bracing EBF has link beam. The usage of EBF is to reduce the seismic load. Bracing EBF has bigger ductility compared to MRF and CBF, so that the energy dissipation capacity increased [1], [2], [3]. In EBF system, the usage of vertical link caused base shear decreased compared to horizontal link so that EBF has been found small displacement and energy dissipation increased [4], [5]. This paper discussed the response of steel structure to resist earthquake by pushover analysis. There are five models of a steel structure with ten floors using X bracing with a vertical link and horizontal link. The length of link beam is 1 m. The purpose of this study is to analyses plastic hinge distribution, to investigate the first plastic hinge formation, to determine the performance level of the building based on ATC-40, and to evaluate the effectiveness of the models to reduce seismic energy. The scope of the discussion in this study is seismic performance analysis by pushover analysis. The result is drift storey, drift ratio, capacity curve, performance level, and plastic hinge formations and propagation.
Pushover analysis can be used for indicating the damage of structures. Pushover analysis is a way of nonlinear static analysis by simplification of the time history nonlinear analysis [6], [7], [8]. Pushover analysis is done by applying an incremental load in a structure until a certain condition. The static load value increased gradually which caused the first yield. Pushover analysis identified the weakness in structure so that the structural element can be strengthened based on the weakness. Pushover analysis produced pushover curve which describes the correlation between shear and displacement. Pushover analysis also produced the comparison of performance level to structure [9], [10], [11]. The main steps of pushover analysis are [12], [13]:
• Determine point control to monitor the structure displacement
• Calculate capacity curve based on several kinds of lateral force distribution
• Estimation of lateral displacement
• Evaluate structure performance level with control point on target displacement based on ATC-40 As can be seen from Fig. 1, point B represent the yields a condition of the structure. From point B to point C showed the plastic deformation of the structure. Point C, D, and E represent the ultimate capacity, the residual strength, and total failure of structure from pushover analysis.
A
D C
B
IO
E
LS CP
Deformation
F
o
rc
e
Fig. 1 Pushover curve (ATC-40)
II. MATERIAL AND METHOD
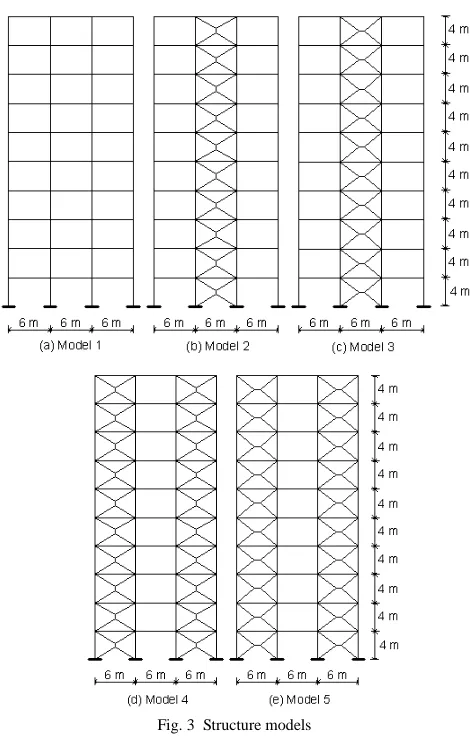
In this study, two model of the frame to be analysed, e.g., moment resisting frame (Model 1), and four eccentrically braced frame (Model 2, Model 3 and Model 4).
Steel sections used in this study are shown in Table 1. The mechanical properties of steel sections with the yield strength 340MPa and E 200,000MPa.
The plan of the building can be seen in Fig. 2, and the thick line (red line) showed the position of the bracing. The span of the beam is 6 m, and the floor height is 4 m, and the building consisted of 10 floors. Fig. 3 showed the five models to be studied.
TABLE I STEEL SECTIONS USED
Storey Column Section
Beam Section
Diagonal Bracing
Vertical and Horizontal
Bracing
10 W10x100 W16x40 W8x31 W8x48
9 W10x100 W16x40 W8x31 W8x48
8 W10x100 W16x40 W8x31 W8x48
7 W12x120 W16x40 W8x31 W8x48
6 W12x120 W16x40 W8x31 W8x48
5 W12x120 W16x50 W8x31 W8x48
4 W14x176 W16x50 W8x31 W8x48
3 W14x176 W16x50 W8x31 W8x48
2 W14x176 W16x50 W8x31 W8x48
1 W14x370 W16x50 W8x31 W8x48
Fig. 2 Building plans
Fig. 3 Structure models
III. RESULTS AND DISCUSSION
A. Building’s Mass and Base Shear
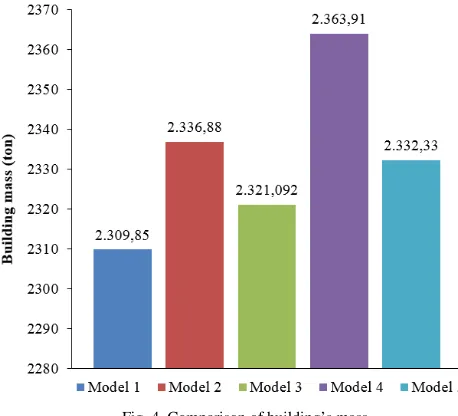
The ground motion generates internal forces caused by the building mass vibration. The comparison of building’s mass of each model is shown in Table 2 and Fig. 4.
TABLE II
COMPARISON OF BUILDING’S MASS
Storey Building’s mass (ton)
Model 1 Model 2 Model 3 Model 4 Model 5
10 136.81 138.19 137.40 139.57 137.99
9 235.96 238.73 237.14 241.49 238.33
8 235.96 238.73 237.14 241.49 238.33
7 236.84 239.61 238.03 242.38 239.21
6 237.80 240.57 238.98 243.33 240.17
5 239.80 242.57 240.99 245.33 242.17
4 242.35 245.12 243.54 247.88 244.72
3 245.03 247.79 246.21 250.56 247.39
2 245.03 247.79 246.21 250.56 247.39
1 254.22 257.75 255.40 261.28 256.59
The base of a structure is considered to be the level where the ground motions are imparted into the structure. Base shear is an estimate of the maximum expected lateral force that will occur due to seismic ground motion at the base of a structure. Base shear (V) is a function of buildings mass. The comparison of base shear of each model is shown in Table 3 and Fig. 5(a) and 5(b).
Fig. 4 Comparison of building’s mass
TABLE III COMPARISON OF BASE SHEAR
Model
Scale Factor (g.I/R) Base Shear (ton) x-direction y-direction Vx Vy Model 1 1.226 1.226 39.138 33.595
Model 2 1.226 1.226 49.508 44.290
Model 3 1.226 1.226 53.479 51.103
Model 4 1.226 1.226 57.865 52.370
Model 5 1.226 1.226 65.510 63.629
Fig. 5(a) Comparison of base shear Vx
Fig. 5(b) Comparison of base shear Vy
B. Lateral Displacement
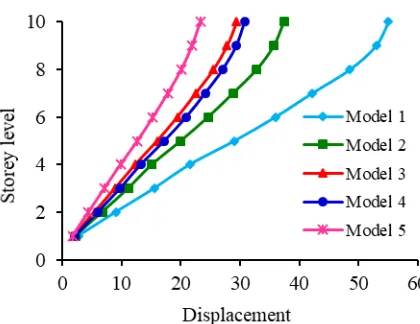
The comparison of floor horizontal deflection in x and y directions of each model is shown in Table 4. Based on the analysis results.it can be seen that model 5 with X EBF bracing is the most effective bracing system to reduce horizontal deflection. Model 5 with the horizontal link is capable of reducing deflection to 48.22% on x-direction and 57.71% on y-direction. Graphs of lateral displacements in x and y-direction can be seen in Fig. 6(a) and Fig. 6(b).
TABLE IV
THE COMPARISON OF LATERAL DISPLACEMENT
Model
∆maks (mm) Percentage of lateral displacement
reduction to model 1 x-
direction y-
direction x-direction y--direction
1 39.403 55.107 0 0
2 28.672 37.362 27.23% 32.20%
3 25.056 29.446 36.41% 46.57%
4 22.910 30.823 41.86% 44.07%
5 20.360 23.286 48.22% 57.71%
Fig. 6(b) Lateral displacement in y-direction (mm) C. Drift Ratio
Floor horizontal displacements of each model are shown in Table 5 and 6. Drift ratio of each model are shown in Table 7 and Table 8 and also in Fig. 7(a) and (b).
TABLE V
FLOOR DISPLACEMENT (X DIRECTION)
Storey
δx (mm)
Model 1 Model 2 Model 3 Model 4 Model 5
10 39.403 28.672 25.056 22.910 20.360
9 37.949 27.364 23.748 21.784 19.179
8 35.108 25.134 21.814 20.078 17.571
7 30.980 22.081 19.334 17.844 15.581
6 26.519 18.752 16.596 15.389 13.368
5 21.604 15.250 13.618 12.670 10.977
4 16.278 11.636 10.455 9.739 8.469
3 11.203 8.251 7.357 6.913 5.993
2 6.024 4.705 4.181 3.986 3.488
1 1.680 1.444 1.324 1.278 1.185
TABLE VI
FLOOR DISPLACEMENT (Y DIRECTION)
Store y
δx (mm)
Model 1 Model 2 Model 3 Model 4 Model 5
10 55.107 37.362 29.446 30.823 23.286
9 53.022 35.712 27.805 29.385 21.910
8 48.568 32.779 25.466 27.110 20.068
7 42.185 28.780 22.546 24.112 17.823
6 36.023 24.579 19.394 20.871 15.340
5 29.114 20.005 15.967 17.231 12.656
4 21.532 15.107 12.319 13.238 9.838
3 15.499 11.078 8.947 9.698 7.132
2 8.973 6.692 5.415 5.919 4.373
1 2.724 2.243 1.938 2.103 1.677
Drift ratio is reduced significantly if bracing is used on the steel building. At the fifth floor of model 2, drift ratio is
reduced 50.69% for x-direction and 55.33% for y-direction. At the fifth floor of model 3, drift ratio is reduced 57.53% for x-direction and 64.76% for y-direction. At the fifth floor of model 4, drift ratio is reduced 58.90% for x-direction and 61.91% for y-direction. At the fifth floor of model 5, drift ratio is reduced 65.75% for x-direction and 72.38% for y-direction.
TABLE VII DRIFT RATIO (X-DIRECTION)
Storey DRIFT RATIO
Model 1 Model 2 Model 3 Model 4 Model 5
10 0.0020 0.0013 0.0013 0.0011 0.0012
9 0.0039 0.0022 0.0019 0.0017 0.0016
8 0.0057 0.0031 0.0025 0.0023 0.0020
7 0.0061 0.0033 0.0027 0.0025 0.0022
6 0.0068 0.0035 0.0030 0.0027 0.0024
5 0.0073 0.0036 0.0032 0.0029 0.0025
4 0.0070 0.0034 0.0031 0.0028 0.0025
3 0.0071 0.0035 0.0032 0.0029 0.0025
2 0.0060 0.0033 0.0029 0.0027 0.0023
1 0.0023 0.0014 0.0013 0.0013 0.0012
TABLE VIII DRIFT RATIO (Y-DIRECTION)
Storey DRIFT RATIO
Model 1 Model 2 Model 3 Model 4 Model 5
10 0.0029 0.0016 0.0016 0.0014 0.0014
9 0.0061 0.0029 0.0023 0.0023 0.0018
8 0.0088 0.0040 0.0029 0.0030 0.0022
7 0.0085 0.0042 0.0032 0.0032 0.0025
6 0.0095 0.0046 0.0034 0.0036 0.0027
5 0.0104 0.0049 0.0036 0.0040 0.0028
4 0.0083 0.0040 0.0034 0.0035 0.0027
3 0.0090 0.0044 0.0035 0.0038 0.0028
2 0.0029 0.0016 0.0016 0.0014 0.0014
1 0.0061 0.0029 0.0023 0.0023 0.0018
(b) y-direction Fig. 7 Drift ratio
D. Performance Point and Performance Level
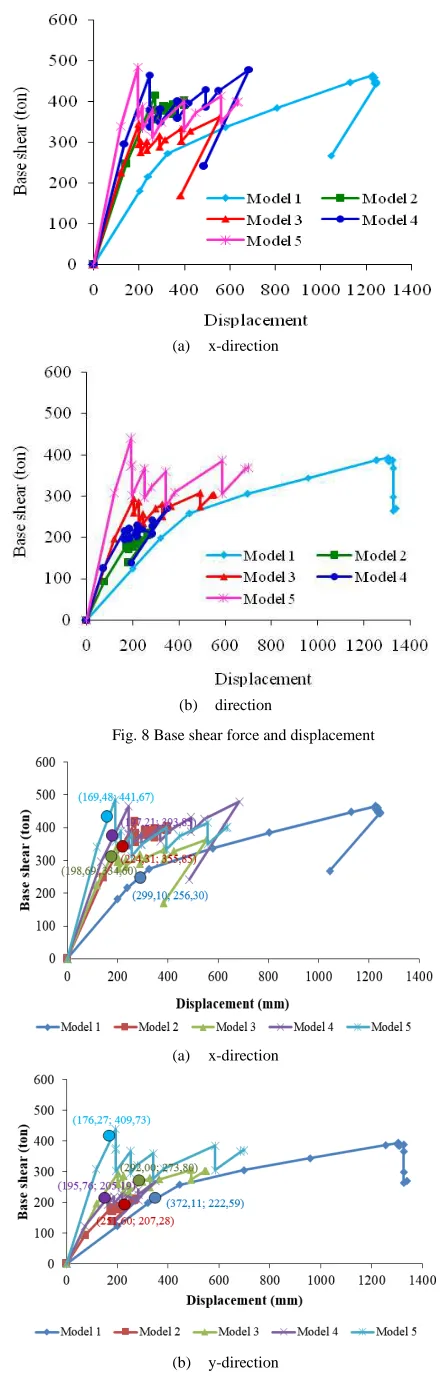
Base shear forces and its corresponding displacements for each model are shown in Table 9, Fig. 8(a), and 8(b). Performance point is a correlation between base shear and displacement. Curve capacity and performance points of the five model can be seen in Fig. 9(a) and 9(b).
The best performance point is shown by model 5 for x or y-direction. In model 5 x direction shear force limit increased 72.33% and displacement decreased 43.34%, while for y-direction shear force limit increased 84.07%, and displacement decreased 52.63%. In model 4 for x-direction, shear force limit increased 53.67%, and displacement decreased 34.07%, while for y-direction shear force limit increased 7.82% and displacement decreased 47.39%. In model 3 for x-direction, shear force limit increased 30.55%, and displacement decreased 33.57%, while for y-direction, shear force limit increased 23.01% and displacement decreased 21.53%. In model 2 for x-direction, shear force limit increased 38.84%, and displacement decreased 25.00%, while for y-direction shear force limit increased 6.88% and displacement decreased 32.39%.The performance level of each model is described in Table 10.
TABLE IX
BASE SHEAR FORCE AND DISPLACEMENT
Model
Base Shear
(ton)
Displacement (mm)
Base Shear
(ton)
Displacement (mm) x-direction y-direction
1 256.30 299.10 222.59 372.11
2 355.85 224.31 207.28 251.60
3 334.60 198.69 273.80 292.00
4 393.85 197.21 205.19 195.76
5 441.67 169.48 409.73 176.27
(a) x-direction
(b) direction
Fig. 8 Base shear force and displacement
(a) x-direction
(b) y-direction
TABLE X PERFORMANCE LEVEL
Model
Maximum total drift
Maximum inelastic
drift
Maximum total drift
Maximum inelastic
drift
Perfor mance level x-direction y-direction
1 0.0075 0.0025 0.0093 0.0043 IO 2 0.0056 0.0020 0.0063 0.0044 IO 3 0.0050 0.0020 0.0073 0.0043 IO 4 0.0049 0.0016 0.0049 0.0031 IO 5 0.0042 0.0013 0.0044 0.0015 IO
E. Plastic Hinge Propagation
The
beam
section deformation where the plastic bending occurs is described as a plastic hinge. Propagation path of the plastic hinges of the 5 models in x-direction was shown in Fig. 10.Propagation path of the plastic hinges of the 5 models were y-direction in shown in Fig. 11.Fig. 10 Plastic hinge propagation in x-direction in step 15 Plastic hinge propagation mechanism of model 1 is shown in Fig. 10(a) dan 11(a).In x-direction, plastic hinge occurred in 15th steps with base shear 268.31 ton, displacement 1.044 mm. There are two red beams which indicate collapse condition. In y-direction, plastic hinge also occurred in steps 15 with base shear 269.24 ton, displacement 1.338 mm.There are six beams collapsed.
The plastic hinge mechanism of model 2 is shown in Fig. 8(b) and 9(b). In x-direction, the plastic hinge occurs in 15th step with base shear 393.13 ton, displacement 399.43 mm. There are two red beams which indicate collapse condition.
In y-direction, plastic hinge also occurred in steps 15 with base shear 137.65 ton, displacement 182.07 mm. There are six beams collapsed. In step 15, some bracing collapsed, while other beams were in the first yielding.
The plastic hinge mechanism of model 3 is shown in Fig. 8(c) and 9(c). In x-direction, the plastic hinge occurs in 15th step with base shear 169.70 ton, displacement 382.18 mm, some bracing has collapsed, and beams come into IO level. In y-direction, the plastic hinge also occurs in steps 15 with base shear 303.54 ton, displacement 549.11 mm, some bracing has collapsed, and beams come into IO level.
Fig. 11 Plastic hinge propagation in y-direction in step 15 The plastic hinge mechanism of model 4 is shown in Fig. 8(d) and 9(d). In x-direction, the plastic hinge occurs in 15th step with base shear 241.48 ton, displacement 484.74 mm, some bracing has collapsed, and beams come into IO level. In y-direction, the plastic hinge also occurs in steps 15 with base shear 139.39 ton, displacement 192.08 mm, some bracing has collapsed, and beams come into IO level.
The plastic hinge mechanism of model 5 is shown in Fig. 8(e) and 9(e). In x-direction, the plastic hinge occurs in 15th step with base shear 401.31 ton, displacement 636.22 mm, some bracing has collapsed, and beams come into IO level. In y-direction. plastic hinge is also occurred in steps 15 with base shear 370.17 ton, displacement 698.34 mm, some bracing has collapsed, and beams come into IO level.
IV. CONCLUSION
reduced to 57.71%; The use of bracing model 5 reduced structural response by 72.38%; Performance point of model 5showed increase in shear force to 84.07% and a decrease in displacement to 52.63%. In this study, the performance level of the five building models is in immediate occupancy (IO).
The sequence of plastic hinge propagation is in accordance with the concept of the strong column weak beam. Plastic hinge formation didn’t occur in the columns.
REFERENCES
[1] ATC-40.Seismic Evaluation and Retrofit ofConcrete Buildings. Applied Technical Council, California Seismic Safety Commission. Redwood City, California, 1996.
[2] Marquez, Edelis del V, William Lobo-Q. and J. C. Vielma,
Comparative Analysis of the Energy Dissipation of Steel Buildings with Concentric and Eccentric Braces, The Open Civil Engineering
Journal, Vol 9: Page No. 295-307, 2015.
[3] N. V. Gunderao, G.S. Hiremath,Seismic Behavior of Reinforced
Concrete Frame with Eccentric Steel Bracings, SSRG International
Journal of Civil Engineering, Vol 2: Page No. 41-46, 2015.
[4] A. Shahnawaz and J. Raheem,Comparison of Moment Resisting.
Concentrically Braced & Eccentrically Braced Steel Frames,
International Journal for Scientific Research & Development, Vol 3: Page No. 1220-1222, 2015.
[5] Jouybari, Y. Mozaffari, and A. A. Nikghalb,Assessment of The
Seismic Behavior of Eccentrically Braced Frame with Vertical and Horizontal Link, International Journal of Civil Engineering and
Building Materials, Vol 2: Page No. 39-46, 2012.
[6] M. I. Khan and K.N. Khan, Seismic Analysis of Steel Frame with
Bracings using Pushover Analysis”, International Journal of
Advanced Technology in Engineering and Science, Volume No. 02. Issue No. 07,Page No. 369-381, 2014.
[7] Hanafiah, Saloma, Yakni Idris, and Julius Yahya, The Behaviour
Study of Shear Wall on Concrete Structure by Pushover Analysis,
International Journal on Advanced Science Engineering Information Technology, vol 7, pp. 1127-1133, 2017
[8] M.G. Kalibhat,K. Kamath,S.K. Prasad, and R.R. Pai, “Seismic
Performance of Concentric Braced steel frames from Pushover Analysis”. IOSR Journal of Mechanical and Civil Engineering, Page
No. 67-73, 2014.
[9] R.C. Barros and R. Almeida,Pushover Analysis of Asymmetric
Three-Dimensional Building Frames, Journal of Civil Engineering and
Management, vol. XI, No. 1, pp. 3-12, 2005.
[10] M.R. Maheri and R. Akbari,Seismic Behaviour Factor R for Steel
X-braced and Knee-X-braced RC Buildings, Journal of Engineering
Structures 25, pp.1505-1513, 2003.
[11] Saloma, Yakni Idris, Hanafiah, and Nico Octavianus, Structural
Behaviour of Steel Building with Diagonal and ChevronBraced CBF (Concentrically Braced Frames) by Pushover Analysis, International
Journal on Advanced Science Engineering Information Technology, vol 7, pp. 716-722, 2017.
[12] FEMA 356,Prestandard and Commentary for the Seismic Rehabilitation of Buildings, Federal Emergency Management Agency, Washington DC, 2000.
[13] FEMA 440,Improvement of Nonlinear Static Seismic Analysis
Procedures, Applied Technology Council, Redwood City, California,