PHYSICAL ACTIVITY AS A PART OF OVERWEIGHT AND OBESITY TREATMENT
Radana Poděbradská, Pavel Stejskal
*
, Daniel Schwarz
**
, Jiří Poděbradský
Dolní Lipová Spa, Lipová-lázně, Czech Republic
* Faculty of Physical Culture, Palacký University, Olomouc, Czech Republic ** Masaryk University, Brno, Czech Republic
Submitted in June, 2011
BACKGROUND: Apart from pharmacotherapy, also a combination of physical activity (PA), diet, and cognitive--behavioral therapy is recommended for obesity treatment.
OBJECTIVE:This research study verifi ed the eff ectiveness of the recommended complex intervention in treating overweight and obesity via an evaluation of changes in anthropometric indicators.
METHODS:The intervention included a guided physical activity, a diet and cognitive-behavioural therapy. PA was realized via endurance exercise with guided exercise intensity (machine exercise, Nordic walking and group aerobic exercise) and via resistance training. Included in the study were 328 patients (233 women and 95 men) aged 19–79 years, undergoing a treatment stay focused on weight reduction in the Dolní Lipová Spa. The length of the stay varied between 6 to 49 days, which is 21 days on average. Anthropometric indexes from bio-impedance measuring were monitored, as well as the volume of PA via sport-testers in minutes and via pedometers in steps.
RESULTS:The multifrequency bio-impedance analysis proved a signifi cant loss of overall weight of 6.18 kg in men and 4.28 kg in women, body fat reduction of 4.50 kg in men and 3.52 kg in women and a reduction of the visceral fat of 13.42 cm2 in men and 10.41 cm2 in women. A relationship was demonstrated between the volume of guided PA and a reduction of the fat weight and the visceral fat amount. For women, the relationship between fat reduction and the volume of PA within the training heart rate (HRt) is stronger, while for men, the reduction of fat depends more on the overall volume of PA while exercising with a focus on reaching the HRt. Another relationship was demonstrated between the volume of habitual PA, a reduction of their fatʼs weight and their visceral fat amount.
CONCLUSIONS:Complex intervention positively infl uenced the patientsʼ health by reducing their overall weight and the weight of their fat. Guided PA within their HRt has proven to be connected with changes in anthropometric indicators.
Keywords: Body composition, movement intervention, diet, bio-impedance, pedometers, Nordic walking, resistance training.
INTRODUCTION
Obesity causes a balanced energy state either to increase the energy intake, or to reduce the energy ex-penditure, or, in some cases, a combination of these changes. Due to the relatively stable amount of pro-teins and carbohydrates in the human body, excessive energy is stored mostly in the form of fat. Storage of fat only starts when the auto-compensation mechanisms for body weight conservation fail (Jéquier & Tappy, 1999; Stejskal, 2000). Of the non-invasive approaches, the recommended treatment of overweight and obesity includes pharmacotherapy, as well as a combination of nutritional therapy, physical therapy, and cognitive-behavioural therapy (CBT) (McTigue, Hess, & Ziouras, 2006). The selection of treatment depends on the degree of obesity, the incidence of co-morbidity, the success of previous therapy attempts, and the characteristics of the individualʼs personal life (Racette, Deusinger, & Deusinger, 2003). Overweight and obesity treatment
is based on a negative energy balance with a reduced energy intake and increased energy expenditure. Physi-cal activity (PA) increases energy expenditure during and after exercise, and it also increases the basal-state energy expenditure (as a result of the change in body composition) (Stejskal, 2000).
Adipose tissue serves not only as passive energy stor-age; it is also hormonally active tissue, whose products aff ect the regulatory mechanisms of metabolic process-es and operative reactions of the entire organism. The white adipose tissue cells produce increased amounts of pro and anti-infl ammatory active substances (Wisse, 2004), which may be signifi cantly infl uenced by regular PA. For example, it is a well known fact that physically active people show lower pro-infl ammatory markers than people who are less physically active (Hamer, 2007).
adher-ence to the reduction programme (Racette, Deusinger, & Deusinger, 2003). PA aff ects intramuscular triglyc-eride storage (IMTG) and the use thereof as an energy substrate. The IMTG contents are inversely connected with insulin sensitivity (Stannard & Johnson, 2003), and PA therefore increases the muscle fi bresʼ sensitivity to in-sulin. Regular daily exercise thus serves to prevent obes-ity complications and reduces the risks of reoccurring weight gain (Racette, Deusinger, & Deusinger, 2003).
According to Hainer (2004), maximum fat oxidation takes place in loads with an intensity of around 50% of VO2max. In Loonʼs study (2004), it is evident that the most optimal PA intensity for the maximum utilization of IMTG and TG from plasma varies between 55–70% of VO2max. As the intensity of physical activity grows, so does the share of glucose as an energy source, and in loads exceeding 65–75% of VO2max, the share of fat energy doesnʼt reach 50% (Máček, Radvanský, et al., 2011). The percentage of VO2max approximately corre-sponds to the % of maximal heart rate reserve (MHRR) (Carvalho, Guimaraes, & Bocchi, 2008), and therefore a recommendation in percentages of MHRR is often used to formulate the PA intensity, calculated as a share of HRmax and resting HR (HRrest), which is more com-prehensible for the patients. When recommending PA intensity, it is convenient to take into account the fact that insulin resistance is one obesity risk factor that may be infl uenced by exercise.
To infl uence the insulin receptorsʼ sensitivity, some authors put more stress on the volume of PA (Houmard, Tanner, Slentz, Duscha, McCartney, & Kraus, 2004), while others prefer PA intensity (DiPietro, Dziura, Yeckel, & Neufer, 2006).
The study aimed at verifying the effectiveness of the recommended complex intervention in treating overweight and obesity via evaluations of changes in anthropometric indicators.
METHODOLOGY
The research group
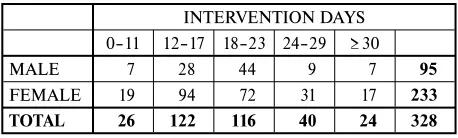
The measuring was carried out in patients who un-derwent a treatment stay focused on weight reduction in the Dolní Lipová Spa (LL). The research group was made up of 328 patients, of which 233 were women and 95 were men aged between 19 to 79 years. TABLE 1 shows distribution of the sample by sex and by length of the intervention. All the patients entered the research study voluntarily and underwent the intervention pro-gramme.
TABLE 1
Distribution of the sample by sex and by the length of the intervention
INTERVENTION DAYS 0–11 12–17 18–23 24–29 ≥ 30
MALE 7 28 44 9 7 95
FEMALE 19 94 72 31 17 233
TOTAL 26 122 116 40 24 328
Body composition measurement methods
Anthropometric indicators measured on the InBody 720 multifrequency bio-impedance scale with eight contact points manufactured by the Korean company BIOSPACE included – overall body weight (kg), body fat (kg, %), visceral fat (cm2), muscle mass (kg, %), body mass index (BMI) (kg.cm–2), intracellular water amount (ICW) (l), and extracellular water amount (ECW) (l). A bio-impedance measurement was taken before the intervention, then at 7 day intervals during the inter-vention, and after the intervention. In cases where the treatment stay only lasted for 6 days, the measurement was taken on the fi rst and the last day.
Caliperation measured three skinfolds: suprailia-cal, subscapular, and over m.triceps humeri. Measure-ment was taken using the Best calliper manufactured by TRYSTOM, Olomouc.
Intervention
Treatment took the form of a complex intervention including a physical programme, a diet, and CBT. The physical programme included endurance and resistance exercise. Habitual PA (HPA) was also monitored.
Endurance PA within the optimum training heart rate zone (HRt) took the form of machine exercising (bicycle ergometer, elliptical, cross-bike, rowing or step-per – the choice of the machine was left to the patient), Nordic walking and aerobic group exercise.
The optimum HRt zone calculation resulted from the following parameters:
• maximum heart rate estimate (HRmax) – 220 – age, • resting heart rate (HRrest) – was measured in the
morning after waking up,
• maximal heart rate reserve (MHRR) – HRmax – HRrest.
In practice, the commonly indicated beta-blocker eff ect on heart beat reduction by 25 beats/min. proved to be too small to prescribe load intensity for these patients. Therefore, we estimated the HRmax value utilizing the HRmax reduced by 35 beats (185 – age). The load in-tensity corresponding to 60% of MHRR calculated from the indicators estimated as described above proved to be adequate for most patients, and allowed them to exercise for a minimum period of 30 minutes. The patients had a chance to check the load intensity, thereby maintain-ing the determined optimum HRt zone, via sport-testers manufactured by POLAR, type F4. The overall exercise volume and HRt-zone exercise volume was recorded in writing into the patientʼs personal booklet immediately after each exercise, which focused on reaching and maintaining the HRt. The record after each exercise also included an evaluation of subjective load perception ac-cording to the Borg scale.
Resistance exercise was carried out in the form of group exercises of callanetics, 5 times per week, lasting for 30 minutes, focusing on strengthening the femo-ral, gluteal, and abdominal muscles. Throughout the patientʼs stay in LL, the volume of PA was monitored by pedometers of the SILVA Step Counter brand.
The volume of everyday PA measured by pedometers was recorded by the patients in their personal booklets.
A reduction diet was the base of nutritional interven-tion, corresponding to an energy intake of 4800 kJ (1150 kcal) per day, within a frequency of 5 meals per day – breakfast, a snack, lunch, another snack, and dinner.
A clinical psychologist provided for individual psy-chotherapy, and also analysed the psychological cause for the eating disorder, suggesting the treatment thereof. The treatment included motivational elements. Among the PA motivational elements, there was, for example, the way of recording and assessing the PA results. For that reason, LL created a system which includes a spe-cifi cally created Spa Booklet for a patient in the weight reduction programme.
Data collection and analysis
Data was collected continuously in the period be-tween January 2008 and March 2011. In terms of age, the patients were divided into two groups. The first group, 19 to 55 years, was classifi ed as being in middle to late adulthood; the second group, 56 to 88 years, was classifi ed by the age of the oldest patient in the research group. The said age limits were set in refer-ence to the number of patients in the individual groups (namely the men, whose group is less numerous than that of the women) for relevant statistical processing. The research group included patients who were able to take part in PA within the optimum HRt zone. This stay was 21 days long, on average. The collected data was statistically processed by means of the available
statisti-cal packs, namely the MS Excel 2010 and Matlab 7, utilizing the Statistical Toolbox library. The description of the data fi le was done via a summarization of the observed parameters, using descriptive statistics, i. e. the mean, standard deviation and a 90% limit of the reliabil-ity interval. Normal division of the analyzed parametersʼ values was verifi ed on the basis of frequency histogram depiction. Six subjects were excluded before the analy-sis, as their body weight or fat mass reduction deviated from the mean by more than four degrees of standard deviation. Five parameters were analysed in detail: body weight, fat weight, visceral fat area, muscle proportion and BMI – body mass index. First, the paired diff eren-tial variables were calculated based on the values of the analysed parameters before and after the intervention. Data normality was then assessed – frequency histo-grams for all diff erential variables showed symmetric bell shapes. Parametric methods for hypothesis testing were used, particularly one tailed Student’s t-tests. Test-ing the diff erential variables allows paired analysis as well the use of parametric tests in the cases, such as BMI, when the values before and after the intervention are not normal – but the distribution of the diff erences shows normality. The statistical signifi cance is expressed in common p values as well as in d values, where d is Cohen’s coeffi cient for eff ect size defi ned as a diff erence between two means divided by a standard deviation for the data (Thomas, Lochbaum, Landers, & He, 1997):
á Ë Êă Ć g srrohg where
ô
õ
ô
õ
ÜË Ê Ê Ë Ê Ë Ë Ë Ë Ê Ê ă Ă Ļ ă Ă Ļ ă Ć q q q q srrohg (1.2)
The most frequent assessment of effect size d is 0.2 – small eff ect, 0.5 – moderate and 0 .8 – large eff ect (Thomas, Lochbaum, Landers, & He, 1997; Thomas, Salazar, & Landers, 1991).
Relations between individual parameters were eval-uated by means of Pearson’s correlation coeffi cient, together with the correlation signifi cance. Important co-variants, such as the length of stay and age, were taken into account and their infl uences, expressed in terms of linear models, were subtracted from the values of the analysed parameters.
RESULTS
I. The infl uence of complex intervention on anthropo-metric indicators
The hypotheses testing results show that, in men and women in both the observed age categories, there was a signifi cant reduction of overall weight (TABLE 2), of the weight of fat (TABLE 3), of the visceral fat area (TABLE 4), and of the BMI value (TABLE 6). The
aver-age reduction value in all the indicators is higher in men than in women in the absolute value.
Although the average muscular tissue weight in kilo-grams decreased in men (–1.04 ± 1.03 kg) and in women (–0.51 ± 1.06 kg), its relative amount, on the contrary, increased (TABLE 5). This shows that fat reduction was greater than muscular reduction, and as a consequence, there is more muscular mass in the body with respect to the overall weight.
TABLE 2
The interventionʼs infl uence on overall body weight
WEIGHT [kg]
INPUT DIFFERENCE
N
AVG SD x5 x95 AVG SD x5 x95 p d
MEN ag
e 19–55ALL 110.59 22.10 78.59 149.52 –6.18 2.64 –11.16 –2.10 < 0.001 0.28 95
115.64 23.02 88.82 168.76 –6.63 2.83 –11.39 –2.38 < 0.001 0.29 53
> 55 108.57 17.77 79.12 138.08 –5.19 2.04 –8.94 –1.80 < 0.001 0.30 42
W
OMEN ag
e ALL 94.36 21.00 65.58 132.64 –4.28 2.29 –9.12 –1.30 < 0.001 0.21 233
19–55 94.27 18.59 69.34 126.70 –4.00 2.22 –8.20 –0.74 < 0.001 0.22 139
> 55 98.56 23.29 68.84 150.36 –4.15 2.21 –9.78 –1.60 < 0.001 0.18 94
Legend: AVG – average; N – number of subjects; SD – standard deviation; x5, x95 – the fi fth and the ninety-fi fth percentile; p – signifi cance level; d – eff ect size
TABLE 3
The interventionʼs infl uence on the weight of fat
FAT [kg]
INPUT DIFFERENCE
N
AVG SD x5 x95 AVG SD x5 x95 p d
MEN ag
e 19–55ALL 39.76 14.74 20.13 66.39 –4.50 2.66 –8.93 –0.34 < 0.001 0.31 95
41.62 16.89 20.49 87.05 –4.83 2.65 –8.81 –0.52 < 0.001 0.29 53
> 55 38.75 11.38 24.74 64.54 –3.40 2.00 –7.00 –0.12 < 0.001 0.29 42
W
OMEN ag
e ALL 41.60 14.91 21.43 68.34 –3.52 1.94 –7.16 –0.80 < 0.001 0.24 233
19–55 40.73 13.58 20.82 63.35 –3.39 1.86 –6.77 –0.84 < 0.001 0.25 139
> 55 45.32 16.52 24.16 79.90 –3.17 1.55 –6.20 –0.80 < 0.001 0.20 94
Legend: AVG – average; N – number of subjects; SD – standard deviation; x5, x95 – the fi fth and the ninety-fi fth percentile; p – signifi cance level; d – eff ect size
TABLE 4
The interventionʼs infl uence on the visceral fat area
VFA [cm2]
INPUT DIFFERENCE
N
AVG SD x5 x95 AVG SD x5 x95 p d
MEN ag
e 19–55ALL 193.96 47.66 132.83 286.78 –13.42 10.38 –28.43 5.07 < 0.001 0.28 95
191.26 55.34 129.89 324.40 –15.88 10.91 –30.92 4.68 < 0.001 0.29 53
> 55 197.37 36.09 152.24 273.92 –10.31 8.86 –23.84 5.72 < 0.001 0.28 42
W
OMEN ag
e ALL 177.95 52.03 105.55 277.15 –10.41 7.26 –22.03 0.85 < 0.001 0.20 233
19–55 163.69 45.53 97.06 246.35 –11.34 7.46 –25.51 0.30 < 0.001 0.25 139
> 55 200.25 52.86 132.24 304.76 –8.95 6.73 –18.54 3.78 < 0.001 0.17 94
TABLE 7
Correlation between the change of fat weight or the change of visceral fat area and the duration of PA without subtract-ing the length of stay infl uence (the strongest dependence is marked in bold in each group accordsubtract-ing to gender and age)
r1 Change of the fat weight Change of the visceral fat extent
PA v HRt oPA HPA PA v HRt oPA HPA
All men –0.34 –0.43 –0.13 –0.36 –0.44 –0.17
Men 19–55 years –0.31 –0.36 0.08 –0.40 –0.44 0.04
Men older than 55 years –0.31 –0.45 –0.65 –0.21 –0.31 –0.70
All women –0.40 –0.29 –0.44 –0.43 –0.36 –0.42
Women 19–55 years –0.46 –0.34 –0.54 –0.46 –0.36 –0.42
Women older than 55 years –0.24 –0.24 –0.28 –0.36 –0.42 –0.48
All –0.39 –0.37 –0.33 –0.41 –0.41 –0.33
Legend: PA – physical activity; HRt – training heart rate; HPA – habitual physical activity; oPA – overall PA volume in exercise focused on reaching and maintaining the HRt; r1 – Pearsonʼs correlation coeffi cients for the dependencies without subtracting the infl uence of the length of stay
II. Connection between physical activity and fat reduction
To evaluate the connection between exercise volume parameters and the amount of fat, a co-variance analy-sis (ANCOVA) and a variance analyanaly-sis (ANOVA) were used (TABLE 7, 8). The dependence of fat reduction on the overall period of carrying out PA (oPA), as well as the dependence of fat reduction on PA within the
HRt zone, represent a medium to weak correlation. In women, correlation of fat reduction and PA within the HRt zone is stronger, while in men, fat reduction is more dependent on oPA. Change in fat weight depends more strongly on PA within the HRt zone, while the change in the visceral fat amount depends more strongly on the overall period of carrying out PA.
TABLE 5
The interventionʼs infl uence on muscle proportion
MUSCLE [%]
INPUT DIFFERENCE
N
AVG SD x5 x95 AVG SD x5 x95 p d
MEN ag
e ALL 36.61 4.45 27.81 44.07 1.25 1.18 –0.59 3.45 < 0.001 0.27 95
19–55 37.04 4.65 27.63 44.49 1.27 1.14 –0.54 2.94 < 0.001 0.26 53
> 55 36.39 3.84 29.51 41.38 0.86 0.93 –0.60 2.26 < 0.001 0.21 42
W
OMEN ag
e ALL 31.59 3.76 25.92 38.10 1.00 1.10 –0.17 2.84 < 0.001 0.26 233
19–55 32.16 3.70 26.46 38.48 0.95 1.07 –0.13 2.49 < 0.001 0.25 139
> 55 30.44 3.51 25.19 35.85 0.75 0.73 –0.26 1.81 < 0.001 0.21 94
Legend: AVG – average; N – number of subjects; SD – standard deviation; x5, x95 – the fi fth and the ninety-fi fth percentile; p – signifi cance level; d – eff ect size
TABLE 6
The interventionʼs infl uence on body mass index (BMI)
BMI [–]
INPUT DIFFERENCE
N
AVG SD x5 x95 M SD x5 x95 p d
MEN ag
e ALL 35.28 6.03 27.28 44.93 –1.95 0.87 –3.43 –0.60 < 0.001 0.33 95
19–55 36.30 6.54 27.82 50.72 –2.05 0.98 –3.66 –0.70 < 0.001 0.32 53
> 55 34.94 4.95 28.44 44.94 –1.66 0.61 –2.70 –0.60 < 0.001 0.34 42
W
OMEN ag
e ALL 34.42 6.99 25.18 46.30 –1.56 0.84 –3.30 –0.40 < 0.001 0.23 233
19–55 33.99 6.29 25.49 45.30 –1.43 0.78 –2.90 –0.20 < 0.001 0.23 139
> 55 36.30 7.91 26.26 54.48 –.52 0.80 –3.44 –0.60 < 0.001 0.20 94
DISCUSSION
One of the essential problems in evaluating the eff ect of intervention focused on weight reduction lies in the selection of the measurement method. Considering the demands on the work place and the patient, probably the most advantageous method is the most frequently used bio-impedance analysis (BIA). Its great disadvan-tage is represented by great demands on the same hy-dration level during the repetitive measurement. And even in a healthy, weight stable man, the overall body fl uids oscillate approximately ± 5% daily, due to meta-bolic processes, food intake, drinking, etc. (Chumlea, Guo, Keller, Reo, & Siervogel, 1999). In the reduction programme patients, the changes of the body fl uids are even more signifi cant.
Heymsfi eld et al. (2010) describes in his summa-rizing article the early stage of weight reduction with regard to the change in the body composition. First of all, there is a loss of proteins, glycogen, water, minerals, and electrolytes. This combined loss is demonstrated by decreased hydration of the organism, namely in the intracellular areas, which can aff ect the measurement results. The resulting change of body weight depends on: a) the state of energy balance prior to its shift towards negative values; b) gender (a relatively higher volume of fat-free mass in men); c) nutritional composition of diet; d) PA intensity and duration; e) selective hormonal and other medicamentous treatment. The studies did not assess the infl uence of age, which can also aff ect the reduction. Duration of the fi rst stage of weight reduc-tion is rather variable, depending on the factors above; it usually lasts 4–6 weeks.
In our study, there was a signifi cant decrease of ECW in men (–0.48 ± 0.64 l) and in women (–0.25 ± 0.49 l), as well as a significant decrease of ICW in men (–0.80 ± 0.78 l) and in women (–0.36 ± 0.66 l), which
could infl uence the measurement results. While evalu-ating the individual results, however, the changes in values of ICW and ECW may be taken into account, and only the results with approximately the same value of these indicators may be compared. Practical experi-ence shows that the distortion of the anthropometric indicatorsʼ value is most demonstrated on the visceral fat amount, when the calculation of visceral fat amount upon an ECW decrease is higher than in reality. There-fore the BIA measurement was completed by calipera-tion of three skinfolds during the study, to assess the reduction regardless of the changes to fl uid amount in the organism. However, caliperation cannot estimate the amount of visceral fat. This method was only used as a complementary method, the need of which occurred due to defi ciencies in BIA measurements in cases of changed ECW amount. TABLE 9 shows the correlation results of 110 patients who took the multifrequency BIA measurement (MFBIA) together with the caliperation of three skinfolds.
Even caliperation thus cannot represent an absolute method, as the 5% probability of the mentioned meas-urement error increases to 9–10% with extremely high or low values, which include measurements of obese patients (Riegerová, Přidalová, & Ulbrichová, 2006). Similarly, the accuracy of the MFBIA measurement de-creases as the amount of fat grows (Salmi, 2003; Shafer, Johson, & Lukaski, 2007; Völgyi et al., 2008).
Opinions of authors on the MFBIA methodʼs accu-racy vary signifi cantly from a refusal to use this method to measure obese patients all the way to presenting very high correlation coeffi cients with reference methods (Thomson, Brinkworth, Buckley, Noakes, & Clifton, 2007). Should we reach the conclusion that the MFBIA method is not suitable to assess weight reduction chang-es in a short term, such as one week, it can still be very well used to assess the trends in reducing the individual
TABLE 8
Correlation between the change of fat weight or the change of visceral fat extent and the duration of PA after subtracting the length of stay infl uence (the strongest dependence is marked in bold in each group according to gender and age)
r2 Change in fat weight Change in visceral fat extent
PA v HRt oPA HPA PA v HRt oPA HPA
All men –0.18 –0.25 0.02 –0.19 –0.25 0.00
Men 19–55 years –0.15 –0.20 0.18 –0.20 –0.23 0.19
Men older than 55 years –0.29 –0.41 –0.46 –0.17 –0.25 –0.52
All women –0.16 –0.08 –0.05 –0.27 –0.24 –0.15
wWomen 19–55 years –0.17 –0.07 –0.04 –0.25 –0.19 –0.04
Women older than 55 years –0.12 –0.12 0.06 –0.29 –0.35 –0.29
All –0.19 –0.18 –0.02 –0.25 –0.27 –0.09
components of the body composition. The number of MFBIA measurement machines grows in the Czech Re-public, which gives the patients a chance to observe re-duction over a longer period of time on a machine of the same type that was used for their measurement in LL.
In our research study, there were signifi cant changes in the overall body weight as well as the body composi-tion due to complex intervencomposi-tion according to MFBIA. Apart from the desirable reduction of body fat expressed by the fat amount in kilograms, percentage, and the visceral fat amount in cm2, there was also an undesir-able reduction of muscle mass. The question is whether it was really a muscle mass reduction, or a distorted MFBIA assessment caused by changes in the organismʼs hydration.
Muscle mass reduction during reduction interven-tion can be minimized in two ways – food with a suf-fi cient amount of high quality proteins and a balanced content of essential amino-acids, and resistance exercise. Resistance exercise in our study did not include resist-ance training (Tresierras & Balady, 2009); it took the form of group resistance exercise without equipment, utilizing oneʼs own body weight. It is possible that the volume of resistance exercise, which took place 5 times per week, was not suffi cient to prevent the muscle mass loss. Further, the amount of protein in food was not measured according to the muscle mass volume. Such a modifi cation of the eating regime is not possible in LL at present, due to operative-organizational reasons on one hand, and the bad tolerance of patients towards diff erent amounts of food (they eat together in one din-ing room) on the other hand. Although the MFBIA results show absolute muscle mass reduction, there is an increase of values when assessing the relative muscle mass amount (%). Therefore, if there was a muscle mass loss during the reduction, the fat loss was greater. As we cannot even estimate the approximate energy expendi-ture from the continuous measurements, it is not pos-sible to relate the measurement results to the individual reduction, although such an assessment would surely be the most accurate, and it will be useful to modify the PA prescription in this direction in the future.
Weight loss via combined intervention (diet + ex-ercise) brings about decreased incidence of mechanic
and metabolic obesity complications (Straznicky et al., 2009). However, Ross, and Janiszewski (2008) proved in their study that while overall body weight reduction is connected with a signifi cant decrease in cardiovascular risk related to obesity (thatʼs why it remains the de-sired result of relevant treatment strategies), increasing PA, even in cases of minimum or zero weight changes, can increase body fi tness and thus positively infl uence health. King et al. (2009) found that PA without weight reduction leads to reduced risks of obesity complica-tions, as well as to a better mental state, which supports adherence to the reduction programme.
The program for guided PA in the study included the prescription of PA type, intensity, length and fre-quency. Regarding the type of PA, a combination of endurance aerobic exercise and resistance exercise was recommended (Tresierras & Balady, 2009). During the course of the research study, 3 types of endurance PA were practised within the framework of the reduction programme – exercise on endurance building type ma-chines, Nordic Walking, and group aerobic exercise. The limitation in using exercise machines in obesity treat-ment lies in their maximum load, which usually amounts to 150 kg. As the maximum load of the machine grows, so does the price of the machine and the chances for its purchase in order to continue treatment at home decrease. Nordic walking is usually very popular due to its variety and possible changes of terrain, and also due to the fact that the equipment will be further used at home in subsequent reduction treatment. Using the sticks while walking increases the energy expenditure as opposed to taking a standard walk, and load intensity is perceived as less demanding. Moreover, obese patients feel more stable with the sticks (Figard-Fabre, Fabre, Leonardi, & Schena, 2010). From the physiotherapeu-tic point of view, strengthening posture when using the sticks also supports the positioning in the centre of the joint. Aerobic group exercise is only suitable for a small group of patients who fi nd this type of exercise satis-factory, and have no contraindications. Group aerobic exercise was modifi ed for obese patients, and jumping, climbing and fast changes of position were left out of the exercise units.
TABLE 9
Correlation of changes in anthropometric indexes according to multifrequency BIA with caliperation of three skinfolds
W (kg) F (kg) VF (cm2) BMI (–) % F WHR (–)
Suprailiac skinfold **0.26 *0.24 0.13 **0.28 0.08 ***0.39
Subscapular skinfold ***0.36 ***0.35 *0.22 **0.30 0.07 ***0.40
Skinfold over m. triceps humeri 0.11 **0.27 0.13 0.10 0.14 *0.28
The intensity of endurance PA within the HRt zone was set to 60% of MHRR. Although some authors rec-ommend higher intensity, in practice, it is often nec-essary to consider the initial lack of condition of the patient when starting the reduction programme. After the starting stage of the PA programme, it is suitable to gradually increase the intensity for these people. Large diff erences in obese patients’ conditions are also proved by a large span in the subjective load assessment results, according to the Borg scale. When prescribing the PA intensity for optimum reduction, it is therefore not pos-sible to recommend a single value, but rather a span, the lower margin of which should not fall below 60% of MHRR, and the upper margin should not exceed 85% of MHRR. A possible guide for prescribing the PA in-tensity could be in the subjective load assessment on the Borg scale, where the value of 13–16 points corresponds to the PA intensity of 60–85% of MHRR, according to Skinner (1993).
Setting the maximum heart rate (HRmax) presents one of the limitations of this study. It is most suitable to set this value on the basis of a load-dependent ergomet-ric test up until the “vita maxima”. As this test is often unavailable, HRmax is usually set based upon estimation according to the formula 220 age. This formula was pub-lished by Fox and Haskell in 1970 (in Tanaka, Monahan, Douglas, & Seals, 2001), and was determined out of ap-proximately 10 studies altogether. The highest individual age included in the studies was 65 years, with a majority of individuals around the age of 55. That is why sev-eral other research studies have been conducted since then, recommending other formulas for calculating the HRmax, such as Tanaka et al. (2001) recommend the formula 208 – 0.7 × age. Unless the HRmax is set under conditions of adhering to the “vita maxima” testing, it is called the peak heart rate (HRpeak).
In some patients in the study, a CHR test was carried out (Stejskal, Sup, Doležal, & Hejnová, 1993), which also allows for an estimate of the VO2max approximate value and its utilization in order to prescribe the load intensity. Due to personnel and organizational reasons, it is currently impossible to carry out this procedure as a standard with each patient, but we do plan to imple-ment this change in the future.
Practical experience shows that patients taking beta-blockers reach the HRt zone more easily with PA within a certain time interval after taking the medicine. As it was not always possible to ensure exercise within the same time interval after taking the medicine, this fact might have infl uenced the results of the study.
Recommended exercise length and frequency are closely related. The optimum recommendation of 30 minutes of exercise daily (Erlichman, Kerbey, & James, 2002; Racette, Deusinger, & Deusinger, 2003) must be reached gradually. The question is, whether to start immediately in the PA intensity recommended
for reduction and gradually prolong the exercise, or to gradually increase the intensity of exercise while keep-ing the length of the exercise unit constant. It is possi-ble that the decisive factor in this matter should be the patientʼs subjective perception of the given process. Due to a certain “compliance” of the exercise, it seems best to prescribe everyday exercise to the patient.
One of the aspects of the growing overweight and obesity prevalence also lies in the decrease of HPA volume during the inclusion of active training in the daily programme. To reach an optimum eff ect of physi-cal intervention, guided PA within the determined HRt zone set to a certain volume of HPA is very important. According to the study results, there is a correlation between the HPA volume and fat loss. Expressing the number of steps taken everyday might not include all daily PA, but it is a good orientation guide and a tivational element. The pedometers have a strong mo-tivational eff ect in the eff ort to reach an ever greater personal maximum in the overall daily number of steps, as well as within the framework of competition with other patients. A pedometer can also be used in increas-ing the load intensity, thus complementincreas-ing PA within the optimum HRt zone. For example, increasing the number of steps per a given time period, or increasing the number of steps per an unchanging time period. A pedometer, as opposed to the exercise machine, is available at work or on the way to work, etc. In some pa-tients, a pedometer is an important tool for their initial realization of the fact that they do not have enough HPA and do not even reach the recommended minimum of 5000 steps (Sigmund, Frömel, & Neuls, 2005). Monitor-ing of HPA non-recordable by the pedometer (such as swimming or cycling, etc.) must be recorded in a diff er-ent way. For example, it is possible to use re-calculation into health points (Stejskal, 2004).
This study was limited by the fact that it was not possible to compare the patients undergoing the inter-vention with a control group without interinter-vention, due to ethical reasons. Further limitation was caused by the fact that the length of stay (thus including the length of intervention) was not the same in all the patients.
CONCLUSION
indica-tors measured via MFBIA. A connection was proven between PA within the HRt zone and HPA with changes in some of the anthropometric indicators.
Regarding physical intervention in obesity treat-ment, the most eff ective combination seems to consist of diff erent types of PA which allow for remaining in the HRt zone, resistance exercise and HPA at a suffi -cient volume. It is important for overweight and obes-ity treatment to include motivational elements, which will support the adherence to the reduction programme, namely the initiation and support of internal motivation development. It has been documented that individuals who exercise on the basis of their internal motivation are more likely to remain in the exercise programme longer (Bryan & Solmon, 2007). Treatment stays aimed at weight reduction are suitable at the beginning of the entire reduction process, as the start of a lifestyle change. Removal of distracting factors at home and inclusion among other obese individuals help the pa-tients overcome the period of feeling hunger and mus-cle fatigue within the new regime. Repetitive treatment stays have also proved positive, as a means of support for the adherence to the programme and a solution for individual problems, which occurred while introducing the changed lifestyle at home. The research study was conducted in LL, where the well established concept of reduction programmes continues and eff orts are being made towards further improvements.
REFERENCES
Bryan, L. C., & Solmon, M. A. (2007). Self determi-nation in physical education: Designing class en-vironments to promote active lifestyles. Journal of Teaching in Physical Education, 26(3), 260–278. DiPietro, L., Dziura, J., Yeckel, C. W., & Neufer, P.
(2006). Exercise and improved insulin sensitivity in older women: Evidence of the enduring benefi ts of higher intensity training. Journal of Applied Physiol-ogy, 100(1), 142–149.
Erlichman, J., Kerbery, A. L., & James, W. P. T. (2002). Physical activity and its impact on health outcomes. Paper 2: Prevention of unhealthy weight gain and obesity by physical activity: An analysis of the evi-dence. Obesity reviews, 3(4), 273–287.
Figard-Fabre, H., Fabre, N., Leonardi, A., & Schena, F. (2010). Physiological and perceptual responses to Nordic walking in obese middle aged women in com-parison with the normal walk. European Journal of Applied Physiology, 108(6), 1141–1151.
Chumlea, W. C., Guo, S. S., Keller, C. M., Reo, N. V., & Siervogel, R. M. (1999). Total body water data for white adults 18 to 64 years of age: The fels longitudi-nal study. Kidney International, 56, 244–252.
Hamer, M. (2007). The relative infl uences of fi tness and fatness on infl ammatory factors. Preventive Medicine, 44(1), 3–11.
Heymsfi eld, S. B., Thomas, D., Nguyen, A. M., Peng, J. Z., Martin, C., Shen, W., Strauss, B., Bosy-West-phal, A., & Muller, M. J. (2011). Voluntary weight loss: Systematic review of early phase body composi-tion changes. Obesity Reviews, 12(5), 348–361. Houmard, J. A., Tanner, C. J., Slenzt, C. A., Duscha,
B. D., McCartney, J. S., & Kraus, W. (2004). Ef-fect of the volume and intensity of exercise training on insulin sensitivity. Journal of Applied Physiology, 96(1),101–106.
Jéquier, E., & Tappy, L. (1999). Regulation of body weight in humans. Physiological Reviews, 79(2), 451–480.
King, N. A., Hopkins, M., Caudwell, P., Stubbs, R. J., & Blundell, J. E. (2009). Benefi cial eff ects of exer-cise: Shifting the focus from body weight to other markers of health. British Journal of Sports Medicine, 43, 924–927.
Lee, J. T. et al. (1990). The role of genetically deter-mined polymorphic drug metabolism in the beta-blockade produced by propafenone. The New England Journal of Medicine, 322(25), 1764–1768. McTigue, K. M., Hess, R., & Ziouras, J. (2006).
Obe-sity in older adults: A systematic review of the evi-dence for diagnosis and treatment. Obesity,14(9), 1485–1497.
Racette, S. B., Deusinger, S. S., & Deusinger, R. H. (2003). Obesity: Overview of prevalence, etiology, and treatment. Physical Therapy, 83(3), 276–288. Riegerová, J., Přidalová, M., & Ulbrichová, M. (2006).
Aplikace fyzické antropologie v tělesné výchově a sportu (příručka funkční antropologie). Olomouc: Hanex. Ross, R., & Janiszewski, P. M. (2008). Is weight loss
the optimal target for obesity related cardiovascular disease risk reduction? Canadian Journal of Cardiol-ogy, 24(Suppl. D), 25–31.
Salmi, J. A. (2003). Body composition assessment with segmental multifrequency bioimpedance method. Journal of Sports Science & Medicine, 2(Suppl. 3), 1–29.
Shafer, K. J., Siders, W. A., Johnson, L. K., & Lukaski, H. C. (2009). Validity of segmental multiple-frequen-cy bioelectrical impedance analysis to estimate body composition of adults across a range of body mass indexes. Nutrition, 25(1), 25–32.
Stannard, S. R., & Johnson, N. A. (2003). Insulin re-sistance and elevated triglyceride in muscle: More important for survival than “thrifty” genes? Journal of Physiology, 554(3), 595–607.
Stejskal, P., Sup, R., Doležal, I., & Hejnová, J. (1993). Use of reversed regulation of work rate intensity by heart rate in testing physical fi tness (CHR test). Re-search in Sports Medicine: An International Journal, 4(1), 33–46.
Stejskal, P. (2000). Obesity, energy balance and its regu-lation. Acta Universitatis Palackianae Olomucensis. Gymnica, 30(2), 7–17.
Stejskal, P. (2004). Proč a jak se zdravě hýbat. Břeclav: Presstempus.
Straznicky, N. E., Lambert, G. W., McGrane, M. T., Masuo, K., Dawood, T., Nestel, P. J., Eikelis, N., Schlaich, M. P., Esler, M. D., Socratous, F., Cho-pra, R., & Lambert, E. A. (2009). Weight loss may reverse blunted sympathetic neural responsiveness to glucose ingestion in obese subjects with metabolic syndrome. Diabetes, 58(5), 1126–1132.
Tanaka, H., Monahan, K. D., & Seals, D. R. (2001) Age predicted maximal heart rate revisited. Journal of the American College of Cardiology, 37(1), 153–156. Thomas, J. R., Lochbaum, M. R., Landers, D. M.,
& He, C. (1997). Planning signifi cant and meaning-ful research in exercise science: Estimating sample size. Research Quarterly for Exercise and Sport,68(1), 33–43.
Thomas, J. R., Salazar, W., & Landers, D. M. (1991). What is missing in p < .05? Eff ect size. Research Quarterly for Exercise and Sport, 62(3), 344–348. Thomson, R., Brinkworth, G. D., Buckley, J. D.,
No-akes, M., & Clifton, P. M. (2007). Good agreement between bioelectrical impedance and dual energy X-ray absorptiometry for estimating changes in body composition during weight loss in overweight young women. Clinical Nutrition, 26(6), 771–777.
Tresierras, M. A., & Balady, G. J. (2009). Resistance training in the treatment of diabetes and obesity. Journal of Cardiopulmonary Rehabilitation and Pre-vention, 29(2), 67–75.
Völgyi, E., Tylavsky, F. A., Lyytikäinen, A., Suominen, H., Alén, M., & Cheng, S. (2008). Assessing body composition with DXA and bioimpedance: Eff ects of obesity, physical activity, and age. Obesity, 16(3), 700–705.
Wisse, B. E. (2004). The infl ammatory syndrome: The role of adipose tissue cytokines in metabolic disor-ders linked to obesity. Journal of American Society of Nephrology, 15(11), 2792–2800.
POHYBOVÁ AKTIVITA
JAKO SOUČÁST LÉČENÍ NADVÁHY A OBEZITY
(Souhrn anglického textu)
VÝCHODISKA: Pro léčbu obezity je vedle farmako-terapie doporučovaná také kombinace pohybové aktivity (PA), diety a kognitivně-behaviorální terapie.
CÍLE: Výzkumná studie ověřovala efektivitu doporu-čované komplexní intervence v léčbě nadváhy a obezity prostřednictvím vyhodnocení změn antropometrických ukazatelů.
METODIKA: Intervence zahrnovala řízenou pohy-bovou aktivitu, dietu a kognitivně-behaviorální terapii. PA byla realizována formou vytrvalostního cvičení s říze-nou intenzitou zatížení (cvičení na přístrojích, severská chůze a skupinové aerobní cvičení) a posilovacím cvi-čením. Do studie bylo zařazeno 328 pacientů (233 žen a 95 mužů) ve věku 19–79 let, kteří absolvovali léčebný pobyt zaměřený na redukci hmotnosti v Lázních Dolní Lipová. Pobyt trval od 6 do 49 dní, v průměru 21 dní. Sledovány byly antropometrické ukazatele z bioimpe-dančního měření a objem PA sporttestery v minutách a krokoměry v krocích.
VÝSLEDKY: Multifrekvenční bioimpedanční ana-lýzou byl prokázán signifi kantní úbytek celkové hmot-nosti 6,18 kg u mužů a 4,28 kg u žen, úbytek tělesného tuku 4,50 kg u mužů a 3,52 kg u žen a úbytek útrobního tuku 13,42 cm2 u mužů a 10,41 cm2 u žen. Byla pro-kázána souvislost řízené PA a poklesu hmotnosti tuku a množství útrobního tuku. U žen jsou silnější korelace redukce tuku s objemem PA v pásmu tréninkové srdeční frekvence (TSF), zatímco redukce tuku mužů je silněji závislá na celkovém objemu PA při cvičení zaměřeném na dosažení pásma TSF. Dále byla prokázána souvislost mezi objemem habituálních PA a poklesem hmotnosti tuku a množství útrobního tuku.
Mgr. Radana Poděbradská, Ph.D.
Education and previous work experience
1999–2002 – University of Ostrava, Faculty of Health and Social Studies – Physical rehabilitation and physi-otherapy (Bc.).
2005–2007 – Palacký University, Olomouc, Faculty of Physical Culture – Physiotherapy (Mgr.).
2007–2011 – Palacký University, Olomouc, Faculty of Physical Culture – Kinanthropology (Ph.D.).
Scientifi c orientation
Obesity, exercise physiology, physiotherapy of children, homeopathy.
First-line publication
Poděbradská, R., Stejskal, P., & Schwarz, D. (2010). Spektrální analýza variability srdeční frekvence jako pomocný faktor v hodnocení úspěšnosti léčby nadvá-hy a obezity. Medicina Sportiva Bohemica et Slovaca, 19(4), 27.
Poděbradská, R., Stejskal, P., & Schwarz, D. (2011). Pohybová intervence jako součást léčení nadváhy a obezity. Rehabilitace a fyzikální lékařství, 18(2), 58. Lázně Dolní Lipová
Lipová-lázně 248