Vol.7 (2017) No. 4-2
ISSN: 2088-5334
The Application of RFID System in Water Level Monitoring
Hairulnizam Mahdin
#, Hazalila Kamaludin
#, RD Rohmat Saedudin
*, Abdul Halim Omar
+,
Shahreen Kasim
#, Junaidah Jailani
^ #Faculty of Computer Science and Information Technology, Universiti Tun Hussein Onn Malaysia, Parit Raja, 86400 Batu Pahat, Johor, Malaysia
E-mail:hairuln@uthm.edu.my
*
Department of Information System, Telkom University, Bandung, Indonesia
+
Centre for Diploma Studies, Universiti Tun Hussein Onn Malaysia, Parit Raja, 86400 Batu Pahat, Johor, Malaysia
^
Faculty of Civil and Environmental Engineering, Universiti Tun Hussein Onn Malaysia, Parit Raja, 86400 Batu Pahat, Johor, Malaysia
Abstract—In a tropical country like Malaysia water tank is very common in every buildings and houses. Water from the tank will be
used when there is a problem with the direct water supply. It is so important where at some government buildings the water level in the tank is being inspected daily to ensure the water level is above the required threshold. However, this task consumes time and energy as the tank is located at the top of the building that cannot be easily accessible. Therefore, there is need to implement an automatic system that can monitor the level of the water in the tank. If the level is decreasing below the required threshold, the intended personnel will be informed immediately via a smartphone for example. The decrease could indicate a failure in the mechanical system to pump the water into the tank. Results from the experiments show that Radio Frequency Identification (RFID) technology has the potential to be used in monitoring the tank water level although there is drawback such implementation cost due to hardware requirements.
Keywords— RFID; water level detection; sensors
I. INTRODUCTION
In most building, there is water tank that stores some amount of water that could sustain the need of the building occupants for one or two days in case there is a problem with direct water supply. The water tank must be fully functional to supply water when needed to fulfil basic human needs and maintain cleanness of the building. To ensure the water level is above the threshold required, the water tank level is inspected manually daily. This consumes times and a lot of human energy as the location of the water tank cannot be easily accessible. There is even proposal to use a robot to perform this task because of its tedious-nature [1]. Therefore, it is paramount to have a system that can detect the water tank level remotely from the intended control room.
In the market, there is a number of water level monitoring systems that can be used such as magnet-based monitoring system [2], sonic tank [3] and ultrasonic tank [4]. However, we are interested in exploring the potential of RFID technology to be used to solve this problem. This is because
the potential of RFID technology cost to become inexpensive in the future. At the same time, it can provide reliable monitoring as expected. RFID consists of reader and tag is widely used in object identification and monitoring [5]. It has been used in supply chain [6], agriculture [7] and many others diversified applications. One of its features that might make it is possible to monitor the water level is the frequency of readings that can change because of the distance and substance surrounding its tags. One of the experiments conducted in [8] shows that the number of readings on the particular tag can drop by adjusting the distance between the reader and tag as shown in Fig. 1. The number of readings also can drop significantly when it is surrounded by water and metal substance. Based on this premises we try to explore the potential of RFID technology to be used in the water tank level monitoring system. The nature of RFID that can provide automatic identification and network ready also increase the interest towards its usage. This paper presents the preliminary results of our experiments. The final objective is to make RFID as the
viable solutions to this problem. The paper is organized as follows: Section II will discuss on Material and Methods, Section III is on Result and Discussion, and Section IV is the conclusion.
Tag 1
Tag 2
Tag 4
Tag 3
Outside Reader 1 vicinity Read rate drops by 70%
Inside Reader vicinity read rate 100%
Fig. 1 Read rate difference between inside and outside one’s reader vicinity
A. Related Works
There are approaches that can be used to detect the water level in the tank such as floating ball [9], sliding mode controller [10], ring-type impedance sensor [11] and liquid level sensor [12]. Most of this approaches were costly to implement and not feasible for home use except for floating ball. However, floating ball was used only to detect if the water has been full in the tank. It will automatically stop the water flow to the tanks when the water has reached the required level. There is no other approach has been widely used to detect if the water tank level is decreasing. We can only know that the system is not working after there is no supply at all from the pipe. The water level in the tank can decrease even there is no breakdown in the water supply when there is a failure in the pump system. There is one work that proposed the use of RFID to solve this problem [13], but it focused on modifying the power needed to detect the RFID tag in the water. We just use a simple method by identifying the level via the unique ID of the tag.
B. System Architecture
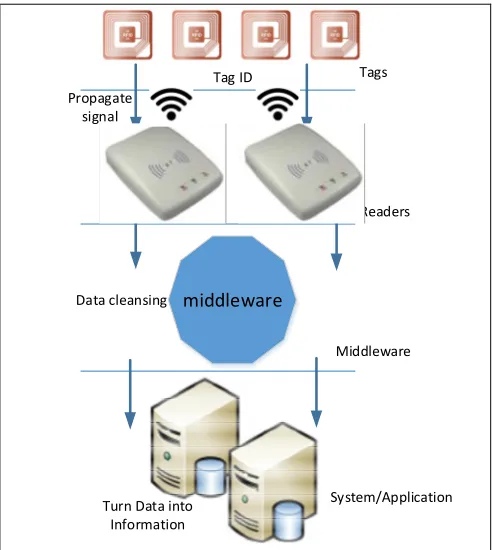
The RFID system consists of tags, reader, middleware, and backend system. The tags contain unique ID to represent the object it is being tagged to. There three types of tag: passive, semi-passive and active tags. A passive tag is used because it has no expiry date as long it has not been damaged. It is also cheaper compared to active and semi-passive tags. The next level consists of the reader. The reader will interrogate its signal which will power up the tags in its vicinity. The tag requires certain power level to enable them to reply the signal from the reader. The response contains the tag ID that will be received by the reader. The RFID reader can be either fixed or mobile. The fixed reader can be used to check the water level if it involves many tanks. However, it needs to be really feasible because the limitation of the range covers by the reader to detect the tags. We propose the use of mobile reader by the personnel whom will carried it out together when they go to check the tank. The idea is they don’t need to crawl above the tank to check for the water level. Instead, they just stand
beside the tank and get the reading to validate that the water level is sufficient as described.
After the reading is captured, it will be sent to the middleware for processing purposes. Here the system will clean the data and turn it into meaningful information as required by the user. The data reliability is really important here as it will hugely affect the information being disseminated to the user. This four levels of RFID system architecture is shown in Fig. 2.
middleware
Tags
Readers
Middleware
System/Application Tag ID
Data cleansing Propagate
signal
Turn Data into Information
Fig. 2 RFID system architecture
C. Data Characteristics
To process the RFID data we need to understand the characteristics of the data. The data is different with other data stream in terms of its volume and simplicity. The RFID data is simple where it only consist mainly of three attributes, read time, tag ID and reader ID. However, it is large in volume due to the nature of the RFID that does readings for every second on each tag on its vicinity. If the read cycle is every minute and there are only ten tags to be read, in one hour there will be already 600 tuples of the readings. There is need a mechanism to manage the RFID data to prevent it from overflowing the system.
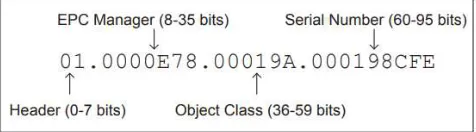
D. RFID Data Structure
The structure of the data itself is shown in Fig. 3. It is built of four main parts which are the header, EPC Manager, Object Class and Serial Number. The unique Tag ID is represented by the serial number that can range from 60-95 bits. The tag ID will represent the water tank where it is tagged to.
E. Noise Readings
In typical RFID system, there will be noise readings that emerge from the weak signal, interference, unknown sources
and from the reader- nature itself. The noise read can consist of repetitive readings, false positive readings and missed readings [5].
Fig. 3 RFID data structures
For repetitive readings, the reader tends to read the same tags repetitively if the tag is in their vicinity. For some system, this is unnecessary because it will cause over-processing on the data that already being received. Many approaches have been proposed and used to eliminate this reading such as in [5] and [6]. One of the approaches is based on Bloom filters [5] where readings are stored into very efficient memory data structure arrays simply by hashing them. However, for our system, repetitive reading is an advantage to improve the confidence towards the readings. The bigger the number of readings can simply prove that the tag really existed.
The second noise reading is the false positive reading. False positive readings exist when the reader reports a reading on a tag that actually does not exist in the system. Such reading can exist because of interference in the signal that changes the ID of a tag. One approach to identifying false positive reading is by its number of readings in a given time. Usually, the number such readings are so much lower than correct readings. In water level monitoring application, this reading is not a threat since the object being tagged is limited and can be pre-stored in the database.
The third noise reading is the false negative reading. False negative reading occurred when a tag that is existed in the vicinity failed to be read by the reader. This can be caused by the signal collision and also interference. In usual RFID application, such as in supply chain, the existence of false negative needs to be detected quickly because it can indicate object is missing from the area. The system needs to verify whether it is really a missed reading or the object has left the vicinity prematurely. In the case of water level monitoring application, false negative can be checked on easily as it does not involve many objects.
TABLEI
EXAMPLE OF NOISE READINGS IN RFID
Time (secs) Tag ID Type
100 AE100
100 AE100 Repeated readings
200 AE200
200 AE200 Repeated readings
300 AE30200 False positive readings 400 none False negative readings 400 AE100 Repeated readings
Table 1 shows examples of noise readings that can occur one in RFID systems. In this table, there are only two correct tag IDs, i.e., AE100 and AE200. Both tags will be read
repetitively by the reader as long as they still stay in the reader’s vicinity which caused the repetitive reading at time 100, 200 and 400. During time 300 there is one unknown reading recorded which will be considered by the system as false positive reading. Then at time 400, there is no reading at all on both tags which indicate missed or false negative readings had occurred.
II. MATERIAL AND METHODS
The attraction to discover the potential of RFID in this problem is due to its ability to automatically identify and its network-ready nature. Based on the tag ID the system can specify which tank it represents and can send the data over the network. The recent development of Near Field Communication (NFC) – enabled [14] device also increase the interests towards the technology. In upcoming years, the capability of the NFC enabled device will increase at making it able to build the system with less cost where our own smartphone can be the reader to the tag.
In the experiments, we use the passive tag to be the indicator of the water level. Numbers of tags are being used to mark the different level of water in the water tank. Our hypothesis is the number of reading on the tag will be a lot less compared when the tag is on the top of the water surface. If the reading is suddenly significantly high on a particular tag, it shows that the water level has decreased below the level where the tag is attached.
TABLEII
MOBILE READER E200SPECIFICATION Dimensions 165(L) 55(W) 30(H) mm
Environment Weight 210g (with battery)
Operating Temp -20°C to 55°C (-4°F to 131°F) Storage Temp -40°C to 80°C (-40°F to 176°F) Antenna Connection MMCX
Power Battery Operated
Frequency Ranges 902 or 928 MHz band RF power control 20-30dBm
Tag Air Interfaces EPC Class 1 Gen 2
Communication Interface Bluetooth
Read Range > 2M tag dependent
The RFID reader model used in the experiments is Mobile Reader E200 while the tag is the passive UHF Dogbone model. The model is a model that has been used in many passive RIFD systems. We use a plastic container to simulate the water tank. The tag is placed in a vacuum container to avoid contact with the water. It is attached to the wall of the plastic container at a different level. The E200 mobile reader will read all the tag inside the container. The water will be reduced to study the difference of the reading on the tag. The experiment setup is shown in Fig. 4.
The mobile reader is connected to the smartphone via Bluetooth connection. The distance between the reader and the tag also vary to study the signal strengths. All the readings that captured in the smartphone are sent to the computer for later reference.
In the actual implementation, both fixed and the mobile reader can be used depending on the feasibility of the system.
If there are many tanks located at the same places, then we can deploy one fixed reader to read all the tag at the tank. By this, the responsible personnel does not even have to climb up to roof to do the reading as required when using the mobile reader.
Water Container Mobile Reader E200
Smartphone
RF Signal
RFID Tag
Via Bluetooth
Via wifi
Computer
Fig. 4 Plastic container contains water and tag is read by the E200 reader
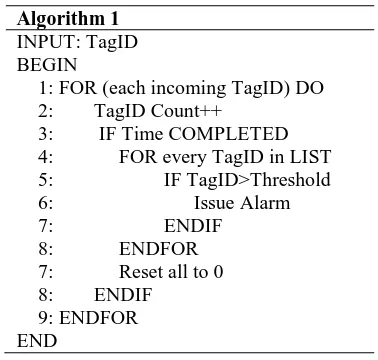
The algorithm to determine whether the water in the tank is at sufficient level is shown in Algorithm 1. In this algorithm, we will count every reading made by the reader. Time is defined beforehand, for example, one hour or one day. In Step 3, when the time is up, the number of the reading on every tag in the reader list will be examined (Step 4 to Step 8). If the number of readings is more than the threshold, an alarm or notification will be issued to the user. It indicates that tag now is above the water level surface and thus making more readings compared to when it is below the water surface. After the loop finishes, all count will be reset to zero, and the process starts again.
ALGORITHM I
RFID Duplicate Readings Filtering Algorithm
Algorithm 1
INPUT: TagID BEGIN
1: FOR (each incoming TagID) DO 2: TagID Count++
3: IF Time COMPLETED 4: FOR every TagID in LIST 5: IF TagID>Threshold 6: Issue Alarm 7: ENDIF
8: ENDFOR 7: Reset all to 0 8: ENDIF
9: ENDFOR END
The value of the time depends on the application and user. If the application needs to check the water level for every hour, then the time need to be set an hour. For the threshold, a test needs to be carried out to investigate the number of readings that a tag can make within a given time both during below and above the water level.
TABLEIII
EXAMPLE OF READING RECORDS BASED ON ALGORITHM 1
Time Tag ID Number of readings
60sec AE100 5
60 secs AE200 6
60 secs AE300 4
120 secs AE100 10
120 secs AE200 11
120 secs AE300 10
III.RESULTS AND DISCUSSION
In the first experiment, the tag is located at a different level each. Tag 1 is located 10cm above the container floor followed by Tag 2 (20cm), Tag 3 (30 cm) and Tag 4 (40 cm). Then readings are taken for 1 minute. The water level is set at 35 cm. Then the water level is decreased at 25 cm, and the reading of all tags is taken again for 1 minute. The water level is being decreased again at 15 cm and then repeat the process. The result is shown in Fig. 5.
Fig. 5 Number of reading on tags on different level of water
There is a significant difference in a number of readings when the tag is located above and below the water level. When the tag is below the water level, the reading of the tag is below 200 readings per minute. If the tag is above the water level, the reading on the tag in 1 minute will be over 400 readings. It can be said that almost 70% of the reading is lost when the tag is in the water. Based on this result, we can use 400 numbers of readings as a threshold to indicate whether water level has decreased below a particular tag. Fig. 2 also shows that tag that located more than 9 cm from the water level cannot be detected by the reader. This is because we only use a mobile reader that has limited capability in reading range compared to the fixed reader.
In the second experiment, we want to study the consistency of reader reading the tag over time. This is to check the performance of the reader and tag in this environment setup. Only one tag is used, and the reading is recorded for five minutes. The results are presented in Fig.6 and Fig. 7. Fig.6 shows the overall reading in 5 minutes while in Fig.7 we provide the average of reading over a minute.
Over the time, both levels have constant reading where the above water surface tag can be read around 420 to 503
readings per minute while the below water surface tag state an average 132 to 182 readings per minute over. This shows that the power provided by the reader to power the tag is constant over the time. By this, we can use a fixed threshold value to detect the water level using the RFID.
Fig. 6 The number of tag readings in 5 minutes
Based on both experiments, the read range for the reader can change depends on the environment setup. The distance of the reading changes significantly when the tag is above the water and below the water. The reading range of the tag is also shorter when the tag is under the water.
Fig. 7 The average on number of tag readings over 5 minutes
To build a complete water tank monitoring level system, it must be able to specify the number of different water level to alert the user. The level can be divided into full, half-full, low and very low. When the water level is low, the user can take necessary action before the water decrease into the more worsening level. Fig. 5 shows the location of the tag to mark the threshold level.
A. Potential Source of Errors
The RFID system can subject to errors to including an error in reader and tags. The source of error could be from unstable power supply to the reader and a high temperature to the tags that can cause both to malfunction. If the water tank is subtle to hot weather, it will raise the temperature of the water. However, we did not test the performance of RFID tags in and outside the hot water. There is the solution for this where there are tags that can resist the high temperature and still can perform as usual [15]. The system
needs to embed a fault tolerance mechanism to detect abnormal reading that caused by these errors. Some mechanism is by employing Marzullo algorithm [16] that compares reading among different sources to detect any errors that might arise. A malfunctioning reader might not generate any reading at all, or it also can generate unknown tag ID. The system needs to be equipped to handle such events to ensure smooth sailing of the system.
Reader
Tag
Warning level threshold
Read range required
Water tank
Fig. 8 Read range requirement for tags in water level monitoring
IV.CONCLUSION
Based on the number of tag readings, we can rely on RFID to monitor the water level in the water tank. The reading difference was so significant where the tag reading below the water surface lost about 70% of readings compared to the tag reading above the water surface. However, the implementation cost is still very high because of the use of the RFID reader. The RFID reader also needs to be connected to the Internet module to send the data. It may be viable to be used in an application that involves people lives such mountain water stream monitoring that can suddenly produce the dangerous flash flood. In future works, we will use fixed RFID to increase the read range and also to try other technology such as Bluetooth-based beacon to simplify the implementation.
ACKNOWLEDGMENT
This work is sponsored by Universiti Tun Hussein Onn Malaysia under MDR Grant vot U095, Telkom University Indonesia, and Gates IT Sdn Bhd.
REFERENCES
[1] Schempf, H., Chemel, B., Everett, N.: Neptune: above-ground storage tank inspection robot system. Robotics & Automation Magazine, IEEE, 2(2), pp. 9-15 (1995)
[2] Beard, S. A., Carlin, J. A., Mesch, W. G., Stephens, T. R., Thompson, R. D.: U.S. Patent No. 4,487,065. Washington, DC: U.S. Patent and Trademark Office (1984)
[3] Gregory, E. M., Williams, T. B.: U.S. Patent No. 5,095,748. Washington, DC: U.S. Patent and Trademark Office (1992) [4] Caldwell, J. W., Slobodnik, M. W.: U.S. Patent No. 4,984,449.
Washington, DC: U.S. Patent and Trademark Office (1991) [5] Kamaludin, H., Mahdin, H., & Abawajy, J. H.: Filtering Redundant
Data from RFID Data Streams. Journal of Sensors (2016).
[6] Mahdin, H., Fudzee, M., Farhan, M., & Kasim, S.: Redundant Readers Elimination in Dense Radio Frequency Identification Network. Sensor Letters, 13(11), 992–997 (2015).
[7] Ruiz-Garcia, L., Lunadei, L.: The role of RFID in agriculture: Applications, limitations and challenges. Computers and Electronics in Agriculture, 79(1), pp. 42-50 (2011)
[8] Jeffery, S.R., Garofalakis, M., Franklin, M.J.: Adaptive cleaning for RFID data streams. In Proceedings of the 32nd International Conference on very Large Databases, Seoul, Korea pp. 163-174 (2006)
[9] Lee, M. S., Lee, H. F.: U.S. Patent No. 8,424,124. Washington, DC: U.S. Patent and Trademark Office (2013)
[10] Chen, H. M., Chen, Z. Y., & Su, J. P.: Design of a sliding mode controller for a water tank liquid level control system. IEEE Second International Conference on Innovative Computing, Information and Control, pp. 335-335 (2007)
[11] Lee, S. Y., Ko, M. S., Lee, B. A., Kim, S., Yun, B. J.:Water Level Measurement of the Stratified Flow using Ring-Type Impedance Sensor (2012)
[12] Austin, J. W., Morris, O. L., & Rothrock, M. E.: U.S. Patent No. 4,170,765. Washington, DC: U.S. Patent and Trademark Office (1979)
[13] Guillet, A., Vena, A., Perret, E., Tedjini, S.: Design of a chipless RFID sensor for water level detection. IEEE 15th International Symposium on Antenna Technology and Applied Electromagnetics (ANTEM), pp. 1-4 (2012)
[14] Madlmayr, G., Langer, J., Kantner, C., Scharinger, J.: NFC devices: Security and privacy. IEEE International Conference on Availability, Reliability and Security, pp. 642-647 (2008)
[15] Imbruglio, Richard. High temperature tolerant RFID tag. U.S. Patent 9,563,834 (2017).
[16] Mahdin, H., & Abawajy, J. An approach to faulty reader detection in RFID reader network. In Internet and distributed computing advancements: theoretical frameworks and practical applications, IGI Global, pp. 70-84 (2012).