Trends in cotinine level in urine samples of
smokeless tobacco chewers from
Belagavi region
Kiran S. Nikam1, 2, Kanchan C. Wingkar 1, Rajashekhar R. Kallur 2, Rajesh K. Joshi 3,Sandeep R. Pai4 1Department of Physiology, Krishna Institute of Medical Sciences, Deemed University, Karad, Maharashtra, India
2Department of Physiology, Belagavi Institute of Medical Sciences, Belagavi, Karnataka, India 3 Regional Medical Research Centre, ICMR, Nehru Nagar, Belagavi, Karnataka, India
4Amity Institute of Biotechnology, Panvel, Mumbai, Maharashtra, India
Abstract
Background: Tobacco consumption is a major reason for morbidity and mortality in India and more than 20% of worldwide tobacco related mortality occurs in India. Various analytical methods are used to check the levels of different biomarkers hereto and HPLC method has proved to be of wide acceptance for such studies.
Aim: The present study was aimed to evaluate the cotinine level in urine samples of smokeless tobacco chewers using RP-HPLC-PDA and GC-MS.
Methods: Out of 600 urine samples, 300 of smokeless tobacco chewers (STC) and 300 from non-tobacco chewers (NTC) were analyzed. The cotinine level in urine was analyzed by RP-HPLC-PDA and confirmed using GC-MS. Results: The cotinine concentration in urine samples of STC and NTC were found in the range of 100.84 to 5810 ng/mL urine sample and 10.01 to 59.02 ng/mL respectively.
Conclusion: Determination of cotinine level in STC and NTC along with its further confirmation using GC-MS method served an efficient analytical tool for such studies.
Keywords: Cotinine, Urine sample, RP-HPLC-PDA, GC-MS, Smokeless tobacco
Introduction
The use of tobacco dates back as early as 5000-3000 BC, when tobacco plants were first cultivated in South America1. Initially, tobacco was regarded as a
medicinal plant used for medical purposes such as a painkiller for earaches and toothaches2. However,
later studies clearly established the deleterious effects of tobacco smoking on health. Tobacco consumption is a major reason for morbidity and mortality in India3.
It is estimated that, approximately 5 million deaths occur due to tobacco consumption annually and it is expected to reach 10 million by 2025. Today more than 20% of worldwide tobacco related mortality occurs in India4,5.
The tobacco consumption is identified by two main methods: smoked tobacco products and smokeless tobacco products. The later being the cheapest and widely circulated habit in Indian community. Smokeless tobacco may include different forms of
Address for Correspondence Kiran Nikam
Department of Physiology, Belagavi Institute of Medical Sciences, Belagavi, Karnataka, India E-mail: krsnikam@gmail.com
non conventional Manufactured Smokeless Tobacco Product (MSTP) viz. Ghutka, Khaini, Zarda, Mawa etc.6,7
or conventional tobacco pan masala, tobacco with lime and more commonly tobacco with ‘pan’ (betel leaf) and betel quid8. MSTP due to its easy affordability, lesser
cost and misconceptions is important contributory factors for increased smokeless tobacco consumption9.
In some parts of India like Bihar and Maharashtra, use of smokeless tobacco is more common than smoking. In one report, the age-adjusted relative risk of mortality for users of smokeless tobacco like that of smokers is elevated compared to that of non-tobacco users3. The
major health consequences associated with the use of smokeless tobacco in South Asia caused cancers of several sites (e.g. the upper respiratory and digestive tracts), and poor reproductive outcomes. Some study exposed that the impact of smokeless tobacco on blood pressure and cardiac disease10.
16
tobacco plant (Nicotiana tabacum L.), hence was named after its genus. The alkaloid constitutes of 0.3 to 5 % of tobacco plant on dry weight basis. It is very toxic with a LD-50 of 40-60 mg in humans8.
About 70-80% of nicotine metabolizes rapidly and extensively to form its lactam derivative, cotinine. It is a biomarker for intake of nicotine11. Due to the long
half-life of cotinine, it has been used as a biomarker for tobacco smokers and chewers. Urinary cotinine is recommended as the quantitative parameter to access intake of nicotine12,13. Several analytical techniques
have been reported for determination of cotinine and nitrosamines. They include gas chromatography (GC)14 enzyme linked immunosorbent assay15,16 liquid
chromatography-mass spectrometry (LC-MS)17, and
high-performance liquid chromatography (HPLC) with UV detection12,18.
The present work describes a RP-HPLC-PDA method for evaluation of cotinine in urine samples of smokeless tobacco chewers. The study also attempts to confirm its presence in urine samples using GC-MS.
Materials and methods
Reagents and standards: HPLC grade methanol acetonitrile and distilled water and analytical-reagent grade dichloromethane, diethyl ether was obtained from Qualigens, Mumbai, India. Reference standard cotinine ≥98%, (S )-1-methyl-5-(3-Pyridyl)-2-pyrrolidinone was procured from Sigma-Aldrich, Mumbai, India (Lot No. #092M4002V).
Subjects and sample collection: Six hundred samples were collected from Belagavi Institute of Medical Sciences (BIMS), Belagavi, Karnataka, India. Out of these samples, three hundred were collected from smokeless tobacco chewers and three hundred from non-tobacco chewers. Ethical clearance 25/IEC/ BIMS/2013-13 and KIMS/IEC/2/2013 was obtained prior for the proposed study from the respective Institution and Informed consent was taken from the subjects included in the study. Urine samples were taken from day one of the conducting study.
Urine samples: Fasting urine samples were preferred from the subjects. The collected samples were transferred immediately to the laboratory at BIMS, Belagavi and frozen at –20 °C until analysis.
Extraction procedure of urine sample for HPLC analysis: Extraction of cotinine from urine sample was achieved using three important steps. Step 1: A 0.5 mL aliquot of individual urine sample was placed into a micro centrifuge tube with 100 μL 5.0 M NaOH, then vortex mixed for 1 min; Step 2: One milliliter
dichloromethane– diethyl ether (1:1 v/v) was added to the resulting solution mixture and vortex mixed again for 2 min. The mixture was centrifuged at 3,500 rpm for 3 min and the resulted organic layer formed was transferred to a new glass tube. Step 3: To this 20 μL of 0.25 M HCl was added and the organic phase was then evaporated under a stream of nitrogen at 45ºC until dryness. Further it was dissolved in 100 μL of mobile phase consisting of a mixture of 0.272 g of KH2PO4, 0.184 g of sodium 1-heptane sulfonate, 820 mL of water, and 180 mL of methanol19. A 20 μL of extract
from urine sample was injected into the HPLC system. Preparation of standard: Standard cotinine (10 mg) was accurately weighed and dissolved in 10 mL of methanol. Working standard solutions from a range of 10, 25, 50, 125, 250, 500, 1000, 2000, 4000, 10000 ng/ mL were prepared using the stock solution (1.0 mg/ mL).
Reverse Phase - High - Performance Liquid Chromatography - Photo Diode Array (RP-HPLC-PDA) analysis: RP-HPLC apparatus consisted of a Shimadzu system (Model no. LC-20AD) equipped with SPD-M20A Photo Diode Array (PDA) detector. The chromatographic separations were performed on a Reverse Phase (RP) C18 column (SynergiTM, 150
mm × 4.6 mm i.d., particle size 4 μm) manufactured by Phenomenex, USA. The column temperature was kept constant at 25 ± 2°C. Separations were performed in isocratic mode using a mobile phase consisting of a mixture of 30 mM citrate, 0.272 g of 30 mM KH2PO4, 1mM of heptane-1-sulphonic acid, sodium salt, and 50 mL of HPLC grade ACN. The pH of the mobile phase was maintained at 2.6. The flow rate used was 0.3 mL/ min, and the wavelength was fixed at 262 nm.
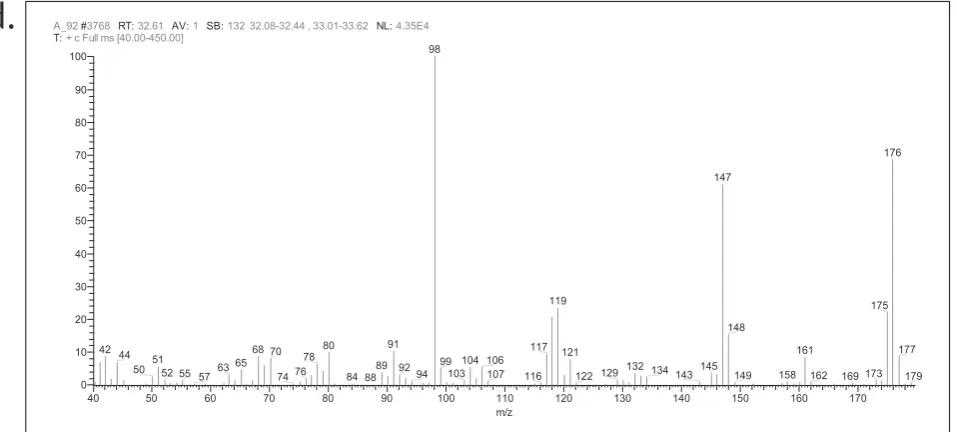
GC-MS analysis: The analysis of the cotinine in urine sample by gas chromatography-mass spectrometry was carried out on Thermo Scientific Trace Ultra gas chromatograph interfaced with Thermo Scientific ITQ 1100 mass spectrometer. A column fitted with BP-1 (30 m × 0.25 mm i.d., 0.25-µm film thickness) was used and the oven temperature was programmed between 60-220°C at 3°C/min. using helium as a carrier gas at 1.0 mL/min. The injector temperature was 250°C and injection volume was 0.1 µL of 1% solution in methanol (split ratio 1:50). The mass spectra were taken at 70 eV with a mass scan range of 40-450 amu. The mass spectrometric parameters were those reported earlier20,21.
(Thermo Fisher Scientific Austria), and co-injection of authenticated samples of cotinine purchased from Sigma-Aldrich, India (≥98%purity).
Statistics: All statistical analyses have been performed by using means of different biochemical parameters using Microsoft Excel 2007 Software for Windows. Simple linear and logarithmic correlation analysis was used to indicate a measure of the correlation and the strength of the relationship.
Results
The cotinine concentration was analyzed by using the HPLC-DA methodology, statistical calculation was done by Microsoft Excel 2007 Software for Windows. The estimated mean Retention time and mean cotinine maximum and minimum values were expressed from STC & NTC urine samples. P-value showed extremely significant relationship with STC & NTC cotinine concentrations. (Table.1)
Table 1. Retention time (RT in min) along with cotinine content (µg/mL) determined in urine samples using RP-HPLC analysis.
STC* NTC**
RT mean value ±1.559.49 ±0.2699.39
Min. Value 100.84 10.01
Max. Value 5810.7 59.02
Cotinine mean
concentration (ng/mL) 1563.34 ±1199.4 ±11.0823.48 P. value <0.001***
*STC= Smokeless tobacco chewer, **NTC=Non-Tobacco chewer,
***Comparison of STC & NTC showed extremely significant p value
Cotinine was quantitatively estimated using RP-HPLC method and the results were expressed in ng/mL urine sample. Clear and sharp peaks for standards (Figure 1a) and urine samples (Figure 1b) were obtained during the analysis. Calibration curves were constructed correlating the detector signals with the corresponding cotinine concentrations (ng/mL). A 10 point calibration curve was obtained using different concentrations of cotinine in triplicates. Linearity for the results was carried out using the least-square method, revealing good linear fit in the concentration range. The attributes and results for RP-HPLC analysis of standard cotinine such as concentration range, linearity equation, and coefficient of regression, limit of detection and limit of quantification are presented in Table 2. The high R2value was indicative for the good linearity, and the low values of standard deviations of the intercept and slope were indicative for the significant.
Table 2. RP-HPLC analysis attributes and results obtained for cotinine
Parameters
Cotinine
Concentration range (ng/mL)
10 - 10000
Linearity equations
y = 118.8761x -
7453.8158
Coefficient of Regression (R
2)
0.9952
LOD (ng/mL)
0.081 ± 0.004
LOQ (ng/mL)
0.245 ± 0.012
Validity of the calibration points were used for constructing calibration curve. Precision was
18
a.
b.
calculated by injecting 3 consecutive cotinine standard at three varying concentrations (500, 2000, and 4000 ng/mL). The relative standard deviation (RSD) of the signal values did not exceed 4.072%. Inter-day precision (reproducibility) was determined by measuring inter-day variation for triplicate determination of cotinine at the same concentrations. The lower RSD values (≤5.167%) indicated the acceptable reproducibility of the method.Tailing factor (T) for cotinine at 500 ng/mL concentration, was found to be 1.104, with good peak symmetry. The theoretical plate number (N) was found to be 1937.276 for the column used in the study (150 mm × 4.6 mm i.d., particle size 4 μm), demonstrating acceptable column efficiency.
Profiles with retention time of 9.334 ± 0.220 minutes for standards and samples were obtained. Same chromatographic system was used for estimating cotinine from samples. Auto generated chromatograms of samples were obtained as final output of the study.
In present study, cotinine values in smokeless tobacco
consumers (STC) ranged from 100.84 to 5810 ng/mL
urine sample and 10.01 to 59.02 ng/mL urine sample
in non tobacco consumers (NTC). The detection of the
cotinine in the urine samples of NTC could be due to the contribution of dietary cotinine from different food sources22 or passive smoking23. The GC-TIC analysis of
standard cotinine and its mass spectra is represented in Fig. 2a and b. Presence of cotinine in urine sample by GC-MS is showed in Fig. 2c and d. The cotinine values obtained from RP-HPLC-PDA analysis were directly related to their smokeless tobacco chewing habits.
Discussion
In India, tobacco is consumed both in smoking and non-smoking forms. Smoking forms include cigarette, bidi, hukka and chutta. Tobacco chewing is the main non-smoking form of tobacco use. A number of biochemical markers like thiocynate, nicotine, cotinine and carbon monoxide in the expired air and carboxyhaemoglobin in blood have been used to validate claims of non-smoking. Among these cotinine is possibly the best marker for situations where accuracy is paramount. Cotinine is a major metabolite of nicotine but its level in the blood is not a good marker of nicotine content of blood. In contrast, urinary excretion of cotinine is a good marker as it is less influenced by the flow of urine and pH23.
Urinary cotinine has been recommended as a quantitative measure of nicotine intake. Several analytical techniques for the determination of urinary cotinine are described in the literature. These include gas chromatography (GC), enzyme linked immunosorbent assay, liquid chromatography (LC)– mass spectrometry (MS)–MS, and high-performance liquid chromatography (HPLC) with UV detection24.
The modified methods used in the study are applicable and reliable for the determination of cotinine in urine using HPLC and GC–MS. This method has good results regarding (Limit of detection) LOD, (Limit of Quantification) LOQ, correlation coefficient, %R.E (Absolute Mean bias)., %RSD (Relative Standard Deviation). Similar methodology and results were quoted in other reported article26, 27, 28, 29, 30,31.
Figure 2 a: GC-TIC chromatogram of standard cotinine; b: Mass spectra and structure of cotinine;
c: GC-TIC chromatogram urine sample C15; d: Mass spectra and structure of urine sample C15
20
According to the results obtained by our study, the comparison table no.3 shows the sample volume considered was similar to that of other studies i.e. 0.1mL and the Limit Of Quantification (LOQ) standardized, was 0.24 ng/ mL, which correlates with Andrew N. Hoofnagle and et al study (2006). The R2 value for our study showed similar positive correlated values with other studies. The run time for the analysis of urinary cotinine in the present study was 9.49 minutes, which was similar to the previous study (7.5,14,8.31,16,6.5 minutes) The concentrations of cotinine in urine showed higher levels in tobacco Chewers around 100.84 – 5810 ng/mL and in non tobacco chewers 10.01- 59.02 ng/mL respectively. The average calculated for the STC and NTC were 1563.34 and 23.48 ng/mL, Moreover same cotinine concentrations were also in observed in other studies26, 27, 28, 29, 30,31. The variation
in range of cotinine depends on the tobacco chewer’s dietary intake of nicotine, cotinine excretion, metabolic activity, passive smoking and environmental smoke23.
Table 3. Comparison with Other Methods Using HPLC-PDA and GC-MS
Parameters Present study Moyer et al30 Hoofnagle et al27 Xu Xu28 Massadeh26 Yen-Hsia Wen29
Biological fluids Human Urine Human Urine Human Urine Human Urine Human Urine Human Urine
Sample volume (mL) 0.1 0.1 0.1 0.1 0.5 0.1
LOQ (ng/mL) cotinine/
urine 0.24 0.1 0.25 0.1 0.4 0.1
R2 0.9952 0.999 0.9971 0.9983 0.9986 0.999
Run time (min) 9.49 7.5 14 8.31 16 6.5
Cotinine range ng/mL 10.01-5810 73–6680 5.5-4,920 0.2–4000 36–3946 551-2631
These biomarkers have also been used in epidemiological studies, to assess the effects of tobacco use on human
health. While studies on nicotine and cotinine levels in cigarette smokers as well as those for passive smoking in other ethnic groups are well documented, information on tobacco used in non smoking forms (tobacco chewing) is lacking23. In the present study, we
estimated the amount of cotinine excretion in urine in a group of healthy individuals from Belagavi region who were users of tobacco in different forms and also in nonsmokers and compared the values amongst tobacco users showed Significant p value (p < 0.001) which is consistent with the reported urinary levels of cotinine levels are being found in previously reported articles23, 31. The mean values of the determined
cotinine metabolite concentration for tobacco chewer are consistent with reported concentrations in smokers’ urine (Adnan M. Massadeh et al26).
Finally, we must note that further evaluation of this method with urine samples relevant to active and passive tobacco chewing will be helpful, our results indicate that cotinine may be useful biomarker for identifying and validating the smokeless tobacco status in Indian population.
Conclusion: Determination of cotinine concentration levels from urine sample of STC and NTC by HPLC-DA and conformation of cotinine metabolite by Gas Chromatography-Mass spectrometry (GC-MS) serves as useful marker to determine the effects of different forms of tobacco consumption. Thus, we conclude
that, our paper describes a simple, sensitive, and rapid HPLC method for cotinine determination in urine may be useful to assess the effect of different types of tobacco use in our population.
Acknowledgment: Authors are indebted to Head of Department Physiology, Principal & Director, BIMS, Belagavi, KIMS, Karad, and RMRC (ICMR), Belagavi for their kind support.
References
1. Gately I. Tobacco: A cultural history of how an exotic plant seduced civilization. New York: Grove Press;2001.
2. Balls EK. Early uses of California plants. California: University of California Press; 1962.
3. Gupta PC, Ray CS. Smokeless tobacco and health in India and South Asia. Respirology 2003; 8:419-431.
4. Moran VE. Cotinine; beyond that expected, more than a biomarker of tobacco consumption. Front Pharmacol 2012; 3:69-77.
5. Jia F, Fu Y, Liu W, Du Z, Zhao Y. Quantitative determination of DNA methylation in tobacco leaves by HPLC. African J Agric Res 2011; 6:1545-1548.
6. Narain R, Sardana S, Gupta S, Sehgal A. Age at initiation & prevalence of tobacco use among school children in Noida, India: A cross-sectional questionnaire based survey. Indian J Med Res, 2011;133: 300-307. 7. Reddy KS, Gupta PC. Report on Tobacco Control in India. Ministry of
Health and Family Welfare, Government of India, New Delhi; 2004. 8. Karbalaie NS, Taghikhani V, Ghotbi C, Yamini Y. Experimental study and
modeling of supercritical extraction of nicotine from tobacco leaves. Iran J Chem Chem Eng 2009; 28: 51-59.
9. Pandey A, Patni N, Sarangi S, Singh M, Sharma K, Vellimana AK,
Patra S. Association of exclusive smokeless tobacco consumption with
10. Siegel D, Benowitz N, Ernster VL, Grady DG, Hauck WW. Smokeless tobacco, cardiovascular risk factors, and nicotine and cotinine levels in professional baseball players, Am J Public Health , 1992; 82: 417-421. 11. Benowitz NL. Cotinine as a biomarker of environmental tobacco smoke
exposure. Epidemiol Rev 1996;18: 188-204.
12. Rabbaa KL, Daoud RA, Karam SD. A simple, sensitive, and rapid method for the determination of cotinine in urine by high-performance liquid chromatography with UV detection. J Chromatogr Sci 2006; 44:535-538. 13. Kim H, Lim Y, Lee S, Park S, Kim C, Hong C, Shin D. Relationship between
environmental tobacco smoke and urinary cotinine levels in passive smokers at their residence. J Expo Anal Environ Epidemiol 2004;14:S65-70.
14. James H, Tizabi Y, Taylor R, Rapid method for the simultaneous measurement of nicotine and cotinine in urine and serum by gas chromatography-mass spectrometry. J Chromatogr Biomed Sci Appl1998;708: 87-93.
15. Kuo HW, Yang JS, Chiu MC. Determination of urinary and salivary cotinine using gas and liquid chromatography and enzyme-linked immunosorbent assay, J Chromatogr Analyt Technol Biomed Life Sci 2002;768:297-303.
16. Bjercke RJ, Cook G, Rychlik N, Gjika HB, Vunakis HV, Langone JJ. Stereospecific monoclonal antibodies to nicotine and cotinine and their use in enzyme-linked immunosorbent assays, J Immunol Methods 1986;90:203-213.
17. Xu X, Iba MM, Weisel CP. Simultaneous and sensitive measurement of anabasine, nicotine, and nicotine metabolites in human urine by liquid chromatography–tandem mass spectrometry. Clin Chem 2004; 50:2323-2330.
18. Sharma S, Joshi RK, Pai SR, Modified UFLC-PDA Method for Determination of Nitrosamines. J Anal Chem, 2014;70:998-1002.
19. Massadeh AM, Gharaibeh AA, Omari KW, A single-step extraction method for the determination of nicotine and cotinine in Jordanian smokers’ blood and urine Samples by RP-HPLC and GC–MS. J Chromatogr Sci 2009; 47:170-177.
20. Joshi RK, Essential oil of flowers of Anaphalis contorta, an aromatic and medicinal plant from India. Nat Prod Commun 2013; 8:225-226. 21. Joshi RK, GC/MS analysis of the essential oil of Senecio belgaumensis
flowers. Nat Prod Commun 2011; 6:1145-1146.
22. Siegmund B, Leyden1 DE, Zikulnig E, Leitner E, Murkovic M, Pfannhauser W, Reif H, The contribution of dietary nicotine and dietary cotinine to salivary cotinine levels as a nicotine biomarker. Food Chem 2001; 74:259-265.
23. Behera D, Uppal R, Majumdar S. Urinary levels of nicotine and cotinine in tobacco users. Indian J Med Res 2003; 118:129-133.
24. Lydia Rabbaa-Khabbaz , Rita Abi Daoud, Dolla Karam-Sarkis. A Simple, Sensitive, and Rapid Method forthe Determination of Cotinine in Urine by High-Performance Liquid Chromatography with UV Detection. Journal of Chromatographic Science 2006; 44:535-538.
25. Benowitz NL. Biomarkers of environmental tobacco smoke exposure. Env Health Perspect 1999; 107: 349-55.
26. Adnan M. Massadeh1, Ahmad A. Gharaibeh2, and Khaled W. Omari.A Single-Step Extraction Method for the Determination of Nicotine and Cotinine in Jordanian Smokers’ Blood and Urine Samples by RP-HPLC and GC–MS. Journal of Chromatographic Science 2009;47:170-177 27. Andrew N. Hoofnagle, Thomas J. Laha, Petrie M. Rainey, and Sayed
M.H. Sadrzadeh, Specific Detection of Anabasine, Nicotine, and Nicotine Metabolites in Urine by Liquid Chromatography–Tandem Mass Spectrometry. Am J Clin Pathol 2006;126:880-887.
28. Xu Xu, Michael M. Iba, Clifford P. Weisel. Simultaneous and Sensitive Measurement of Anabasine, Nicotine, and Nicotine Metabolites in Human Urine by Liquid Chromatography–Tandem Mass Spectrometry. Clinical Chemistry 2004;50(12): 2323–2330.
29. Yen-Hsia Wen, Pei-Shin Yang, Shihn-Sheng Wu. Determination of Cotinine in Human Urine by High-Performance Liquid Chromatography. Journal
of Food and Drug Analysis 2009; 17(5); 357-362.
30. Thomas P. Moyer et al. Simultaneous Analysis of Nicotine, Nicotine Metabolites, and Tobacco Alkaloids in Serum or Urine by Tandem Mass Spectrometry, with Clinically Relevant Metabolic Profiles. Clinical Chemistry 2002; 48(9): 1460–1471.
31. Thanawan Buacharoen et al. The Urinary Cotinine and Serum 25 Hydroxyvitamin D Levels in Male Smokers. J Med Assoc Thai 2012;95(6):S87-S93.
Conflict of interest: Nil Source of funding: Nil
Date received: October 21st 2016