www.biogeosciences.net/12/2077/2015/ doi:10.5194/bg-12-2077-2015
© Author(s) 2015. CC Attribution 3.0 License.
Methanotrophy within the water column of a large meromictic
tropical lake (Lake Kivu, East Africa)
C. Morana1, A. V. Borges2, F. A. E. Roland2, F. Darchambeau2, J.-P. Descy3, and S. Bouillon1
1Department of Earth and Environmental Sciences, KU Leuven, Leuven, Belgium 2Chemical Oceanography Unit, Université de Liège, Liege, Belgium
3Research Unit in Environmental and Evolutionary Biology, UNamur, Namur, Belgium Correspondence to: C. Morana (cedric.morana@ees.kuleuven.be)
Received: 9 October 2014 – Published in Biogeosciences Discuss.: 7 November 2014 Revised: 23 March 2015 – Accepted: 24 March 2015 – Published: 7 April 2015
Abstract. The permanently stratified Lake Kivu is one of the largest freshwater reservoirs of dissolved methane (CH4)
on Earth. Yet CH4 emissions from its surface to the
atmo-sphere have been estimated to be 2 orders of magnitude lower than the CH4 upward flux to the mixed layer,
sug-gesting that microbial CH4oxidation is an important process
within the water column. A combination of natural abun-dance stable carbon isotope analysis (δ13C) of several carbon pools and13CH4-labelling experiments was carried out
dur-ing the rainy and dry season to quantify (i) the contribution of CH4-derived carbon to the biomass, (ii) methanotrophic
bacterial production (MBP), and (iii) methanotrophic bacte-rial growth efficiency (MBGE), defined as the ratio between MBP and gross CH4oxidation. We also investigated the
dis-tribution and the δ13C of specific phospholipid fatty acids (PLFAs), used as biomarkers for aerobic methanotrophs. Maximal MBP rates were measured in the oxycline, suggest-ing that CH4oxidation was mainly driven by oxic processes.
Moreover, our data revealed that methanotrophic organisms in the water column oxidized most of the upward flux of CH4, and that a significant amount of CH4-derived carbon
was incorporated into the microbial biomass in the oxycline. The MBGE was variable (2–50 %) and negatively related to CH4: O2 molar ratios. Thus, a comparatively smaller
frac-tion of CH4-derived carbon was incorporated into the
cellu-lar biomass in deeper waters, at the bottom of the oxycline where oxygen was scarce. The aerobic methanotrophic com-munity was clearly dominated by type I methanotrophs and no evidence was found for an active involvement of type II methanotrophs in CH4oxidation in Lake Kivu, based on fatty
acids analyses. Vertically integrated over the water column,
the MBP was equivalent to 16–60 % of the average phyto-plankton particulate primary production. This relatively high magnitude of MBP, and the substantial contribution of CH4
-derived carbon to the overall biomass in the oxycline, sug-gest that methanotrophic bacteria could potentially sustain a significant fraction of the pelagic food web in the deep, meromictic Lake Kivu.
1 Introduction
Although the atmospheric methane (CH4)concentration is
low compared to carbon dioxide (CO2), CH4contributes
sig-nificantly to the anthropogenic radiative forcing (18 %) be-cause of its 25 times higher global warming potential than CO2 (Forster et al., 2007). CH4 has several natural and
anthropogenic sources and sinks, whereby natural and ar-tificial wetlands are recognized as major CH4 sources to
the atmosphere (e.g. Kirschke et al., 2013). Bastviken et al. (2011) estimated that CH4emissions into the atmosphere
from freshwater ecosystems (0.65 Pg C yr−1 as CO2
equiv-alent) would correspond to 25 % of the global land carbon (C) sink (2.6±1.7 Pg C yr−1, Denman et al., 2007). Tropi-cal regions are responsible for approximately half of the es-timated CH4 emissions from freshwater ecosystems to the
atmosphere, although they have been consistently undersam-pled (Bastviken et al., 2011). Thus, more information on both the magnitude and controlling factors of CH4emissions from
tropical inland waters are warranted. CH4 production rates
are typically higher than CH4emission fluxes to the
within lacustrine sediments or in water columns are effec-tive processes that limit the amount of CH4reaching the
at-mosphere, in particular when vertical CH4transport occurs
mainly through diffusive transport rather than through ebulli-tion. A wide variety of electron acceptors can be used during microbial CH4oxidation, including but not limited to
oxy-gen (O2, Rudd et al., 1974). The use of an enzyme known
as CH4 monooxygenase to catalyze the oxidation of CH4
to methanol is a defining characteristic of aerobic methan-otrophs (Hanson and Hanson, 1996). Methanol is then oxi-dized to formaldehyde, which is assimilated to form interme-diates of central metabolic routes that are subsequently used for biosynthesis of cell material (Hanson and Hanson, 1996 and references therein). Hence, aerobic methanotrophs use CH4not only as an energy source, but also as a C source.
Aer-obic methanotrophs are typically classified into two phyloge-netically distinct groups that use different pathways for the formaldehyde assimilation: the type I methanotrophs belong to the Gammaproteobacteria and use the ribulose monophos-phate pathway, while the type II methanotrophs belong to the
Alphaproteobacteria and use the serine pathway.
Besides aerobic processes, anaerobic CH4oxidation
cou-pled with SO2−4 reduction has been found to be carried out by a syntrophic consortium of CH4-oxidizing archaea and
sulphate-reducing bacteria. The association between the ar-chaea and bacteria is commonly interpreted as an obligate syntrophic interaction in which the archaeal member metabo-lizes CH4leading to the production of an intermediate, which
in turn is scavenged as an electron donor by its SO2−4 reduc-ing partner (Knitell and Boetius, 2009), but the identity of the intermediates transferred between the CH4oxidizers and the
SO2−4 reducers is still uncertain. In contrast to aerobic CH4
oxidation, the contribution of CH4 as a C source would be
minimal as only∼1 % of the oxidized CH4is channelled to
biosynthesis pathway, and the growth of the partners of the consortium is slow, with generation times of months to years (Knitell and Boetius, 2009). Both partners of the consortium are strictly intolerant to O2(Knitell and Boetius, 2009).
Ini-tially reported in marine sediments (Boetius et al., 2000), this consortium was later identified in the water column of marine euxinic basins, such as the Black Sea (Schubert et al., 2006), but rarely in lacustrine systems probably because fresh wa-ters are usually depleted in SO2−4 in comparison with other electron acceptors (NO−3, Fe3+, Mn4+)in contrast with the oceans. Nevertheless, it appeared during the last decade that anaerobic CH4oxidation could be coupled to a wider variety
of electron acceptors that previously thought, including ni-trite (NO−2), nitrate (NO−3), manganese (Mn), and iron (Fe) (Raghoebarsing et al., 2006; Beal et al., 2009).
Aerobic methanotrophic organisms not only use CH4as
electron donors, but they are also able to incorporate a sub-stantial fraction of the CH4-derived C into their biomass,
and could therefore contribute to fuel the pelagic food web (Bastviken et al., 2003; Jones and Grey, 2011; Sanseverino
et al., 2012). A recent study carried out in small boreal lakes (surface area < 0.01 km2) demonstrated that methanotrophic bacterial production (MBP, i.e. incorporation rates of CH4
-derived carbon into the biomass) contributed to 13–52 % of the autochtonous primary production in the water column (Kankaala et al., 2013). However, in spite of the potential im-portance of this alternative C source in aquatic ecosystems, most of the studies carried out in aquatic environments re-ported gross CH4 oxidation, while direct measurements of
MBP in lakes are still scarce. Also, the methanotrophic bac-terial growth efficiency (MBGE), defined as the amount of biomass synthesized from CH4per unit of CH4oxidized, was
found to vary widely in aquatic environments (15–80 % ac-cording to King, 1992; 6–77 % acac-cording to Bastviken et al., 2003), but little is known about the factors driving its vari-ability so that it is currently not possible to derive accurate estimations of the MBP based solely on gross CH4oxidation
rates. A better understanding of the environmental control of MBGE would help to assess more accurately the importance of methanotrophic organisms as carbon sources for higher trophic level of the food web.
Lake Kivu, located in a volcanic area, is one of the largest freshwater CH4 reservoirs, with approximately 60 km2 (at
standard temperature and pressure) dissolved in its perma-nently stratified water (Schmid et al., 2005). Although the deep layers of the lake contain a huge amount of dissolved CH4, Lake Kivu ranks globally among the lakes with the
low-est CH4emissions into the atmosphere (Borges et al., 2011).
Moreover, the emission of CH4from surface waters to the
at-mosphere (0.038 mmol m−2d−1, Borges et al., 2011) is sev-eral orders of magnitude lower than the upward flux of CH4
to the mixed layer (9.38 mmol m−2d−1, Pasche et al., 2009), suggesting that CH4oxidation prevents most of CH4to reach
the surface of the lake. Our knowledge on bacterial CH4
ox-idation in Lake Kivu has so far been based on circumstantial evidence such as mass balance considerations (Borges et al., 2011; Pasche et al., 2011), identification of aerobic CH4
ox-idizers using molecular tools (Pasche et al., 2011) and lipid analysis (Zigah et al., 2015), and a few incubations carried out almost 40 years ago (Jannasch, 1975).
In this study, we used the difference in C stable isotope abundance (δ13C) of different C sources to estimate the frac-tion of CH4 inputs to the mixed layer from deep waters
that is microbially oxidized within the water column, and to quantify the relative contribution of CH4-derived C to the
particulate biomass. Additionally, phospholipid fatty acids (PLFAs) and their δ13C signatures were analyzed to char-acterize the populations of methanotrophic bacteria present in the water column. We also carried out 13CH4-labelling
experiments to trace the incorporation of CH4-derived C
into the biomass (to quantify methanotrophic bacterial pro-duction) and its conversion to CO2 (to quantify
Figure 1. Map of Lake Kivu.
labelling allowed to characterize the bacterial populations ac-tive in methanotrophy.
2 Material and methods
2.1 Study site description and sampling
Lake Kivu (East Africa) is a large (2370 km2) and deep (max-imum depth of 485 m) meromictic lake. Its vertical structure consists of an oxic and nutrient-poor mixed layer (season-ally variable depth, up to 70 m), and a permanently anoxic monimolimnion rich in dissolved gases (CH4, CO2)and
in-organic nutrients (Damas, 1937; Degens et al., 1973; Schmid et al., 2005). Seasonal variations of the vertical position of the oxycline are driven by contrasting hygrometry and long wave radiation between rainy (October–May) and dry (June– September) seasons (Thiery et al., 2014), the latter being characterized by a deepening of the oxic zone, and an in-creased input of dissolved gases and inorganic nutrients into the mixed layer (Sarmento et al., 2006, Borges et al., 2011). Sampling was carried out in the northern basin (1.72◦S, 29.23◦E) in February 2012 (rainy season), and in the north-ern basin and southnorth-ern basin (2.34◦S, 28.98◦E) in Septem-ber 2012 (dry season, Fig. 1).
O2 concentration was measured with a YSI-proODO
probe with a optical O2 sensor (detection limit is
3 µmol L−1), calibrated using air saturated water. Hereafter, “O2-depleted waters” stands for waters with concentration
< 3 µmol L−1. Lake water was collected with a 7 L Niskin bottle (Hydro-Bios) at a depth interval of 5 m from the lake surface to the top of the monimolimnion, at 80 m.
2.2 Chemical analyses
Samples for CH4 concentrations were collected in 50 mL
glass serum bottles from the Niskin bottle with a silicone tubing, left to overflow, poisoned with 100 µL of saturated HgCl2 and sealed with butyl stoppers and aluminium caps.
Concentrations of CH4 were measured by headspace tech-nique (Weiss, 1981) using gas chromatography with flame ionization detection (GC-FID, SRI 8610C), after creating a 20 mL headspace with N2in the glass serum bottles. The
GC-FID was calibrated with CH4:CO2:N2O:N2 mixtures (Air
Liquide Belgium) of 1.05±0.02, 10.2±0.2, 30.3±0.6 and 509±10 ppm CH4. Precision estimated from multiple
injec-tions of gas standards was better than±3 % for the 1.05 ppm standard and better than ±0.5 % for the other three stan-dards. The precision estimated from duplicated samples was
±3.9 %. The concentrations were computed using the CH4
solubility coefficient given by Yamamoto et al. (1976). Sam-ples for the determination of the δ13C signature of CH4
(δ13C-CH4) were collected in 250 mL glass serum bottles
similarly to CH4concentration samples.δ13C-CH4was
de-termined by a custom developed technique, whereby a 20 mL helium headspace was first created, and CH4 was flushed
out through a double-hole needle, CO2was removed with a
CO2 trap (soda lime), and the CH4 was converted to CO2
in an online combustion column similar to that in an ele-mental analyzer (EA). The resulting CO2was subsequently
preconcentrated by the immersion of a stainless steel loop in liquid nitrogen in a custom-built cryo-focussing device, passed through a micro-packed GC column (HayeSep Q 2 m, 0.75 mm ID; Restek), and finally measured on a Thermo Scientific Delta V Advantage isotope ratio mass spectrom-eter (IRMS). Certified reference standards forδ13C analysis (IAEA-CO1 and LSVEC) were used to calibrateδ13C-CH4
data. Reproducibility of measurement estimated based on du-plicate injection of a selection of samples was typically better than±0.5 ‰, or better than±0.2 ‰ when estimated based on multiple injection of standard gas.
Samples for the determination ofδ13C signatures of dis-solved inorganic carbon (DIC) were collected by gently over-filling 12 mL glass vial (Labco Exetainer), preserved with 20 µL of saturated HgCl2. For the analysis ofδ13C-DIC, a
2 mL helium headspace was created, and 100 µL of H3PO4
(99 %) was added into each vial to convert all DIC species into CO2. After overnight equilibration, a variable volume of
the headspace was injected into an EA coupled to an isotope ratio mass spectrometer (EA-IRMS; Thermo Scientific Flash HT with Thermo Scientific Delta V Advantage). Calibration ofδ13C-DIC measurements was performed with certified ref-erence materials (LSVEC and either NBS-19 or IAEA-CO-1) and the reproducibility of the measurement was always better than±0.2 ‰.
fiber filters (Advantec GF-75; 0.3 µm), and dried. These fil-ters were later decarbonated with HCl fumes for 4 h, dried, and packed in silver cups. POC and δ13C-POC were de-termined on an EA-IRMS (Thermo Scientific Flash HT with Thermo Scientific Delta V Advantage). Calibration of POC and δ13C-POC was performed with IAEA-C6 and ac-etanilide, and reproducibility of δ13C-POC measurements, estimated based on triplicate measurements of standard, was typically better than 0.2 ‰.
Samples (∼2 L) for measurements of phospholipid fatty acid concentrations (PLFAs) and their δ13C signature were filtered on pre-combusted 47 mm glass fiber filters (Advan-tec GF-75; 0.3 µ m), and kept frozen until further process-ing. Extraction and derivatization of PLFAs was performed following a modified Bligh and Dyer extraction, silica col-umn partitioning, and mild alkaline transmethylation as de-scribed by Boschker et al. (2004). Analyses were made on a Isolink GC-c-IRMS coupled to a Thermo Scientific Delta V Advantage. All samples were analyzed in splitless mode, using an apolar GC column (Agilent DB-5) with a flow rate of 2 mL min−1of helium as carrier gas. Initial oven temper-ature was set at 60◦C for 1 min, then increased to 130◦C at 40◦C min−1, and subsequently reached 250◦C at a rate of 3◦C min−1.δ13C-PLFAs were corrected for the addition of the methyl group by a simple mass balance calculation, and were calibrated using internal (C19:0) and external (mix-ture of C14:0, C16:0, C18:0, C20:0, C22:0) fatty acid methyl ester (FAME) standards. Reproducibility estimated based on replicates measurement was ±0.6 ‰ or better for natural abundance samples.
2.3 Determination of the isotope fractionation factor In September 2012 (southern basin), the isotope fractiona-tion factor (ε)was estimated by monitoring the changes in CH4concentration andδ13C-CH4over time in microcosms
at several depths (60, 62.5, 65, 67.5 m) across the oxycline. Six glass serum bottles (60 mL) were gently overfilled at each depth and tightly capped with a butyl rubber stopper and an aluminium cap. They were then incubated in the dark at the lake temperature during 0, 24, 48, 72, 96 or 120 h. The in-cubation was stopped by poisoning the bottles with 100 µL of saturated HgCl2. The measurement of the concentration
of CH4and theδ13C-CH4in every bottle was performed as
described before. The isotope fractionation factor was calcu-lated according to Coleman et al. (1981).
2.4 Methanotrophic bacterial production and growth efficiency measurement
At several depths throughout the water column, the methan-otrophic bacterial production and methanmethan-otrophic bacterial growth efficiency were estimated by quantifying the incor-poration of13C-labelled CH4(13C-CH4, 99.9 %, Eurisotop)
into the POC and DIC pool. Water from each sampling depth
was transferred with a silicone tubing into 12 serum bottles (60 mL), capped with butyl stoppers and sealed with alu-minium caps. Thereafter, four different volumes (50, 100, 150, or 200 µL) of a 13C-CH4 gas mixture (1:10 in He)
were injected in triplicate and 100 µL of saturated HgCl2
was immediately added to one bottle per gas concentration treatment, serving as control bottle without biological activ-ity. After vigorous shaking, the bottles were incubated in the dark during 24 h at the lake temperature. The incubation was stopped by filtration of a 40 mL subsample on 25 mm glass fiber filters (Advantec GF-75; 0.3 µm) to measure the13 C-POC enrichment, and a 12 mL Exetainer was filled and poi-soned with the addition of HgCl2in order to measure the13
C-DIC enrichment. The exact amount of13C-CH4added in the
bottles was determined from the bottles poisoned at the be-ginning of the experiment. The measurements of the concen-tration of POC, theδ13C-POC, theδ13C-DIC and theδ13 C-CH4 were performed as described above. Methanotrophic
bacterial production (MBP, µmol L−1d−1)rates were calcu-lated according to Hama et al. (1983):
MBP=POCf·
%13C-POCf−%13C-POCi
t·
%13C-CH4−%13C-POCi
(1) where POCf is the concentration of POC at the end of
in-cubation (µmol L−1), %13C-POCf and %13C-POCi are the
percentage of13C in the POC and the end and the beginning of incubation,t is the incubation time (d−1)and %13C-CH4
is the percentage of13C in CH4directly after the inoculation
of the bottles with the13C tracer. The methanotrophic bacte-rial respiration rates (MBR, µmol L−1d−1)were calculated according to
MBR=DICf·
%13C-DICf−%13C-DICi
t·%13C-CH4−%13C-DICi
, (2)
where DICfis the concentration of DIC after the incubation
(µmol L−1), %13C-DICfand %13C-DICiare the final and
ini-tial percentage of 13C in DIC. Finally, the methanotrophic bacterial growth efficiency (MBGE, %) was calculated ac-cording to
MBGE=MBP/(MBP+MBR)·100. (3)
The CH4 concentration in the bottles sometimes increased
drastically because of the 13C-CH4 addition, which could
have induced a bias in the estimation of MBP and MBR in case of CH4-limitation of the methanotrophic bacteria
com-munity. However, performing incubation along a gradient of CH4 concentrations allowed us to assess if the measured
regression model (r2always better than 0.90) to estimate the intercept with theyaxis, which was assumed to correspond to the MBP or MBR rates at in situ CH4concentration.
2.5 Stable isotope probing of PLFAs (SIP-PLFAs) with
13C-CH 4
At each sampling depth and in parallel with the MBP mea-surement, four serum bottles (250 mL) were filled with wa-ter, overflowed and sealed with butyl stopper and aluminium caps. Bottles were spiked with 500 µL of13C-CH4(99.9 %).
After 24 h of incubation in the dark at lake temperature, the water from the four bottles was combined and filtered on a single pre-combusted 47 mm glass fiber filter (Advantec GF-75; 0.3 µm) to quantify the incorporation of the tracer in bac-terial PLFAs. The filters were kept frozen until further pro-cessing. The extraction, derivatization and analysis by GC-c-IRMS were carried out as described above.
3 Results
3.1 Physico-chemical parameters
In September 2012, the water column in the southern basin was oxic (> 3 µmol L−1)from the surface to 65 m (Fig. 2a). CH4was abundant in deep waters, with a maximum
concen-tration of 899 µmol L−1 at 80 m; however, CH4 decreased
abruptly at the bottom of the oxycline, being 4 orders of magnitude lower in surface waters (Fig. 2a). Consistent with its biogenic origin, CH4was depleted in13C in deep waters
(δ13C-CH4:−55.0 ‰) but became abruptly enriched in13C
at the transition between oxic and O2-depleted waters, where
CH4 concentrations sharply decreased, to reach a maximal
value of−39.0 ‰ at 62.5 m depth (Fig. 2a). Theδ13C-POC values mirrored the pattern ofδ13C-CH4; they were almost
constant from the surface to 55 m (−24.4±0.3 ‰), then showed an abrupt excursion towards more negative values at the bottom of the oxycline, with a minimum value (−42.8 ‰) at 65 m depth (Fig. 2a). Similar results were found in Septem-ber 2012 in the northern basin, where the water was oxic (> 3 µmol L−1)down to 55 m (Fig. 2b). At the transition be-tween oxic and O2-depleted waters, an abrupt isotopic
en-richment of the CH4was also observed and the δ13C-POC
was relatively depleted in 13C, similarly as in the southern basin (Fig. 2b).
In February 2012 in the northern basin, the water was oxic (> 3 µmol L−1)until 45 m depth, but the O2 concentrations
were below the limit of detection deeper in the water col-umn (Fig. 2c). The gradual decrease in the CH4
concentra-tion between 60 and 45 m (from 110 to 3 µmol L−1)was ac-companied by a parallel increase of theδ13C-CH4signature
in the same depth interval (from −55.9 to −41.7 ‰), the residual CH4 becoming isotopically enriched as CH4
con-centration decreased (Fig. 2c). δ13C-POC values were also
slightly lower below the oxic zone, with a minimum at 50 m (−26.9 ‰; Fig. 2c).
3.2 Phospholipid fatty acid concentration and stable isotopic composition
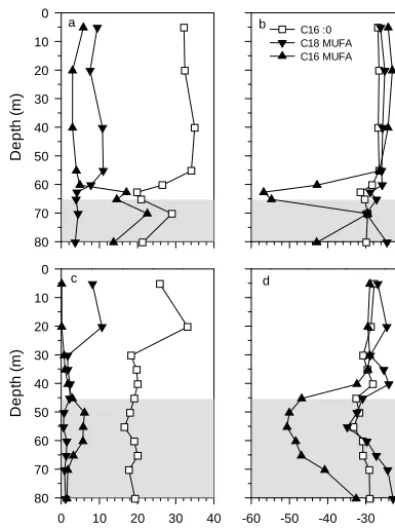
Figure 3 show profiles of the relative concentration and the δ13C signature of specific PLFAs in September 2012 (Fig. 3a, b; southern basin) and February 2012 (Fig. 3c, d; northern basin). Irrespective of station, season and depth, the C16:0 saturated PLFAs was always the most abundant PLFAs (18–35 % of all PLFAs). The relative abundance of the C16 monounsaturated fatty acids (C16 MUFAs) signif-icantly increased at the bottom of the oxycline in February and September 2012. Theδ13C signature of the C16 MU-FAs was comparable to theδ13C signature of the C16:0 in oxic waters, oscillating around−27 or−29 ‰ in February and September 2012, respectively. However, C16 MUFAs were largely depleted in13C in the oxycline, with minimal δ13C values as low as−55.3 ‰ at the transition between oxic and O2-depleted waters in September 2012, and−49.5 ‰ in
February 2012. This very strong depletion inδ13C was only observed for this particular type of PLFAs (C16 MUFAs). The C18 MUFA were slightly more abundant in oxic waters (on average 9 %) than in deeper waters (1–4 %). Their iso-topic composition varied with depth following the same ver-tical pattern than C16 MUFAs, but with a lower amplitude. C18 MUFA minima inδ13C were observed in O2-depleted
waters in February 2012 (55 m, −35.1 ‰) and September 2012 (70 m,−30.5 ‰). The relative abundance of iso- and anteiso-branched C15:0 PLFAs was systematically low (1– 5 %) and did not follow any depth pattern. Their isotopic sig-nature was however slightly lower in O2-depleted waters than
in oxic waters.
3.3 Isotope fractionation factor determination
During the isotope fractionation factor experiment, a signifi-cant decrease of the CH4concentration over time and a
par-allel enrichment of the residual CH4(Fig. 4) were monitored
in every bottle incubated under oxic conditions. However, no consumption of CH4was measured in O2-depleted waters.
The isotope fractionation factor measured at several depths across the oxycline ranged between 1.008 and 1.024, and av-eraged 1.016±0.007 (n=5).
3.4 Methanotrophic bacterial production
MBP rates within the oxycline were variable (from 0 to 7.0 µmol C L−1d−1). Maximum values were always ob-served at the bottom of the oxycline, near the transition between oxic and O2-depleted waters (Fig. 2d, e, f);
how-ever substantial MBP (up to 2.2 µmol L−1d−1) were also recorded in O2-depleted waters in February 2012 (Fig. 2f).
Dissolved O2 (µmol L-1)
0 100 200 300
De
p
th
(
m
)
0
10
20
30
40
50
60
70
80
CH4 (mmol L-1) 10-510-410-310-210-1100101
13C-CH 4 (‰)
-65 -60 -55 -50 -45 -40 -35
13C-POC (‰)
-45 -40 -35 -30 -25 -20
Dissolved O2 (µmol L-1)
0 100 200 300
CH4 (mmol L-1) 10-510-410-310-210-1100101
13C-CH 4 (‰)
-65 -60 -55 -50 -45 -40 -35
13C-POC (‰)
-40 -35 -30 -25 -20
a b
Dissolved O2 (µmol L-1)
0 100 200 300
CH4 (mmol L-1) 10-510-410-310-210-1100101
13C-CH 4 (‰)
-65 -60 -55 -50 -45 -40 -35
13C-POC (‰)
-40 -35 -30 -25 -20
CH4 O2
13C-CH
4 13C-POC
c
D
ept
h
(
m
)
0
10
20
30
40
50
60
70
80
MBP (µmol L-1 d-1)
0 2 4 6 8
MBP (µmol L-1d-1)
0 1 2 3 4
MBP (µmol L-1d-1)
0 1 2 3 4
[image:6.612.158.440.63.423.2]d e f
Figure 2. Vertical profiles of dissolved O2concentration (µmol L−1), CH4concentration (mmol L−1),δ13C-CH4(‰) andδ13C-POC (‰)
in Lake Kivu, in September 2012 (dry season) in the southern basin (a) and northern basin (b), and in February 2012 (rainy season) in the northern basin (c). Information about the precision of measurement can be found in the material and methods section. Vertical profiles of methanotrophic bacterial production rates (MBP, µmol L−1d−1)in September 2012 in the southern basin (d) and northern basin (e) and in February 2012 in the northern basin (f). Symbols in (d), (e), and (f) represent mean values. Horizontal error bars represent standard deviation of replicates, when larger than the data point size. The grey zone corresponds to waters with dissolved O2concentration < 3 µmol L−1.
2012 in the southern and northern basin, respectively, and 29.5 mmol m−2d−1in February 2012 in the northern basin. MBGE was found to be highly variable in the water col-umn ranging between 50 % at 52.5 m in the northern basin (September 2012) and 2 % at 67.5 m in the southern basin (September 2012). Computed from depth-integrated MBP and MBR rates, the water column mean MBGE were 23 % in September 2012 in the southern and northern basins, and 42 % in February 2012 in the northern basin.
Specific CH4-derived C incorporation rates in PLFAs
(d−1; incorporation rates normalized on PLFA concentra-tion) show that bacteria containing C16 MUFA and C14:0 were particularly active in CH4-derived C fixation in the
oxycline in February and September 2012 (Figs. 5a, 4b). In contrast, the specific incorporation pattern was dominated
by C17 MUFA, and to a lesser extent 10Me16:0 and C16 MUFA in O2-depleted waters in February 2012 (Fig. 5b).
4 Discussion
The sharp decrease of CH4concentration and the isotopic
en-richment of the residual CH4in the oxycline, mirrored by the
isotopic depletion of the POC pool at these depths indicated that microbial CH4oxidation is a strong CH4sink within the
water column of Lake Kivu. Similar patterns characterized by a strong isotopic depletion of the POC pool in the oxy-cline were reported in other systems, such as the meromictic northern basin of Lake Lugano (Lehmann et al., 2004; Blees et al., 2014). The fraction of the upward CH4flux oxidized
D
ept
h
(
m
)
0
10
20
30
40
50
60
70
80
C16 :0 C18 MUFA C16 MUFA
a b
13C-PLFA (‰)
-60 -50 -40 -30 -20
Dep
th
(
m
)
0
10
20
30
40
50
60
70
80
PLFA relative abundance (%)
0 10 20 30 40
[image:7.612.67.265.66.331.2]c d
Figure 3. Vertical profiles of the relative abundance of phospho-lipid fatty acids (PLFAs, %) and their respective carbon isotopic signature (δ13C-PLFAs, ‰) in (a, b) the southern basin in Septem-ber 2012 (dry season) and (c, d) in the northern basin in February 2012. Error bars representing standard deviation of replicates were smaller than the data point size. The grey zone corresponds to wa-ters with dissolved O2concentration < 3 µmol L−1.
described by the following equation (rearranged from Eq. 11 in Coleman et al., 1981):
ln(1−f )=lnδ13CH4t+1000
δ13CH4b+1000
((1/α)−1) , (4)
wheref is the fraction of CH4oxidized within the depth
in-terval, δ13CH4b andδ13CH4t are theδ13C values of CH4at
the bottom and the top of the depth interval, respectively, and αis the isotope fractionation factor for CH4oxidation
esti-mated in Lake Kivu in September 2012 (α=1.016±0.007). Based on this equation and using a range of isotope fraction-ation factors (from 1.009 to 1.023), we can estimate that 51– 84 % of the upward flux of CH4 was microbially oxidized
within a 10 m depth interval in the oxycline (60–70 m) in the southern basin during the dry season (September 2012). Similarly, 51–84 % of the CH4flux was oxidized between 50
and 55 m in the northern basin during the dry season, and 58–89 % of the CH4flux was oxidized within a wider depth
interval (45–70 m) during the rainy season (February 2012). The relatively wide range of the estimated percentage of CH4
flux oxidized is due to the uncertainty on the isotope fraction-ation factor. Nevertheless, these calculfraction-ations illustrate clearly
CH4 remaining (%)
60 70 80 90 100
13
C-CH
4
(‰
)
-40 -38 -36 -34 -32 -30 -28
r2 = 0.989
Figure 4. Example (62.5 m) of relationship between theδ13C-CH4 and the fraction of CH4remaining in the bottles during the
incuba-tion (%) to determine the isotope fracincuba-tionaincuba-tion factor carried out in September 2012 in the southern basin. Data points were gathered at a 24 h interval. Symbols are the mean of duplicates; error bars rep-resent standard deviation of duplicates when higher than data point size.
the importance of microbial CH4oxidation processes in
pre-venting CH4to reach the surface waters of the lake.
The theoreticalδ13C signature of methanotrophs can be estimated at each depth fromδ13C-CH4values and the
ex-perimental isotope fractionation factor (α, ranged between 1.009–1023). Applying a simple isotope mixing model with theδ13C signature of methanotrophs as an end-member and theδ13C-POC in the surface (5 m) as an organic matter end-member which forms as sediment, it is possible to estimate the contribution of CH4-derived C to the POC pool. Indeed,
the contribution of CH4-derived C appeared to be substantial
at the bottom of the mixolimnion. In September 2012 in the southern basin, 32–44 % of the depth-integrated POC pool in the oxycline (between 60 and 70 m) originated from CH4
in-corporation, with a local maximum at the transition between oxic and O2-depleted waters (65 m, 44–54 %). In the
north-ern basin, 13–16 % of the POC in the oxycline (between 50 and 60 m) derived from CH4. However, the contribution of
CH4 to the POC pool was relatively lower during the rainy
season, as only 4–6 % of the POC in the 50–70 m depth in-terval, below the oxycline, had been fixed by methanotrophic organisms in the northern basin in February 2012 (local max-imum slightly below the oxycline at 50 m, 8–10 %).
13CH
4 tracer experiments allowed estimation of the net
MBP and the MBGE. Whatever the season, the highest MBP (0.8–7.2 µmol C L−1d−1) rates were found near the transi-tion between oxic and O2-depleted waters. Hence, CH4
ox-idation in Lake Kivu seems to be mainly driven by oxic processes. Furthermore, maximal MBP rates were observed where the in situ CH4: O2 ratio ranged between 0.1 and
[image:7.612.343.512.67.226.2]C 14: 0 i+ a15: 0 C 15: 0 C1 6 M U F A C 16: 0 10M e16: 0 C1 7 M U F A C1 8 M U F A C 18: 0 S p e c if ic C in c o rp o ra tio n in to P L F A ( d -1 ) 0.00 0.05 0.10 0.15 0.20 0.25 62.5 m 65 m 67.5 m 70 m C 14: 0 i+ a15: 0 C 15: 0 C1 6 M U F A C 16: 0 10M e16: 0 C1 7 M U F A C1 8 M U F A C 18: 0 0.00 0.05 0.10 0.15 0.20 0.25 40 m 50 m 60 m a b
Figure 5. Specific CH4-derived C incorporation pattern into phospholipid fatty acids (PLFAs; incorporation rates of C into PLFAs normalized on PLFA concentration, d−1)in (a) September 2012 (dry season) in the southern basin and (b) in February 2012 (rainy season) in the northern basin. Dissolved O2concentration was lower than 3 µmol L−1at 67.5 and 70 m (a), and 50 and 60 m (b).
the optimal ratio estimated in the culture experiments (0.9, Amaral and Knowles, 1995). This relationship highlights the importance of the regulation of aerobic methanotrophic pro-duction by both CH4 and O2 availability. Vertically
inte-grated over the water column, the MBP was estimated at 29.5 mmol m−2d−1 during the rainy season in the northern basin, and 28.6 and 8.2 mmol m−2d−1 during the dry sea-son in the southern basin and the northern basin, respec-tively. These rates are comparable to the gross CH4
oxida-tion rate reported earlier by Jannasch (1975) in Lake Kivu (7.2 mmol m−2d−1)and the upward CH4flux recently
esti-mated (9.38 mmol m−2d−1)by Pasche et al. (2009). Areal MBP in Lake Kivu is equivalent to 16–60 % of the mean an-nual phytoplankton primary production (49 mmol m−2d−1, Darchambeau et al., 2014), suggesting that biomass produc-tion by methanotrophs has the potential to sustain a sig-nificant fraction of the pelagic food web. For example, it has been shown that cyclopoid copepods (mesozooplankton) of Lake Kivu escape visual predators by migrating below the euphotic zone, sometimes down to O2-depleted waters
(Isumbisho et al., 2006), where they might feed on CH4
-derived C sources.
The relative contribution of MBP to the autochtonous production in Lake Kivu was distinctly higher than those reported in three Swedish lakes during summer, where MBP was equivalent to 0.3 and 7.0 % of the phytoplank-ton production (Bastviken et al., 2003). This was unre-lated to the phytoplankton production rates in the Swedish lakes that ranged between 7 and 83 mmol m−2d−1 and encompassed the average phytoplankton production value in Lake Kivu (49 mmol m−2d−1). The MBP rates in the Swedish lakes (based on 14C incubations) were, however, distinctly lower than in Lake Kivu, ranging between 0.3 and 1.8 mmol m−2d−1. This difference is probably related to
CH
4:O2
10-4 10-3 10-2 10-1 100 101 102 103
MB P ( µ mo l L
-1 d
-1 ) 0 1 2 3 4 5 6 7 8 9
O2 > 3 µmol L -1
O2 < 3 µmol L-1
Figure 6. In Lake Kivu, relationship between the methanotrophic bacterial production rates (MBP, µmol C L−1d−1)and the in situ CH4: O2molar ratio. Symbols represent mean MBP values, vertical
error bars represent standard deviation of replicates. The CH4: O2
ratio was calculated with an O2concentration value of 3 µmol L−1 when observed in situ values were below the detection limit of the sensor (3µmol L−1).
the high CH4concentrations at the transition between oxic
and O2-depleted waters in Lake Kivu, as MBP peaked in
the Swedish lakes at CH4 concentrations < 100 µmol L−1,
while MBP peaked in Lake Kivu at CH4concentrations one
[image:8.612.341.511.312.483.2]between 5 and 50 mmol m−2d−1and < 0.2 mmol C m−2d−1 and 41 mmol m−2d−1, respectively. MBP was significantly higher in the two smallest lakes (0.004–0.008 km2), char-acterized by high CH4concentrations (< 750 µmol L−1)and
permanent anoxia throughout the year in bottom waters. Considering a MBGE of 25 %, their MBP estimates corre-sponded to a highly variable percentage of phytoplankton production, between 35 and 100 % in the two smallest lakes, and between 0.4 and 5.0 % in the three larger lakes (0.04 to 13.4 km2), and therefore they proposed that the relative con-tribution of methanotrophic bacteria to the total autotrophic production in a lake is related to its size (Kankaala et al., 2013). However, the results reported for the large (2370 km2) Lake Kivu do not fit with this general pattern, probably be-cause of the permanent and strong stratification of its water column that on one hand promotes a long residence time of deep waters and the accumulation of CH4, and on the other
hand leads to very slow upward diffusion of solutes, promot-ing the removal of CH4by bacterial oxidation as it diffuses
to the surface.
The MBGE found during this study was variable (2–50 %), but within the range of reported values in fresh waters (15– 80 %, King, 1992; 6–72 %, Bastviken et al., 2003). MBGE was negatively related to the CH4: O2 ratio (Fig. 7); i.e.
a smaller fraction of the oxidized CH4 was incorporated
into the biomass at the bottom of the oxycline, where O2
availability was relatively limited compared to CH4. It has
been recently suggested that under O2-limiting conditions,
methanotrophic bacteria are able to generate energy (adeno-sine triphosphate) by fermentation of formaldehyde (Ka-lyuzhnaya et al., 2013), the key intermediate in the oxidation of CH4. This CH4-based fermentation pathway would lead
to the production of excreted organic acids (lactate, formate, ...) from CH4-derived C instead of converting CH4into
cel-lular biomass. If the metabolic abilities for this process are ubiquitous in methanotrophic organisms, it may potentially occur within the water column of Lake Kivu, at the bottom of the oxycline or in micro-oxic zone, as suggested by the low MBGE values found at high CH4: O2molar ratio.
Almost all known aerobic methanotrophic bacteria are phylogenetically affiliated to Proteobacteria, belonging ei-ther to the Gammaproteobacteria (also referred to type I methanotrophs) or Alphaproteobacteria (type II methan-otrophs) classes (Hanson and Hanson, 1996). The two dis-tinct groups differ in some important physiological charac-teristics. Notably, they use different C fixation pathway (ribu-lose monophosphate for type I; the serine pathway for type II) and possess different patterns of PLFAs. C16 MUFA are especially abundant in the type I methanotrophs while the type II methanotrophs contain mainly C18 MUFA (Le Bode-lier et al., 2009). Therefore, the much larger13C depletion of C16 MUFA than C18 MUFA and the strong labelling of C16 MUFA during the incubation with13C-CH4indicate that the
aerobic methanotrophic community was dominated by type I methanotrophs in the water column during this study. In
CH
4:O2
0 20 40 60 80 100
MB
G
E
(
%
)
0 10 20 30 40 50 60
O2 > 3 µmol L -1
[image:9.612.340.511.65.236.2]O2 < 3 µmol L -1
Figure 7. In Lake Kivu, relationship between the methanotrophic bacterial growth efficiency and the in situ CH4: O2 molar ratio.
Symbols represent mean MBGE values, vertical error bars represent standard deviation of replicates. The CH4: O2ratio was calculated
with an O2concentration value of 3 µmol L−1when observed in situ
values were below the detection limit of the sensor (3 µmol L−1).
contrast, Type II methanotrophs did not appear to contribute much to the overall CH4 oxidation in Lake Kivu, in good
agreement with the results of Pasche et al. (2011). Never-theless, in February 2012 the C16 MUFA appeared to be strongly depleted in13C below the transition between oxic and O2-depleted waters (Fig. 3). Strong 13C-depletion of
bacterial lipid markers for aerobic methanotrophic bacteria in O2-depleted waters has also been reported in the Black
Sea (Schubert et al., 2006) and in Lake Lugano (Blees et al., 2014). The presence of methanotrophic bacterial biomass below the oxycline could simply result from gravity-driven physical particle transport from oxic waters, but it has been also demonstrated that some aerobic methanotrophs are able to persist under low oxygen conditions in a reversible state of reduced metabolic activity (Roslev and King, 1995). In con-trast, the recovery of these aerobic methanotrophs after CH4
deprivation under oxic conditions is less successful because of a significant degradation of cell proteins (Roslev and King, 1995). Blees et al. (2014) suggested that this physiologi-cal preference for O2 starvation than CH4starvation under
oxic conditions would drive aerobic methanotrophs towards the O2-depleted part of the oxygen continuum. This
con-cept seems particularly important in tropical lakes because the thermal stratification of the water column is usually very dynamic in these systems due to the small temperature gradi-ent, allowing episodic, yet frequgradi-ent, O2intrusion events into
deeper waters. Aerobic methanotrophs in dormancy would recover quickly after the episodical O2injection, and resume
rapidly micro aerobic CH4oxidation (Blees et al., 2014).
envi-ronments (Schubert et al., 2006; Schmale et al., 2012), but this recurrent observation is still difficult to explain. In a re-cent review, Ho et al. (2013) attempted to classify several genera of methanotrophs according to their life strategies, using the competitor/stress-tolerator/ruderal functional clas-sification framework (Grime, 1977). Since type I methan-otrophs dominate the active community in many environ-ments and are known to respond rapidly to substrate avail-ability, they classified them as competitors, or competitor ruderals. In contrast, they proposed that type II members would be more tolerant to environmental stress, and thus classified them as stress tolerators, or stress-tolerator ruder-als. Relatively large availability of CH4 and O2 (O2: CH4
ratio close to 1, Figs. 2 and 6) at the bottom of the oxycline of Lake Kivu is a favourable environment for the competitor-ruderal bacterial communities that could explain the domi-nance of type I methanotrophs over type II methanotrophs in this lake.
A significant MBP rate (1.3 µmol L−1d−1)was measured in O2-depleted waters (< 3 µmol L−1) at 60 m during the
rainy season (February 2012). Moreover, the PLFA labelling pattern was drastically different, with a more important spe-cific13C incorporation into 10Me16:0 and C17 MUFA in-stead of the C16 MUFA, relative to their concentrations. This different labelling pattern suggests that a different popula-tion of methanotrophs was active in CH4 oxidation deeper
in the water column. Archaea lack ester-linked fatty acids in their membrane and are therefore undetectable in PLFA analysis. However 10Me16:0 and C17 MUFA are known to be especially abundant in sulphate-reducing bacteria (Macal-ady et al., 2000; Boschker and Middelburg, 2002), one of the syntrophic partner of anaerobic CH4oxidizing archaea
(Knittel and Boetius, 2009). Hence, the specific labelling of 10Me16:0 and C17 MUFA in O2-depleted waters could
indi-cates that a fraction of the upward flux of CH4was oxidized
syntrophically by an archaea/bacteria consortium, and might support the hypothesis that the bacterial partner grow on CH4-derived carbon source supplied by anaerobic methane
oxidizers within the consortium, as already suggested by the results of an in vitro labelling (13CH4)study (Blumenberg et
al., 2005). However, our data does not necessary imply that anaerobic methane oxidation would be coupled with SO2−4 reduction, as some sulphate-reducing bacteria have been also found to be able to reduce iron (Coleman et al., 1993). Fur-thermore, the phylogenetic resolution of SIP-PLFA analyses in rather low (Uhlík et al., 2009), and recent studies showed that anaerobic methane oxidation could be carried out syn-trophically by consortium between methanotrophic archaea and denitrifying bacteria (Raghoebarsing et al., 2006), or between methanotrophic archaea and manganese reducing bacteria (Beal et al., 2009). Further investigations would be needed to address more accurately which is the electron ac-ceptors coupled to anaerobic CH4oxidation.
5 Conclusions
We provide conclusive evidences on the occurrence of CH4
oxidation in the oxycline of Lake Kivu using stable iso-topic characterization of a suite of carbon pools (CH4, POC,
PLFAs) as well as rate measurements (MBP). Vertically integrated MBP ranged between 8 and 29 mmol m−2d−1, and was higher than previously reported in other lakes (Bastvinken et al., 2003; Kankaala et al., 2013). MBP was equivalent to 16–60 % of the average annual phytoplankton primary production, a fraction distinctly higher than previ-ously reported in other lakes, usually < 10 % (Bastvinken et al., 2003; Kankaala et al., 2006). Hence, methanotrophic bacteria could potentially sustain a significant fraction of the pelagic food web in this oligotrophic CH4-rich lake.
Lake Kivu ranks globally among the lakes with the lowest CH4 emissions into the atmosphere (Borges et al., 2011),
despite the huge amount of CH4 dissolved in its deep
wa-ters and a relatively high upward flux of CH4to the mixed
layer (9.38 mmol m−2d−1, Pasche et al., 2009). This appar-ent paradox is linked to its strong meromictic nature that on one hand promotes a long residence time of deep waters and the accumulation of CH4, and on the other hand leads to very
slow upward diffusion of solutes, promoting the removal of CH4by microbial oxidation as it diffuses to the surface.
Acknowledgements. We are grateful to Boniface Kaningini, Pas-cal Isumbisho and PasPas-cal Masilya (Institut Supérieur Pédagogique, Bukavu, DRC), Laetitia Nyinawamwiza (National University of Rwanda, Rwanda), for logistic support during the cruises, to Laetitia Montante and to Stephan Hoornaert for help during field-work and during laboratory analysis, and to Christophe Rabouille (associate editor), Martin Schmid, and two anonymous reviewers for providing constructive comments on an earlier version of this manuscript. This work was funded by the EAGLES (East African great lake ecosystem sensitivity to changes, SD/AR/02A) project from the Belgian Federal Science Policy Office (BELSPO, Belgium), the CAKI (Cycle du carbone et des nutriments au Lac Kivu, contract 2.4.598.07) and MICKI (Microbial diversity and processes in Lake Kivu, contract 2.4.515.11) projects from the Fonds National de la Recherche Scientifique (FNRS, Belgium), and contributes to the European Research Council (ERC) starting grant project AFRIVAL (African river basins: catchment-scale carbon fluxes and transformations, 240002). A.V. Borges is a senior research associate at the FNRS.
Edited by: C. Rabouille
References
Amaral, J. A. and Knowles, R.: Growth of methanotrophs in methane and oxygen counter gradients, FEMS Microbiol. Lett., 126, 215–220, 1995.
Bastviken, D., Tranvik, L. J., Downing, J. A., Crill, P. M., and Enrich-Prast, A.: Freshwater methane emissions offset the conti-nental carbon sink, Science, 331, 50–50, 2011.
Beal, E. J., House, C. H., and Orphan, V. J. Manganese-and iron-dependent marine methane oxidation, Science, 325, 184–187, 2009.
Blees, J., Niemann, H., Wenk, C. B., Zopfi, J., Schubert, C. J., Kirf, M. K., Veronesi, M. L., Hitz, C., and Lehmann, M. F.: Micro-aerobic bacterial methane oxidation in the chemocline and anoxic water column of deep south-Alpine Lake Lugano (Switzerland), Limnol. Oceanogr., 59, 311–324, 2014.
Blumenberg, M., Seifert, R., Nauhaus, K., Pape, T., and Michaelis, W.: In vitro study of lipid biosynthesis in an anaerobically methane-oxidizing microbial mat, Appl. Environ. Microb., 71, 4345–4351, 2005.
Boetius, A., Ravenschlag, K., Schubert, C. J., Rickert, D., Wid-del, F., Gieseke, A., Amann, R., Jørgensen, B. B., Witte, U., and Pfannkuche, O.: A marine microbial consortium apparently me-diating anaerobic oxidation of methane, Nature, 407, 623–626, 2000.
Borges, A. V., Abril, G., Delille, B., Descy, J. P., and Darcham-beau, F.: Diffusive methane emissions to the atmosphere from Lake Kivu (Eastern Africa), J. Geophys. Res., 116, G03032, doi:10.1029/2011JG001673, 2011.
Boschker, H. T. S.: Linking microbial community structure and functioning: stable isotope (13C) labeling in combination with PLFA analysis, in: Molecular Microbial Ecology Manual II, edited by: Kowalchuk, G. A., de Bruijn, F. J., Head, I. M., Akker-mans, A. D., and van Elsas, J. D., Kluwer Academic Publishers, the Netherlands, 1673–1688, 2004.
Boschker, H. T. S. and Middelburg, J. J.: Stable isotopes and biomarkers in microbial ecology, FEMS Microbiol. Ecol., 40, 85–95, 2002.
Coleman, D. D., Risatti, J. B., and Schoell, M.: Fractionation of carbon and hydrogen by methane-oxidizing bacteria, Geochim. Cosmochim. Ac., 45, 1033–1037, 1981.
Coleman, M. L., Hedrick, D. B., Lovley, D. R., White, D. C., and Pye, K.: Reduction of Fe(III) in sediments by sulphate-reducing bacteria, Nature, 361, 436–438, 1993.
Damas, H.: La stratification thermique et chimique des lacs Kivu, Edouard et Ndalaga (Congo Belge), Verhandlungen der Inter-nationalen Vereinigung für Theoretische und Angewandte Lim-nologie, Schweizerbart science publishers, Stuttgart, 8, 51–68, 1937.
Darchambeau, F., Sarmento, H., and Descy, J.-P.: Primary produc-tion in a tropical large lake: The role of phytoplankton composi-tion, Sci. Total Environ., 473, 178–188, 2014.
Degens, E. T., vos Herzes, R. P., Wosg, H.-K., Deuser, W. G., and Jannasch, H. W.: Lake Kivu: Structure, chemistry and biology of an East African rift lake, Geologische Rundschau, 62, 245–277, 1973.
Denman, K. L., Brasseur, G., Chidthaisong, A., Ciais, P., Cox, P. M., Dickinson, R. E., Hauglustaine, D., Heinze, C., Holland, E., Jacob, D., Lohmann, U., Ramachandran, S., da Silva Dias, P. L., Wofsy, S. C., and Zhang, X.: Couplings between changes in the climate system and biogeochemistry, in: Climate Change 2007: The Physical Science Basis, Contribution of Working Group I to the Fourth Assessment Report of the Intergovernmental Panel on Climate Change, edited by: Solomon, S., Qin, D., Manning,
M., Chen, Z., Marquis, M., Averyt, K. B., Tignor, M., and Miller, H. L., Cambridge University Press, Cambridge, United Kingdom and New York, NY, USA, 499–587, 2007.
Forster, P., Ramaswamy, V., Artaxo, P., Berntsen, T., Betts, R., Fa-hey, D. W., Haywood, J., Lean, J., Lowe, D. C., Myhre, G., Nganga, J., Prinn, R., Raga, G., Schulz, M., and Van Dorland, R.: Changes in atmospheric constituents and in radiative forc-ing, in: Climate Change 2007: The Physical Science Basis, Con-tribution of Working Group I to the Fourth Assessment Report of the Intergovernmental Panel on Climate Change, edited by: Solomon, S., Qin, D., Manning, M., Chen, Z., Marquis, M., Av-eryt, K. B., Tignor, M., and Miller, H. L., Cambridge University Press, Cambridge, United Kingdom and New York, NY, USA, 499–587, 129–234, 2007.
Grime, J. P.: Evidence for the existence of three primary strategies in plants and its relevance to ecological and evolutionary theory, Am. Nat., 111, 1169–1194, 1977.
Hama, T., Miyazaki, T., Ogawa, Y., Iwakuma, T., Takahashi, M., Ot-suki, A., and Ichimura, S.: Measurement of photosynthetic pro-duction of a marine phytoplankton population using a stable13C isotope, Mar. Biol., 73, 31–36, 1983.
Hanson, R. S. and Hanson, T. E.: Methanotrophic bacteria, Micro-biol. Rev., 60, 439–471, 1996.
Ho, A., Kerckhof, F. M., Luke, C., Reim, A., Krause, S., Boon, N., and Le Bodelier, P. L.: Conceptualizing functional traits and ecological characteristics of methane-oxidizing bacteria as life strategies, Environmental Microbiology Reports, 5, 335–345, 2013.
Isumbisho, M., Sarmento, H., Kaningini, B., Micha, J. C., and De-scy, J-P.: Zooplankton of Lake Kivu, East Africa, half a century after the Tanganyika sardine introduction, J. Plankton Res., 28, 971–989, 2006.
Jannasch, H. W.: Methane oxidation in Lake Kivu (central Africa), Limnolo. Oceanogr., 20, 860–864, 1975.
Jones, R. I. and Grey, J.: Biogenic methane in freshwater food webs, Freshwater Biology, 56, 213–229, 2011.
Kalyuzhnaya, M. G., Yang, S., Rozova, O. N., Smalley, N. E., Clubb, J., Lamb, A., Nagana, G. A., Gowda, D., Raftery, D., Fu, Y., Bringel, F., Vuilleumier, S., Beck, D. A. C., Trosenko, Y. A., Khmelenina, V. N., and Lidstrom, M. E.: Highly efficient methane biocatalysis revealed in a methanotrophic bacterium, Nature communications, 4, 2785, doi:10.1038/ncomms3785, 2013.
Kankaala, P., Taipale, S., Grey, J., Sonninon, E., Arvola, L., and Jones, R. I.: Experimentalδ13C evidence for a contribution of methane to pelagic food webs in lakes, Limnol. Oceanogr., 51, 2821–2827, 2006.
Kankaala, P., Bellido, J. L., Ojala, A., Tulonen, T., and Jones, R. I.: Variable production by different pelagic energy mobilizers in boreal lakes, Ecosystems, 16, 1152–1164, 2013.
King, G. M.: Ecological aspects of methane oxidation, a key deter-minant of global methane dynamics, in: Advances in microbial ecology, edited by: Marshall, K. C., Plenum Press, New York, USA, 431–468, 1992.
J.-F., Langenfelds, R. L., Le Quéré, C., Naik, V., O’Doherty, S., Palmer, P. I., Pison, I., Plummer, D., Poulter, B., Prinn, R. G., Rigby, M., Ringeval, B., Santini, M., Schmidt, M., Shindell, D. T., Simpson, I. J., Spahni, R., Steele, L. P., Strode, S. A., Sudo, K., Szopa, S., van der Werf, G., Voulgarakis, A., van Weele, M., Weiss, R. F., Williams J. E., and Zeng G.: Three decades of global methane sources and sinks, Nat. Geosci., 6, 813–823, doi:10.1038/NGEO1955, 2013.
Knitell, K. and Boetius, A.: Anaerobic oxidation of methane: progress with an unknown process, Annu. Rev. Microbiol., 63, 311–334, 2009.
Le Bodelier, P. L., Gillisen, M. J. B., Hordijk, K., Damsté, J. S. S., Rijpstra, W. I. C., Geenevasen, J. A., and Dunfield, P. F.: A re-analysis of phospholipid fatty acids as ecological biomarkers for methanotrophic bacteria, The ISME journal, 3, 606–617, 2009. Lehmann, M. F., Bernasconi, S. M., McKenzie, J. A., Barbieri, A.,
Simona, M., and Veronesi, M.: Seasonal variation of the δ13C and δ15N of particulate and dissolved carbon and nitrogen in Lake Lugano: Constraints on biogeochemical cycling in a eu-trophic lake, Limnol. Oceanogr., 49, 415–429, 2004.
Macalady, J. L., Mack, E. E., Nelson, D. C., and Scow, K. M.: Sedi-ment microbial community structure and mercury methylation in mercury-polluted Clear Lake, California, Appl. Environ. Micro-biol., 66, 1479–1488, 2000.
Pasche, N., Dinkel, C., Müller, B., Schmid, M., Wüest, A., and Wehrli, B.: Physical and bio-geochemical limits to internal nu-trient loading of meromictic Lake Kivu, Limnol. Oceanogr., 54, 1863–1873, 2009.
Pasche, N., Schmid, M., Vazquez, F., Schubert, C. J., Wüest, A., Kessler, J. D., Pack, M. A., Reeburgh, W. S., and Bürgmann, H.: Methane sources and sinks in Lake Kivu, J. Geophys. Res., 116, G03006, doi:10.1029/2011JG001690, 2011.
Raghoebarsing, A. A, Pol, A., van de Pas-Schoonen, K. T., Smol-ders, A. J. P., Ettwig, K. F., Rijpstra, W. I. C., Schouten, S., Sinninghe Damsté, J. S., Op den Camp, H. J. M., Jetten, M. S. M., and Strous, M.: A microbial consortium couples anaer-obic methane oxidation to denitrification, Nature, 440, 918–921, 2006.
Roslev, P. and King, G. M.: Aerobic and anaerobic starvation metabolism in methanotrophic bacteria, Appl. Environ. Micro-biol., 61, 1563–1570, 1995.
Rudd, J. W., Hamilton, R. D., and Campbell, N. E. R.: Measure-ment of microbial oxidation of methane in lake water, Limnol. Oceanogr., 19, 519–524, 1974.
Sanseverino, A. M., Bastviken, D., Sundh, I., Pickova, J., and Enrich-Prast, A.: Methane Carbon Supports Aquatic Food Webs to the Fish Level, PLoS ONE, 7, e42723, doi:10.1371/journal.pone.0042723, 2012.
Sarmento, H., Isumbisho, M., and Descy, J.-P.: Phytoplankton ecol-ogy of Lake Kivu (Eastern Africa), J. Plankton Res., 28, 815– 829, 2006.
Schmale, O., Blumenberg, M., Kießlich, K., Jakobs, G., Bernd-meyer, C., Labrenz, M., Thiel, V., and Rehder, G.: Aero-bic methanotrophy within the pelagic redox-zone of the Got-land Deep (central Baltic Sea), Biogeosciences, 9, 4969–4977, doi:10.5194/bg-9-4969-2012, 2012.
Schmid, M., Halbwachs, M., Wehrli, B., and Wüest, A.: Weak mix-ing in Lake Kivu: new insights indicate increasmix-ing risk of uncon-trolled gas eruption, Geochem. Geophys. Geosys., 6, Q07009, doi:10.1029/2004GC000892, 2005.
Schubert, C. J., Coolen, M. J., Neretin, L. N., Schippers, A., Abbas, B., Durisch-Kaiser, and Kuypers, M. M.: Aerobic and anaerobic methanotrophs in the Black Sea water column, Environ. Micro-biol., 8, 1844–1856, 2006.
Sundh, I., Bastviken, D., and Tranvik, L. J.: Abundance, activity, and community structure of pelagic methane-oxidizing bacteria in temperate lakes, Appl. Environ. Microbiol., 71, 6746–6752, 2005.
Thiery, W., Martynov, A., Darchambeau, F., Descy, J.-P., Plisnier, P.-D., Sushama, L., and van Lipzig, N. P. M.: Understanding the performance of the FLake model over two African Great Lakes, Geosci. Model Dev., 7, 317–337, doi:10.5194/gmd-7-317-2014, 2014.
Uhlík, O., Jecná, K., Leigh, M. B., Macková, M., and Macek, T.: DNA-based stable isotope probing: a link between commu-nity structure and function, Sci. Total Environ., 407, 3611–3619, 2009.
Weiss, R. F.: Determinations of carbon dioxide and methane by dual catalyst flame ionization chromatography and nitrous oxide by electron capture chromatography, J. Chromatogr. Sci., 19, 611– 616, 1981.
Yamamoto, S., Alcauskas, J. B., and Crozier, T. E.: Solubility of methane in distilled water and seawater, J. Chem. Eng., 21, 78– 80, 1976.