Ann. Geophys., 28, 603–619, 2010 www.ann-geophys.net/28/603/2010/
© Author(s) 2010. This work is distributed under the Creative Commons Attribution 3.0 License.
Annales
Geophysicae
Sensitivity of WRF cloud microphysics to simulations of a severe
thunderstorm event over Southeast India
M. Rajeevan1, A. Kesarkar1, S. B. Thampi2, T. N. Rao1, B. Radhakrishna1, and M. Rajasekhar3
1National Atmospheric Research Laboratory, Gadanki, 517 112, India
2Doppler Weather Radar Division, India Meteorological Department, Chennai, India 3SHAR Center, ISRO, Sriharikota, India
Received: 15 July 2009 – Revised: 16 February 2010 – Accepted: 16 February 2010 – Published: 19 February 2010
Abstract. In the present study, we have used the Weather
Research and Forecasting (WRF) model to simulate the fea-tures associated with a severe thunderstorm observed over Gadanki (13.5◦N, 79.2◦E), over southeast India, on 21 May 2008 and examined its sensitivity to four different micro-physical (MP) schemes (Thompson, Lin, WSM6 and Mor-rison). We have used the WRF model with three nested do-mains with the innermost domain of 2 km grid spacing with explicit convection. The model was integrated for 36 h with the GFS initial conditions of 00:00 UTC, 21 May 2008. For validating simulated features of the thunderstorm, we have considered the vertical wind measurements made by the In-dian MST radar installed at Gadanki, reflectivity profiles by the Doppler Weather Radar at Chennai, and automatic weather station data at Gadanki.
There are major differences in the simulations of the thun-derstorm among the MP schemes, in spite of using the same initial and boundary conditions and model configura-tion. First of all, all the four schemes simulated severe con-vection over Gadanki almost an hour before the observed storm. The DWR data suggested passage of two convec-tive cores over Gadanki on 21 May, which was simulated by the model in all the four MP schemes. Comparatively, the Thompson scheme simulated the observed features of the updraft/downdraft cores reasonably well. However, all the four schemes underestimated strength and vertical extend of the updraft cores. The MP schemes also showed problems in simulating the downdrafts associated with the storm. While the Thompson scheme simulated surface rainfall distribution closer to observations, the other three schemes overestimated observed rainfall. However, all the four MP schemes simu-lated the surface wind variations associated with the thun-derstorm reasonably well. The model simulated reflectivity
Correspondence to: M. Rajeevan
profiles were consistent with the observed reflectivity pro-file, showing two convective cores. These features are con-sistent with the simulated condensate profiles, which peaked around 5–6 km. As the results are dependent on initial condi-tions, in simulations with different initial condicondi-tions, differ-ent schemes may become closer to observations. The presdiffer-ent study suggests not only large sensitivity but also variability of the microphysical schemes in the simulations of the thunder-storm. The study also emphasizes the need for a comprehen-sive observational campaign using multi-observational plat-forms to improve the parameterization of the cloud micro-physics and land surface processes over the Indian region.
Keywords. Meteorology and atmospheric dynamics (Mesoscale meteorology)
1 Introduction
Mesoscale convective systems (MCS), the largest of the con-vective systems account for a large proportion of precipi-tation in both the Tropics and mid-latitudes. Slow moving MCSs are a major cause of flooding and these systems often contain hail and strong winds. A broad descriptive definition of an MCS is an ensemble of thunderstorms that produces a contiguous precipitation area of around 100 km or more in at least one direction (Houze, 2004). However, the dynamics of an MCS are often more complex than those of individ-ual cumulonimbus clouds or lines of cumulonimbus (Houze, 1993). MCSs often contain a large region of stratiform pre-cipitation and mesoscale circulations and they are important link between atmospheric convection and the large-scale at-mospheric circulation (Houze, 2004).
604 M. Rajeevan et al.: Sensitivity of WRF cloud microphysics to simulations of a severe thunderstorm event other sectors. The techniques for predicting thunderstorms
can be classified into two groups (Wilson et al., 1998). One method is a historical treatment of thunderstorm extrapola-tion techniques, first assuming no change in moextrapola-tion, size and intensity and second allowing for changes in size and inten-sity based on past trends. The second method is explicit pre-diction using high resolution numerical weather prepre-diction models. Prediction of thunderstorms is one of the most diffi-cult tasks in weather prediction, due to rather smaller spatial and temporal scales and the inherent non-linearity of their dynamics and physics. The inadequate treatment of sub-grid convection is widely believed to be a major impediment for improving the poor performance of Numerical Weather Pre-diction (NWP) models in precipitation forecasting (Liu and Moncrieff, 2007). The improvement in the existing con-vective parameterizations is however rather slow. Since, the computing power has now advanced, the use of high-resolution explicit (convection permitting) numerical mod-els is recommended. With the growing computing power, it is anticipated that the horizontal grid space in operational NWP models, perhaps even global models will be a few kilometers within a decade (Liu and Moncrieff, 2007). The high-resolution 3–6 km grid spacing simulations of precipi-tation using convection allowing configuration showed good promise (Done et al., 2004; Liu et al., 2006; Kain et al., 2006, 2008; Moncrieff and Liu, 2006; Trier et al., 2006; Lean et al., 2008). There are several reasons for better performance by the high-resolution models. The increased resolution is ex-pected to enable the model to represent mesoscale features that would otherwise not be resolved and to represent con-vection rather explicitly rather than by a concon-vection param-eterization. There are number of studies (Weisman et al., 1997; Speer and Leslie, 2002; Done et al., 2004) suggesting improved representation of thunderstorms and squall lines as the grid length is reduced toward 1 km. The study by Done et al. (2004) compared the forecast performance of two fore-casts configurations. One configuration used a 10-km grid spacing with parameterized convection. In the other config-uration, much larger resolution (4 km) with explicit convec-tion was used. Their analysis showed that the convecconvec-tion ex-plicit forecasts with a 4-km grid spacing more often predict identifiable MCSs. Further, such predictions more accurately predict the number of MCSs daily and type of organization. Kain et al. (2008) used two configurations of the WRF model to produce 30-h forecasts, 5 days a week and for a total of 7 weeks. These configurations used the same physical param-eterizations and same initial and boundary conditions, dif-fering only the spatial resolution. The results showed that in general, the 2-km forecasts provide more detailed presen-tations of convective activity, but there appears to be little forecast skill on the scales where the added details emerge. However, these studies are for the mid-latitude weather sys-tems, where the frontal systems can dominate the model formance. However, the role of grid spacing on model per-formance cannot be transformed to Indian monsoon region.
Cloud microphysical processes play an important role through direct influences on the cold pool strength (due to rainfall evaporation) and latent heating (due to condensa-tion). Therefore, microphysical parameterizations could be a principal source of uncertainty in convection allowing high resolution numerical weather prediction models. It is impor-tant to quantify the uncertainty associated with the cloud mi-crophysics parameterization – a salient concern in convec-tion permitting models. It is also important to assess whether increasingly sophisticated cloud microphysics gives consis-tently better results. Therefore, assessing the cloud micro-physical schemes is not only of practical significance but also helpful for guiding the future improvement of cloud micro-physics parameterizations.
The sensitivity of cloud microphysics in predicting con-vective storms and precipitation has been addressed by many researchers (McCumber, 1991; Gilmore et al., 2004; Reis-ner et al., 1998; Liu and Moncrieff, 2007). Liu and Mon-crieff (2007) evaluated the sensitivity of explicit simula-tions of coherent rainfall patterns to several bulk microphys-ical schemes using multi-day cloud-system-resolving simu-lations at 3 km grid spacing. They compared four micro-physical parameterization schemes. They found that upper-level condensate and cloudiness, upper-upper-level radiative cool-ing/heating and rainfall spectrum are the most sensitive, whereas the domain-mean rainfall rate and areal coverage display moderate sensitivity. Overall, three mixed phase schemes outperform the simple ice scheme but a general conclusion about the degree of sophistication in the micro-physics treatment and the performance is not achievable.
In India, studies related to modeling of clouds and thunder-storms are scarce. Recently, Litta and Mohanty (2008) sim-ulated features of a severe thunderstorm event observed over north-east India (Kolkata) using WRF (NMM) model us-ing field experiment data and concluded that high-resolution models have the potential to provide unique and valuable in-formation for severe thunderstorm forecasters. Mukhopad-hayay et al. (2005) analyzed the impact of assimilation of sur-face meteorological observations on monsoon weather sys-tems including thunderstorms over the Indian region using RAMS model.
At the National Atmospheric Research Laboratory (NARL), Gadanki, (13.5◦N, 79.2◦E) India, an experimental campaign was recently initiated to Study the Atmospheric Forcing and Response (SAFAR) to address the responses of the earth’s atmosphere to both natural and anthropogenic forcings using different observational platforms and models. As a prelude to the main program a pilot campaign was con-ducted at Gadanki during 2008 using collocated observations from the MST radar, Rayleigh lidar, GPS sonde, automated weather stations and instruments measuring aerosol, radia-tion and precipitaradia-tion and supporting satellite data.
M. Rajeevan et al.: Sensitivity of WRF cloud microphysics to simulations of a severe thunderstorm event 605
Fig. 1a. Nested model domains used for the simulation of the thun-derstorm. Domain resolution is 32 km, 8 km and 2 km, respectively.
different cloud microphysical schemes. The primary objec-tives of this study are to examine whether the high resolution WRF model is capable of simulating the observed features of the thunderstorm and the sensitivity of simulation to dif-ferent microphysics. The simulations are done with the grid spacing of 2 km resolution with no cumulus parameterization but using explicit convection. In particular, we have exam-ined the updrafts and downdrafts associated with the thunder-storm, spatial distribution of rainfall and surface wind and the vertical profiles of reflectivity and hydrometeors. Available data from the Indian Mesosphere-Stratosphere-Troposphere (MST) radar, Doppler Weather Radar (DWR) data and other observational platforms at NARL were used to verify the simulated features of the convective event.
In Sect. 2, data and methods are described. The Sect. 3 deals with the main results of the model simulations and the conclusions are drawn in Sect. 4.
2 Data and methodology
[image:3.595.51.283.64.251.2]In the present study, we have used the Weather Research and Forecasting (WRF) model version 3.0 for the simulations of the MCS event and features associated with the thunder-storm observed over Gadanki on 21 May 2008. We have used the model with Advanced Research WRF (ARW) dynamical core. For model simulations, we have considered a config-uration with three nested domains of 32 km, 8 km and 2 km grid spacing. The configurations used for model simulations are shown in Fig. 1a. For better simulation of the thunder-storm event, inner most domain with 1 km resolution will be ideally required. However, due to the limited computing re-sources, we have considered the innermost domain with 2 km resolution. The model used 38 vertical levels with the top of
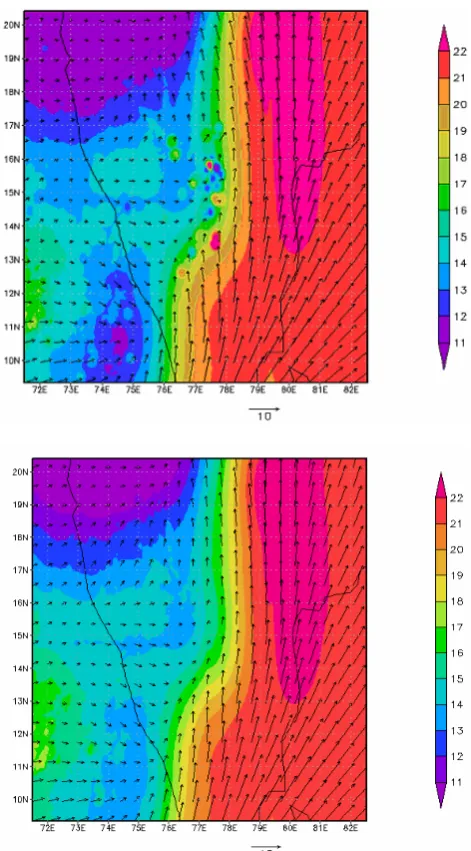
Fig. 1b. Spatial distribution of surface winds and specific
humid-ity (g kg−1) at 00:00 UTC, 21 May 2008 without data assimilation
(top) and with data assimilation (below).
606 M. Rajeevan et al.: Sensitivity of WRF cloud microphysics to simulations of a severe thunderstorm event
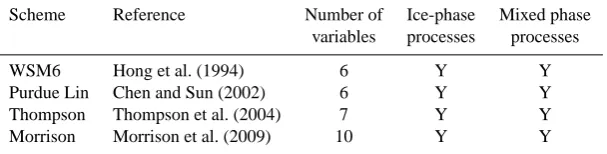
Table 1. Details of the microphysical schemes considered in the study.
Scheme Reference Number of Ice-phase Mixed phase
variables processes processes
WSM6 Hong et al. (1994) 6 Y Y
Purdue Lin Chen and Sun (2002) 6 Y Y
Thompson Thompson et al. (2004) 7 Y Y
Morrison Morrison et al. (2009) 10 Y Y
by Multi-quardratic Scheme. The Multi-quadric scheme uses hyperboloid radial basis functions to perform the objective analysis. If observations are not sufficient to evaluate multi-quadratic function, the Cressman method is used for nudging these observations. The observation nudging is done with the existing option available in the WRF model. Figure 1b shows the difference in the surface wind flow and specific humidity at 00:00 UTC of 21 May with and without data assimilation. There are changes in the surface specific humidity and wind circulation over south India due to assimilation of local me-teorological data.
The Betts Miller Janjic (BMJ) Cumulus parameterization scheme was used in the first and second domains, while ex-plicit convection was used in the cloud-resolving innermost domain (2 km grid spacing). Radiation is treated using the RRTM long-wave scheme, a spectral-band radiative transfer model using the correlated K-method (Mlawer et al., 1997) and the Dudhia (1989) shortwave scheme. For the land sur-face process, Noah LSM scheme was used.
Four microphysical schemes were considered to examine the sensitivity of the cloud microphysics in the simulation of convective updrafts. Microphysics in the model includes explicitly resolved water vapor, cloud and precipitation pro-cesses. The schemes considered are single moment six-class (WSM6) scheme (Hong et al., 2004), the Thompson Scheme (Thompson et al., 2004), the Purdue Lin Scheme (Chen and Sun, 2002) and the double moment Morrison Scheme (Morrison et al., 2009). A comparison of the microphysical schemes is given in Table 1.
The six-class WSM6 scheme extends the WSM5 scheme to include graupel and its associated processes. Some of the graupel-related terms follow Lin et al. (1983) and its ice-phase behaviour is much different due to the changes of Hong et al. (2004). In the Purdue Lin scheme, six classes of hy-drometeors (water vapour, cloud water, rain, cloud ice, snow and graupel) are considered. All parameterization produc-tion terms are based on Lin et al. (1983) and Rutledge and Hobbs (1984) with some modifications. The scheme is taken from the Purdue cloud model and the details can be found in Chen and Sun (2002). Thompson scheme is also a sin-gle moment scheme, but it incorporates a large number of improvements to both physical process and computer coding plus employs many techniques found in far more
sophisti-cated spectral/bin schemes. The assumed snow size distribu-tion depends on both ice water content and temperature and is represented as a sum of exponential and gamma distribu-tions. Morrison scheme (Morrison et al., 2009) is however a double moment scheme and six species of water (vapour, cloud droplets, cloud ice, rain, snow and graupel/hail) are considered. Prognostic variables include number concentra-tions and mixing ratios of cloud ice, rain, snow and grau-pel/hail and mixing ratios of cloud droplets and water vapour (total 10 variables). The prediction of two moments (i.e., both number concentration and mixing ratio) allows for a more robust treatment of the particle size distributions, which are a key for calculating the microphysical process rates and cloud/precipitation evolution.
Since the storm data are not included in the initial condi-tions, low level convergence in these simulations takes some time to spin up from the large scale circulation and hence the models are not generally reliable for the first 6 h or so (Wil-son et al., 1998). Therefore, we have considered only the results from 06:00 UTC of 21 May for further discussions.
M. Rajeevan et al.: Sensitivity of WRF cloud microphysics to simulations of a severe thunderstorm event 607
(
a)
0800 UTC
(
b) 0900 UTC
(
c)1000 UTC
(
d) 1100 UTC
(
a)
0800 UTC
(
b) 0900 UTC
(
c)1000 UTC
(
d) 1100 UTC
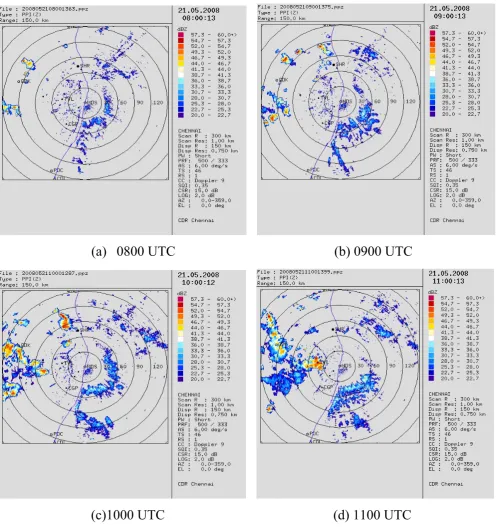
Fig. 2. Spatial distribution of maximum reflectivity observed by the DWR at Chennai at (a) 08:00 UTC, (b) 09:00 UTC, (c) 10:00 UTC, and (d) 11:00 UTC.
The reflectivity profile data are the observations taken by the Doppler weather radar (DWR) installed at Chennai. For analyzing surface observed features of the thunderstorm over Gadanki, we have used the AWS observations recorded at Gadanki on 21 May 2008. For comparing simulated surface
[image:5.595.52.551.60.588.2]608 M. Rajeevan et al.: Sensitivity of WRF cloud microphysics to simulations of a severe thunderstorm event 10 15 20 25 30 35 40 45
0 1 2 3 4 5 6 7 8 9 10 11 12 13 14 15 16 17 18 19 20 21 Tim e (UTC)
T em p erat u re ( C ) 0 5 10 15 20 25 R ain fa ll ( m m ) 0 1 2 3 4 5 6 7 8
0 1 2 3 4 5 6 7 8 9 10 11 12 13 14 15 16 17 18 19 20 21 Tim e (UTC)
W in d S p eed ( m /sec) 0 50 100 150 200 250 300 350 400 W in d d irect io n (d eg rees) 960 961 962 963 964 965 966 967 968
0 1 2 3 4 5 6 7 8 9 10 11 12 13 14 15 16 17 18 19 20 21 Tim e (UTC)
P ressu re ( h P a) 10 15 20 25 30 35 40 45
0 1 2 3 4 5 6 7 8 9 10 11 12 13 14 15 16 17 18 19 20 21 Tim e (UTC)
T em p erat u re ( C ) 0 5 10 15 20 25 R ain fa ll ( m m ) 0 1 2 3 4 5 6 7 8
0 1 2 3 4 5 6 7 8 9 10 11 12 13 14 15 16 17 18 19 20 21 Tim e (UTC)
W in d S p eed ( m /sec) 0 50 100 150 200 250 300 350 400 W in d d irect io n (d eg rees) 960 961 962 963 964 965 966 967 968
0 1 2 3 4 5 6 7 8 9 10 11 12 13 14 15 16 17 18 19 20 21 Tim e (UTC)
P ressu re ( h P a) 10 15 20 25 30 35 40 45
0 1 2 3 4 5 6 7 8 9 10 11 12 13 14 15 16 17 18 19 20 21
Tim e (UTC)
T em p erat u re ( C ) 0 5 10 15 20 25 R ain fa ll ( m m ) 0 1 2 3 4 5 6 7 8
0 1 2 3 4 5 6 7 8 9 10 11 12 13 14 15 16 17 18 19 20 21
Tim e (UTC)
W in d S p eed ( m /sec) 0 50 100 150 200 250 300 350 400 W in d d irect io n (d eg rees) 960 961 962 963 964 965 966 967 968
0 1 2 3 4 5 6 7 8 9 10 11 12 13 14 15 16 17 18 19 20 21
Tim e (UTC)
P ressu re ( h P a)
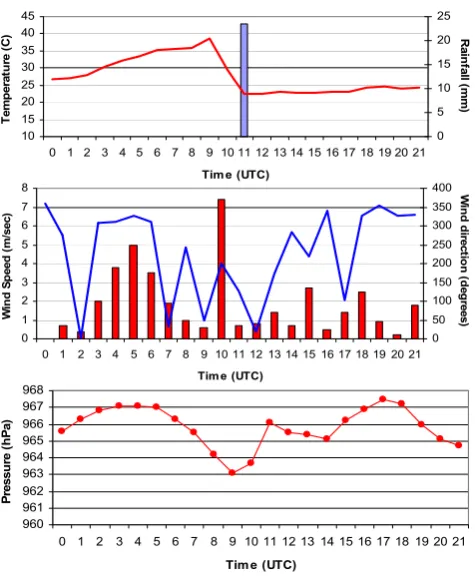
Fig. 3. Details of the thunderstorm observed over Gadanki on 21 May 2008. The top panel shows the variation of dry bulb tempera-ture (continuous line) and rainfall in mm (vertical bar). The middle panel shows variation of wind direction (line) and wind speed (ver-tical bars). The bottom panel shows the variation of surface pressure on 21 May 2008.
There is good density of rain-gauges over south-east India for interpolating rainfall into regular grids. More details of this data set are available in Rajeevan and Bhate (2009).
3 Results and discussions
3.1 Details of the thunderstorm
The convective event occurred in the afternoon of 21 May along the line of convergence observed over south peninsula in the lower troposphere (Fig. 1b). Figure 2 shows the spatial distribution of maximum reflectivity recorded by the Doppler weather Radar (DWR) at Chennai, which shows the gene-sis, intensification and propagation of the convective event. The genesis of the event was observed over southwest of Gadanki around 07:00 UTC on 21 May and the line of con-vective clouds propagated northeastwards and started dissi-pating after around 12:00 UTC. Maximum reflectivity ex-ceeding 40 dbz was observed over Gadanki during the pas-sage of the convective event. In association with this convec-tive event, a severe thunderstorm was observed over Gadanki
around 10:00 UTC. The main features of the thunderstorm observed over Gadanki on 21 May 2008 are given in Fig. 3. It shows the variation of dry bulb temperature, rainfall, wind speed and direction and surface pressure recorded by the Au-tomatic Weather Station (AWS) installed at Gadanki. The temperature record shows sudden cooling associated with the passage of cold front ahead of the thunderstorm. The cool-ing was very rapid, about 15◦C in just two hours. Rainfall of 23 mm was reported at around 11:00 UTC. Associated with the passage of the thunderstorm, there were abrupt changes in the wind direction and speed, wind speed increased up to 7.5 m s−1and wind direction changed from northwesterly to southeasterly winds. Surface pressure also showed a small rise around 11:00 UTC associated with the passage of the meso-high of the thunderstorm. All these observed varia-tions were consistent with such variavaria-tions of meteorological parameters associated with a thunderstorm.
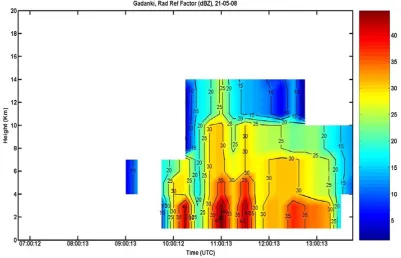
Spatial distribution of accumulated 24-h rainfall observed as on 22 May 2008 is shown in Fig. 4a. Accumulated rain-fall is estimated from rain-gauge stations archived at the In-dia Meteorological Department (IMD) (Rajeevan and Bhate, 2009). The distribution suggests rainfall of the order of 35 mm between 13◦–16◦N, east of 77.5◦E, associated with the convective event. The observed vertical profile of re-flectivity over Gadanki measured by the DWR at Chennai is shown in Fig. 4b. It shows a sharp rise in reflectivity up to around 10 km as the thunderstorm passed over Gadanki. It shows passage of two convective cores, one just after 10:00 UTC and another after 11:00 UTC. The second con-vective core persisted over Gadanki for a longer time. Reflec-tivity was found to be maximum (>40 dbz) in the lower tro-posphere below 5 km. Reflectivity values exceeding 30 dbz was observed extending up to 10 km. Reflectivity values de-creased just after 12:00 UTC, as the storm moved away.
[image:6.595.49.287.58.347.2]M. Rajeevan et al.: Sensitivity of WRF cloud microphysics to simulations of a severe thunderstorm event 609
[image:7.595.129.465.64.298.2]
Bay of
Bengal
Fig. 4a. Observed 24 h accumulated rainfall (mm) ending 00:00 UTC of 22 May 2008 from IMD rain-gauge observations.
Fig. 4b. Vertical profile of reflectivity (dbz) at Gadanki on 21 May 2008 measured by the Doppler Weather Radar (DWR) at Chennai.
active, weak and suppressed monsoon periods. However, the simulations showed some sensitivity to cloud microphysics options considered. Availability of measured convective up-drafts will be very useful to validate the simulated upup-drafts and also to use as a basis for improving cloud microphysics in the models.
[image:7.595.97.499.337.595.2]610 M. Rajeevan et al.: Sensitivity of WRF cloud microphysics to simulations of a severe thunderstorm event
[image:8.595.48.286.62.287.2]
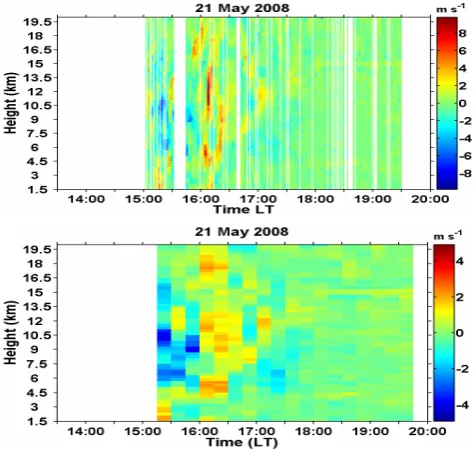
Fig. 5. Vertical velocity (m s−1)derived from the MST radar data
on 21 May 2008. The top panel shows wind speed averaged over a minute and the bottom panel shows the same averaged over 15 min.
almost for two hours, from 15:00 to 17:00 IST. The observed feature suggests two updraft cores, one just after 15:00 h (09:30 UTC) and another after an hour (16:00 h/10:30 UTC). The second core was much stronger with updrafts exceed-ing even 8 m s−1. Just before the passage of the second core, downdrafts are observed between 5 and 10 km. The first core was mostly confined only up to 4.5 km while the second core extended more than 18 km. An important feature is the large downdrafts observed between 15:00 and 16:00 h, just before the passage of the second core. Downdraft with lesser inten-sity also was observed during the passage of the second core at Gadanki, below about 7 km.
3.2 Simulations of updraft and downdraft profiles
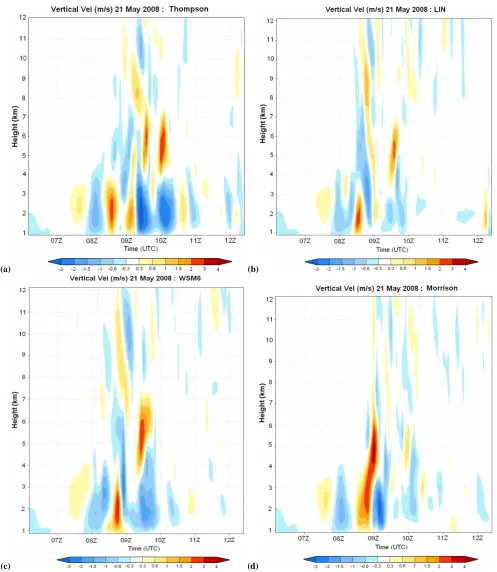
The model simulated updrafts and downdrafts associated with the thunderstorm at Gadanki are shown in Fig. 6 for the four different MP schemes. A key aspect of predicting severe thunderstorms is to represent correctly the initiation of con-vection. All the MP schemes simulated the initiation of up-draft/downdraft cores almost an hour earlier than observed. Lean et al. (2008) using the Met office unified model showed that in the case of explicit convection, the initiation of con-vection takes place more rapidly as the grid length is reduced. Thompson and WSM6 schemes simulate two updraft cores with the associated downdrafts. The Lin scheme showed much disorganized updraft/downdraft cores. The Morrison scheme simulates one strong updraft core around 08:30 UTC, much earlier than observed. Comparatively, downdrafts are stronger in the Thompson scheme than any other scheme.
Thompson and WSM6 schemes simulate strong downdrafts below the updraft cores. In the observed pattern (Fig. 5) also, such a feature was noticed. The simulated updrafts are how-ever limited below around 10 km, while the MST radar obser-vations show large updrafts above 10 km. Also, the strength of the simulated updraft cores is much weaker than the ob-served. In the Thompson scheme, updrafts are of the order of 2 m s−1and the WSM6 and Morrison schemes simulated updrafts exceeding 3 m s−1. However, the MST radar obser-vations showed updrafts exceeding 8 m s−1.
In Fig. 2, it is shown that the convective event propagated towards northeast and passed Gadanki around 10:00 UTC. To examine the skill of the model in simulating northward propagation of the convective event, plots showing north-ward movement of simulated vertical updraft cores were pre-pared and the results are shown in Fig. 7. All the four MP schemes showed northward propagation of the convec-tive updraft cores. However, the Thompson scheme simu-lated more downdrafts behind the updraft cores. In the Lin scheme, downdrafts are hardly simulated. The model simu-lates the propagation of about 30 km by the convective event in 2 h.
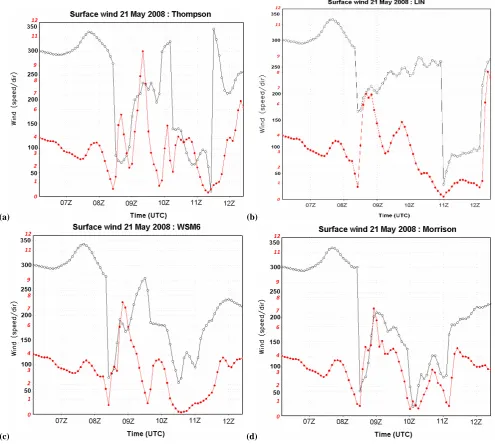
3.3 Simulation of rainfall and surface wind
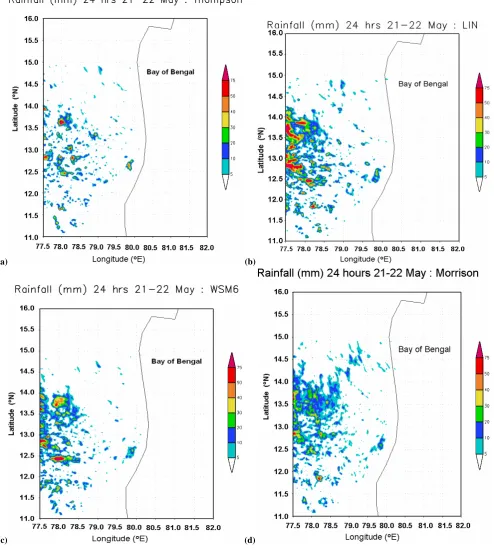
Figure 8 shows simulated rainfall accumulated for 24 h end-ing 00:00 UTC of 22 May 2008. The observed rainfall pat-tern is shown in Fig. 4a, which showed rainfall of the or-der of 30–35 mm. There are large variations in the simu-lated rainfall associated with the thunderstorm. All the MP schemes simulate appreciable rainfall above 12.5◦N and
be-tween 77.5◦and 79.0◦E. There is little rain simulated east of
79◦E. However, the magnitudes of simulated rainfall varied
from one MP scheme to another. Thompson scheme simu-lates rainfall amounts of the order of 30 mm, which is rea-sonably in agreement with the observations. However, other schemes simulate rainfall amounts exceeding 50 mm over a larger area. In spite of weaker updraft and downdraft cores, Lin scheme simulated higher amounts of rainfall. However, over Gadanki, the MP schemes simulated rainfall not more than 1.5 mm, while the observed rainfall was 21 mm. These large differences in simulated rainfall could be due to the dif-ferences in simulated hydrometeors simulated in the model. This aspect will be further discussed in Sect. 3.4.
M. Rajeevan et al.: Sensitivity of WRF cloud microphysics to simulations of a severe thunderstorm event 611
(a) (b)
[image:9.595.50.548.80.653.2](c) (d)
Fig. 6. Model simulated (inner most domain) vertical velocity (m s−1)over Gadanki with (a) Thompson, (b) Lin, (c) WSM6, and (d)
612 M. Rajeevan et al.: Sensitivity of WRF cloud microphysics to simulations of a severe thunderstorm event
(a) (b)
[image:10.595.53.548.62.492.2](c) (d)
Fig. 7. Latitude-Time plot showing northward propagation of vertical velocity (m s−1)at 2.7 km simulated by the model with four different
MP schemes. (a) Thompson, (b) Lin, (c) WSM6, and (d) Morrison.
model (Fig. 6), which in turn depends upon the parameteri-zation of evaporation of precipitation.
3.4 Simulation of vertical profile of reflectivity and hydrometeors
The analysis of model simulations showed that during the passage of the thunderstorm, atmospheric water vapour was pumped up to higher levels by convection, especially in the 4–7 km layer (Fig. 10). In the same diagram, drying up the lower atmospheric layer due to downdrafts associated with the thunderstorm is also clearly seen. Therefore large in-crease in hydrometeors and thus reflectivity can be expected to occur in the mid-troposphere. Figure 11 shows the
M. Rajeevan et al.: Sensitivity of WRF cloud microphysics to simulations of a severe thunderstorm event 613
(a) (b)
[image:11.595.53.548.70.621.2](c) (d)
Fig. 8. Accumulated 24 h rainfall at 00:00 UTC on 22 May 2008 simulated by the model with four different MP schemes (a) Thompson, (b) Lin, (c) WSM6, and (d) Morrison.
right from 1 km to 5 km, the simulated profiles showed max-imum reflectivity in the layer between 3–6 km. Zipser and Lutz (1994) used radar reflectivity data from central US,
614 M. Rajeevan et al.: Sensitivity of WRF cloud microphysics to simulations of a severe thunderstorm event
(a) (b)
[image:12.595.51.547.65.510.2](c) (d)
Fig. 9. Surface wind direction (black) and speed (m s−1)(red) at Gadanki simulated by the model with four different MP Schemes (a)
Thomp-son, (b) Lin, (c) WSM6, and (d) Morrison.
gradual decrease in reflectivity with height above the freezing level. There is no study in India, analyzing vertical profiles of radar reflectivity of many cases of convective storms. The peak in the simulated reflectivity near the 5 km level could be due to the presence of maximum hydrometeors at this level. This aspect is discussed below.
Figure 12 shows the area averaged and time averaged vertical profiles of hydrometeors simulated by the four MP schemes. There are large differences in the vertical profile of hydrometeors. The largest differences are noticed in the rain water and graupel simulations. The Thompson scheme simulates less cloud and rain water compared to the Lin and
M. Rajeevan et al.: Sensitivity of WRF cloud microphysics to simulations of a severe thunderstorm event 615
Fig. 10. Temporal evolution of atmospheric water vapour (g Kg−1)
over Gadanki associated with the thunderstorm on 21 May. The simulations are with the Thompson microphysical scheme.
4 Conclusions
In the present study, we made cloud-resolving simulations of a severe thunderstorm observed over Gadanki (India) on 21 May 2008, using a high resolution WRF model with 2 km grid spacing. The present study was taken up to examine whether the WRF model is able to simulate the main fea-tures of the thunderstorm and to examine its sensitivity to different microphysical schemes. To examine the sensitivity of the simulations to different cloud microphysics, four dif-ferent microphysical schemes (Thompson, WSM6, Lin and Morrison) were considered. The model was able to simu-late many features of the thunderstorm, but with some dif-ferences. First of all, convection was initiated in the model, almost an hour earlier than observed. However, all the sim-ulations correctly suggested passage of two convective cores over Gadanki, as observed by the MST and Doppler Weather radars. The study showed large variations among the four MP schemes. Significant variations are observed in the sim-ulations of updraft/downdraft cores, surface rainfall and hy-drometeor profiles. Model simulated updraft and downdrafts were weaker than observed and also constrained below about 10 km. Among the four schemes considered, the Thompson scheme simulations were closer to observations. In spite of more sophistication, the Morrison scheme, which is a double moment scheme with 10 variables did not perform better.
The present study has some caveats. The present results are derived from the simulation of a single convective event. We propose to do simulations for more number of convective storms observed over Gadanki with cloud resolving resolu-tions (of the order of 2 km) to generalize the results obtained in this study, even though the computational cost is large.
Similarly, instead of three nested domains, one single cloud-resolving domain may be preferred in order to avoid influ-ence of convection parameterization in the outer domains. Nevertheless, the present study has brought out the problems associated with the simulation of features associated with thunderstorms and its sensitivity to different microphysical schemes. It is important to understand the physical causes why the MP schemes had difficulty in simulating correctly the strength and vertical extend of convective updrafts and downdrafts associated with the thunderstorm. It is interest-ing to note that the Morrison scheme is a double moment scheme, in which the number concentration of hydrometeors is treated explicitly in addition to mixing ratios. There are large differences in the simulations of graupel. We have not understood whether inclusion of graupel is crucial in simu-lating the characteristics of convective clouds. The Thomp-son scheme, which did reaThomp-sonably well in simulating the up-drafts, is in fact designed to improve the mid-latitude winter precipitation. Modeling of the ice phase remains particularly uncertain (Morrison et al., 2009) due to several assumptions inherent in the representation of the ice particle size spec-trum and bulk density. Another important aspect is lack of microphysical data representing tropical conditions, which can be used to parameterize the cloud microphysics. All these points highlight the importance of field experiments and measurements, which may help reduce uncertainty in these parameters that vary widely depending upon local con-ditions. The model simulations also may be sensitive to the BMJ cumulus parameterization scheme used in the outer do-mains. More studies are required to examine the sensitivity of cumulus schemes used in the outer domains on the simu-lation of observed features of the thunderstorm event.
616 M. Rajeevan et al.: Sensitivity of WRF cloud microphysics to simulations of a severe thunderstorm event
(a) (b)
[image:14.595.50.544.59.524.2](c) (d)
Fig. 11. Vertical profile of reflectivity (dbz) at Gadanki simulated by the model with four different MP Schemes (a) Thompson, (b) Lin, (c) WSM6, and (d) Morrison.
by very high precipitation rates. Another uncertainty in sim-ulating the convection and its triggering mechanism is land use heterogeneity. Pielke Sr. (2001) demonstrated that land use changes can affect the deep cumulonimbus convection. The spatial structure of the surface heating, as influenced by landscape patterning, produces focused regions for deep cu-mulonimbus convection. In the tropics, deep cumulus con-vection had apparently been significantly altered as a result of landscape changes. Changes in land surface properties are shown to influence the heat and moisture fluxes within the planetary boundary layer and CAPE. The model simulations
M. Rajeevan et al.: Sensitivity of WRF cloud microphysics to simulations of a severe thunderstorm event 617
(a) (b)
[image:15.595.106.504.60.520.2](c) (d)
Fig. 12. Vertical profiles of cloud condensate (Cloud water (red), rain water (black), cloud Graupel (Blue) and Cloud Ice (Green)) in g Kg−1
simulated by the model with four different MP schemes (a) Thompson, (b) Lin, (c) WSM6, and (d) Morrison.
All the above conclusions suggest a comprehensive ob-servational campaign to understand and better parameterize the atmospheric convection and cloud microphysics through measurements of aerosol, cloud properties, thermodynamic parameters and land use heterogeneity. This will require multi observational platforms from a simple rain gauge to complex polarimetric radars, aircrafts and satellites.
Acknowledgements. We are thankful to the Chairman, ISRO,
T. G. K. Murthy, A. Jayaraman and B. Manikiam for their kind encouragement and extending support to carry out this study. All
the model runs were made with the super computing facility at the Computational Research Laboratory (CRL), Tata Sons, Pune, In-dia (www.crlinIn-dia.com). We are thankful to CRL for providing the computing facility. We also thank Jyoti Bhate and Debashis Nath for their technical support. We are also thankful to two anonymous reviewers for their constructive comments and suggestions to im-prove the quality of the paper.
618 M. Rajeevan et al.: Sensitivity of WRF cloud microphysics to simulations of a severe thunderstorm event
References
Chen, S. H. and Sun, W. Y.: A one dimensional time-dependent cloud model, J. Meteorol. Soc. Japan, 80, 99–118, 2002. Done, J., Davis, C. A., and Weisman, M.: The next generation
of NWP: Explicit forecasts of convection using the weather re-search and forecasting (WRF) model, Atmos. Sci. Lett., 5, 110– 117, 2004.
Dudhia, J.: Numerical study of convection observed during the winter monsoon experiment using a mesoscale two-dimensional model, J. Atmos. Sci., 46, 3077–3107, 1989.
Gilmore, M. S., Straka, S. M., and Rasmussen, E. N.: Precipitation and evolution sensitivity in simulated deep convective storms: comparisons between liquid-only and simple ice and liquid phase microphysics, Mon. Weather Rev., 132, 1897–1916, 2004. Hong, S. Y., Dudhia, J., and Chen, S. H.: A revised approach to ice
microphysical processes for the bulk parameterization of clouds and precipitation, Mon. Weather Rev., 132, 103–120, 2004. Houze Jr., R. A.: Mesoscale Convective Systems, Rev. Geophys.,
42, 1–43, doi:10.1029/2004RG000150, 2004.
Houze Jr., R. A.: Cloud Dynamics, 573 pp, Academic, San Diego, California, 1993.
Jagannadha Rao, V. V. M., Narayana Rao, D., Ratnam, M. V., Mo-han, K., and Vijaya Bhaskara Rao, S.: Mean vertical velocities measured by Indian MST radar and comparison with indirectly computed values, J. Appl. Meteorol., 42, 541–552, 2003. Kain, J. S., Weiss, S. J., Levit, J. J., Baldwin, M. E., and Bright,
D. R.: Examination of convection-allowing configurations of the WRF model for the prediction of severe convective weather: The SPC/NSSL spring program 2004, Wea. Forecasting, 21, 167– 181, 2006.
Kain, J. S., Weiss, S. J., Bright, D. R., et al.: Some practical con-siderations regarding horizontal resolution in the first generation of operational convection-allowing NWP, Wea. Forecasting, 23, 931–952, 2008.
Khain, A., Rosenfeld, D., and Pokrovsky, A.: Aerosol impact on the dynamics and microphysics of deep convective clouds, Q. J. Roy. Meteorol. Soc., 131, 2639–2663, 2005.
Lean, H. W., Clark, P. A., Dixon, M., Roberts, N. M., Fitch, A., Forbes, R., and Halliwell, C.: Characteristics of High-resolution versions of the Met Office Unified Model for forecasting convec-tion over the United Kingdom., Mon. Weather Rev., 136, 3408– 3424, 2008.
Lin, Y. L., Farley, R., and Orville, H. D.: Bulk parameterization of the snow field in a cloud model, J. Climate Appl. Meteor., 22, 1065–1092, 1983.
Litta, A. J. and Mohanty, U. C.: Simulation of a severe thunder-storm event during the field experiment of STORM programme 2006, using WRF-NMM model, Current Sci., 95, 204–214, 2008.
Liu, C. and Moncrieff, M. W.: Sensitivity of cloud-resolving simu-lations of warm-season convection to cloud microphysics param-eterizations, Mon. Weather Rev., 135, 2854–2868, 2007. Liu, C. H., Moncrieff, M. W., Tuttle, J. D., and Carbone, R. E.:
Ex-plicit and parameterized episodes of warm-season precipitation over the continental United States, Adv. Atmos. Sci., 23, 91–105, 2006.
McCumber, M., Tao, W. K., Simspon, J., Penc, R., and Soong, S. T.: Comparison of ice-phase microphysical parameterization schemes using numerical simulations of tropical convection, J.
Appl. Meteorol., 30, 985–1004, 1991.
Mlawer, E. J., Taubman, S. J., Brown, P. D., Iacano, M. J., and Clough, S. A.: Radiative transfer for inhomogeneous atmo-sphere: RRTM, a validate correlated-k model for the longwave, J. Geophys. Res, 102, 16663–16682, 1997.
Moncrieff, M. W. and Liu, C. H.: Representing convective organi-zation in prediction models by a hybrid strategy, J. Atmos. Sci., 63, 3404–3420, 2006.
Mukhopadhyay, P., Sanjay, J., Cotton, W. R., and Singh, S. S.: Im-pact of surface meteorological observations on RAMS forecast of monsoon weather systems over Indian region, Meteorol. At-mos. Phys., 90, 77–108, 2005.
Morrison, H., Thompson, G., and Tatarskii, V.: Impact of cloud mi-crophysics on the development of trailing stratiform precipitation in a simulated squall line: Comparison of one and two-moment schemes, Mon. Weather Rev., 137, 991–1006, 2009.
Petersen, W. A. and Rutledge, S. A.: Regional variability in tropical convection: Observations from TRMM, J. Climate, 14, 3566– 3586, 2001.
Pielke Sr., R. A.: Influence of the Spatial Distribution of Vegetation and Soils on the Prediction of Cumulus Convective Rainfall, Rev. Geophys., 39(2), 151–177, 2001.
Rajeevan, M. and Jyoti Bhate: A high resolution daily gridded rain-fall dataset (1971–2005) for mesoscale meteorological studies, Current Sci., 96, 558–562, 2009.
Rao, P. B., Jain, A. R., Kishore, P., Balamuralidhar, P., Damle, S. H., and Viswanathan, G.: Indian MST Radar I. System description and sample vector win measurements in ST mode, Radio Sci., 30, 1125–1138, 1995.
Rao, P. V., Vinay Kumar, P., Ajay Kumar, M. C., and Dutta, G.: Long-term mean vertical velocity measured by MST radar at
Gadanki (13.5◦N, 79.2◦E), Ann. Geophys., 27, 451–459, 2009,
http://www.ann-geophys.net/27/451/2009/.
Reisner, J., Rasmussen, R. J., and Bruintjes, R. T.: Explicit forecast-ing of super cooled liquid water in winter storms usforecast-ing the MM5 Mesoscale model, Q. J. Roy. Meteorol. Soc., 124B, 1971–1107, 1998.
Rutledge, S. A. and Hobbs, P. V.: The mesoscale and microscale structure and organization of clouds and precipitation in midlati-tude cyclones XII: A diagnostic modeling study of precipitation development in narrow clod-frontal rainbands, J. Atmos. Sci., 41, 2949–2972, 1984.
Speer, M. S. and Leslie, L. M.: The prediction of two cases of severe convection: implications for forecast guidance, Meteor. Atmos. Phys., 80, 1–4, 2002.
Thompson, G., Rasmussen, R. M., and Manning, K.: Explicit forecasts of winter precipitation using an improve bulk mi-crophysics scheme. Part-I: Description and sensitivity analysis, Mon. Weather Rev., 132, 519–542, 2004.
Trier, S. B., Davis, C. A., Ahijevych, D. A., Weisman, M. L., and Bryan, G. H.: Mechanisms supporting long-lived episodes of propagating nocturnal convection within a 7-day WRF model simulation, J. Atmos. Sci., 63, 2437–2461, 2006.
Uma, K. N. and Narayana Rao, T.: Characteristics of vertical veloc-ity cores in different convective systems observed over Gadanki, India., Mon. Weather Rev., 137, 953–977, 2009.
M. Rajeevan et al.: Sensitivity of WRF cloud microphysics to simulations of a severe thunderstorm event 619
Weisman, M. L., Skamarock, W. C., and Kemp, J. B.: The resolu-tion dependence of explicitly modeled convective systems, Mon. Weather Rev., 125, 527–548, 1997.
Wu, J., Del Genio, A. D., Yao, M. S., and Wolf, A. B.: WRF and GISS SCM simulations of convective updraft prop-erties during TWP-ICE, J. Geophys. Res., 114, D04206, doi:10.1029.2208JD010851, 2009.
Xu, K. M. and Randall, D. A.: Updraft and downdraft statistics of simulated tropical and midlatitude cumulus convection, J. At-mos. Sci., 58, 1630–1649, 2001.
Zipser, E. J., Cecil, D. J., Liu, C., Nesbitt, S. W., and Korty, D. P.: Where are the most intense thunderstorms on Earth?, B. Am. Meteorol. Soc., 87, 1057–1071, 2006.