Biogeosciences, 10, 6469–6484, 2013 www.biogeosciences.net/10/6469/2013/ doi:10.5194/bg-10-6469-2013
© Author(s) 2013. CC Attribution 3.0 License.
Biogeosciences
Open Access
Fluxes of particulate organic carbon in the East China Sea in
summer
C.-C. Hung1,2, C.-W. Tseng3, G.-C. Gong2,3, K.-S. Chen1, M.-H. Chen1, and S.-C. Hsu4
1Department of Oceanography, and Asia-Pacific Ocean Research Center, National Sun Yat-sen University, Kaohsiung 804,
Taiwan
2Taiwan Ocean Research Institute, National Applied Research Laboratories, Kaohsiung 852, Taiwan
3Institute of Marine Environmental Chemistry and Ecology, and Center of Excellence for the Oceans, National Taiwan Ocean
University, Keelung 202, Taiwan
4Research Center for Environmental Changes, Academia Sinica, Taipei 115, Taiwan
Correspondence to: C.-C. Hung (cchung@mail.nsysu.edu.tw)
Received: 27 December 2012 – Published in Biogeosciences Discuss.: 5 March 2013 Revised: 28 August 2013 – Accepted: 2 September 2013 – Published: 11 October 2013
Abstract. To understand carbon cycling in marginal seas
bet-ter, particulate organic carbon (POC) concentrations, POC fluxes and primary production (PP) were measured in the East China Sea (ECS) in summer 2007. Higher concen-trations of POC were observed in the inner shelf, and lower POC values were found in the outer shelf. Similar to POC concentrations, elevated uncorrected POC fluxes (720–7300 mg C m−2d−1)were found in the inner shelf, and lower POC fluxes (80–150 mg C m−2d−1)were in the outer shelf, respectively. PP values (∼340–3380 mg C m−2d−1) had analogous distribution patterns to POC fluxes, while some of PP values were significantly lower than POC fluxes, suggesting that contributions of resuspended particles to POC fluxes need to be appropriately corrected. A vertical mixing model was used to correct effects of bottom sed-iment resuspension, and the lowest and highest corrected POC fluxes were in the outer shelf (58±33 mg C m−2d−1) and the inner shelf (785±438 mg C m−2d−1), respectively. The corrected POC fluxes (486 to 785 mg C m−2d−1)in the inner shelf could be the minimum value because we could not exactly distinguish the effect of POC flux from Changjiang influence with turbid waters. The results suggest that 27– 93 % of the POC flux in the ECS might be from the contri-bution of resuspension of bottom sediments rather than from the actual biogenic carbon sinking flux. While the vertical mixing model is not a perfect model to solve sediment resus-pension because it ignores biological degradation of sinking particles, Changjiang plume (or terrestrial) inputs and lateral
transport, it makes significant progress in both correcting the resuspension problem and in assessing a reasonable quanti-tative estimate of POC flux in a marginal sea.
1 Introduction
Continental margins only account for 8 % of the surface area of the ocean, but they contribute approximately 30 % of global primary production (Liu et al., 2000). Walsh (1989) proposed that continental shelf regimes were an important or-ganic carbon source to the open ocean because marginal seas have elevated phytoplankton primary production and higher particulate organic carbon (POC) inventories as compared to those in the open ocean. Thus, marginal seas are believed to influence marine carbon biogeochemical cycling and fishery crucially (Liu et al., 2010, and references therein; Chou et al., 2009a, b, 2011; Gong et al., 2011). Indeed, one of the major objectives of the international research project Land-Ocean Interaction in the Coastal Zone (LOICZ) is to quantify the exchange of carbon between continental shelves, marginal seas, and the open ocean.
6470 C.-C. Hung et al.: Fluxes of particle organic carbon in the East China Sea in summer
on measurements of CO2air–sea exchange (Tsunogai et al.,
1999; Peng et al., 1999; Wang et al., 2000; Shim et al., 2007; Chou et al., 2013). Model-estimated organic carbon burial on the broad ECS shelf was 7–10 Mt C yr−1 (Chen and Wang, 1999), and the estimated burial organic carbon transported offshore was from 2 to 12 Mt C yr−1(Liu et al., 2006, 2010). While these estimations show large uncertainties, the net im-balance of organic carbon fluxes in the ECS amounts to ap-proximately 10–20 Mt C yr−1. Although fluxes of particles and POC have been estimated in the ECS and adjacent ar-eas (Hung et al., 1999, 2003; Hoshika et al., 2003; Oguri et al., 2003; Iseki et al., 2003; Guo and Zhang, 2005; Zhu et al., 2006; Hung and Gong, 2011), direct measurements of POC fluxes in the ECS coastal region are very limited (Iseki et al., 2003; Guo et al., 2010).
There is no simple means to estimate POC fluxes in the marginal seas due to strong sediment resuspension, lateral transport or dense shelf water cascading, although several methods (carbon budget, vertical flux and box model) have been used (Smith and Hollibaugh, 1993; Falkowski et al., 1994; Oguri et al., 2003; Hoshika et al., 2003). Most im-portantly, recent studies have shown that POC fluxes (mea-sured by moored sediment traps, 300–5000 mg C m−2d−1, Iseki et al., 2003) were sometimes higher than PP in the ECS (500–2500 mg C m−2d−1, Gong et al., 2003, 2006; Liu et al., 2010). Iseki et al. (2003) suggested that elevated POC fluxes could be downslope transport of resuspended parti-cles. As mentioned above, the ECS has the highest PP during the summer (Gong et al., 2003, 2006). Therefore, possible factors resulting in POC fluxes being higher than PP could be sediment resuspension, fluvial particles or lateral trans-port because dense shelf water cascading (mainly happens in winter) in summer is unlikely in this case. To exclude resus-pended POC of the sediments better in the marginal seas, we measured POC concentrations and fluxes and used a vertical end-member mixing model to calibrate the POC flux appro-priately. Additionally, we also measured PP to constrain the corrected POC flux in the ECS
2 Sampling and analytical methods
Seawater samples (32 stations) were collected aboard the R/V Ocean Researcher I in the ECS from 1 to 11 July 2007 (Fig. 1). Temperature was recorded using a SeaBird model SBE9/11 plus conductivity–temperature–depth (CTD) recorder, and salinity was determined with an Autosal sali-nometer. Transmissometer (C-Star, Wet Lab, USA) data (TM %) were recorded by the transmissometer attached to the CTD. Seawater samples were collected using 20 L X-Niskin bottles (General Oceanic Inc. USA) from different depths (2, 5, 10, 15, 20, 25, 30, 40, 50, 60, 70, 90, 110, 150 m) for measurements of chlorophyll a (Chla)and POC con-centrations. The Chla samples were collected by filtering 1180 mL of seawater at inner shelf and 2030 mL for other
54 Fig. 1
969
970 971 972 973 974 975 976
Fig. 1. Sampling locations (black dots) and hydrography in the East China Sea. The dashed band with red arrows represents the main stream of the Kuroshio Current, and the pink arrows represent the Taiwan Warm Current in summer. Red circles indicate the sur-face sediment stations and the sediment trap deployment stations in summer 2007. CDW: Changjiang diluted water, YSW: Yellow Sea water, CUW: coastal upwelling water, TCWW: Taiwan Current warm water, UW: Kuroshio upwelling water, KW: Kuroshio water, SMW: shelf mixing water (mixing of a major CDW and a minor of CUW+YSW+TCWW), after Liu et al. (2000), Kao et al. (2003), and Chou et al. (2009a, b).
stations through a GF/F filter (pore size=0.7 µm) and stored at−20◦C until analysis. Top surface sediment samples (0– 2 cm) at sediment trap stations (e.g., stations S18, S19, S28, S29, S5, S10, and S26) were collected using a box-core sam-pler (Fig. 1). The sediment samples were then transferred to the laboratory and frozen (−20◦C) until analysis. Briefly, freeze-dried sediment sub-samples were first heated at 60◦C and treated (2–3 treatments) with 2 N HCl to remove in-organic carbon. POC concentrations were determined using an elemental analyzer (Elementa, Germany) (Hung et al., 2009a).
C.-C. Hung et al.: Fluxes of particle organic carbon in the East China Sea in summer 6471
Table 1. Parameters of bottom depth, euphotic zone (EZ) depth, uncorrected POC flux, and primary production (PP) in the ECS.
Water Station Bottom depth EZ Trap depth Uncorr. POC flux PP mass (m) (m) (m) (mg C m−2d−1) (mg C m−2d−1)
CDW S18 47 15 20 3900 1897
CDW S19 38 22 20 7300 3045
SMW S28 60 50 30 200 600
CDW S29 57 26 20 750 3377
CUW S5 51 36 20 720 337
KW S10 154 90 120 80 1153
KW S26 118 74 100 150 442
as estimated from duplicate measurements. A few of TSM values in the outer shelf were derived according to the rela-tionship between TSM and TM % due to possible salt effect. After measuring TSM concentrations, these GF/F filters were used to determine POC concentrations (Hung et al., 2010a, 2011). Sinking particles (7 stations) were collected at 20 m (S18, S19, S29, S5) (inner shelf region), 30 m (S28) (middle shelf region), 100 m (S26) and 120 m (S10) (outer shelf region) (Fig. 1 and Table 1) by a drifting sediment trap array, which consisted of six 6.8 cm diameter cylindrical plastic core tubes with honeycomb baffles covering the trap mouths (Santschi et al., 2003; Hung et al., 2009a, 2010b). The array was attached to an electric surface buoy with a global positioning system (GPS) antenna (TGB-500, TAIYO, Japan). The trap tubes, filled with filtered seawater (sparkling clear polypropylene filter, nominal size 0.5 µm), were de-ployed for short-scale deployment (3–8 h) due to intensive fishery activity. Sinking particles were filtered through pre-combusted (500◦C, 6 h) quartz filters (Whatman QMA, pore size=1.0 µm). The swimmers caught on the filters were ob-served using a microscope and carefully removed using for-ceps. In brief, carbonate carbon on the filter was fumed overnight by concentrated HCl in a vacuum desiccator and then dried at 50◦C in an oven. POC concentrations in both suspended and sinking particles were measured using an el-emental analyzer after filters were HCl-fumed.
The precision in the determination of POC is approxi-mately ±2 % at 20 µg C L−1. The detection limit of POC
is 5 µg C L−1. Selected samples contained two quartz filters; the second was treated as a POC blank ranging from 0.8 to 2.0 µmol per 25mm quartz filter. The POC flux was extrapo-lated to 24 h (=1 day) on the assumption that the POC flux at night was the same as that during the day. We thus feel confident that diurnal variability in POC fluxes, if it exists, is small compared to other sources of error in our measure-ments. Trapping efficiency of the floating sediment traps in the ECS and the oligotrophic water, based on the234Th /238U disequilibrium model of Hung et al. (2004), ranged between 75 % (Li, 2009) and 80 % (Hung and Gong, 2007), respec-tively. Concentrations of rare earth elements in the sinking particles were processed by the total digestion method
us-ing mixed acids of Suprapur HF, HNO3and HClO4(all from
Merck, Germany) and measured by the quadrupole-based in-ductively coupled plasma mass spectrometer (ICP-MS, Elan 6100, Perkin-Elmer Instruments, USA). The detailed proce-dure has been given elsewhere (Hsu and Lin, 2010).
Primary production (PP) was determined by the 14C assimilation method (Parsons et al., 1984; Hung et al., 2000; Gong et al., 2003). Briefly, water samples for the PP measurements were pre-screened through a 200 µm mesh and dispensed into acid-cleaned polycarbonate carboy (10 L, Nalgene). Each subsample was inoculated with 10 µCi NaH14CO3 before incubation. The PB-E
(photosynthetic-irradiance) curve at each sampling depth was determined us-ing a seawater-cooled incubator illuminated for two hours with artificial light. PP at each depth could then be calcu-lated with the parameters from the PB-E curve. The euphotic zone integrated primary production (IP) was calculated us-ing a trapezoid rule. The detailed procedures can be found in Gong et al. (2003).
3 Results
3.1 Hydrographic settings and distributions of Chla, POC and TSM in the ECS
6472 C.-C. Hung et al.: Fluxes of particle organic carbon in the East China Sea in summer
Fig. 2. Contours of surface temperature (A), salinity (B), chlorophyll (Chla)concentration (C) and POC concentration (D) in the East China Sea in summer 2007, respectively.
boundary between CDW and CUW. This distribution of wa-ter types is generally consistent with the known summer cir-culation pattern in the ECS (Fig. 1) (Lee and Chao, 2003).
The surface distributions of temperature, salinity, Chl a concentration and POC concentrations in the ECS in July 2007 are shown in Fig. 2a–d. Sea surface temperatures (SST) at all stations were above 23◦C with lower SST in the coastal and inner shelf regions and higher SST in the outer shelf (Fig. 2a). Surface salinity gradually increased from the coastal area toward the shelf edge (Fig. 2b). Dis-tributions of surface Chlaconcentrations ranged from 0.3 to 8.9 mg m−3. Chlaconcentrations in the outer shelf were low and increased moving landward towards the Chinese coast and the Changjiang Estuary (Fig. 2c), becoming the highest (>5 mg m−3)in the Changjiang diluted water (CDW). The higher Chl a was supported by nutrient-rich water (Gong et al., 2006; Hung et al., 2010b). Distributions of surface POC concentrations varied between 40 and 450 µg L−1in the ECS. High concentrations (200–450 µg L−1) of POC were observed in coastal surface waters (e.g., CDW, S19, S19A, S29 and S18), followed by the middle shelf (80–160 µg L−1), and generally decreased towards the shelf, with the lowest values (40–70 µg L−1)found in the outer shelf (Fig. 2d) with the exception high POC values (72–140 µg L−1)in the south-ern ECS (e.g., stations 1 and 2A).
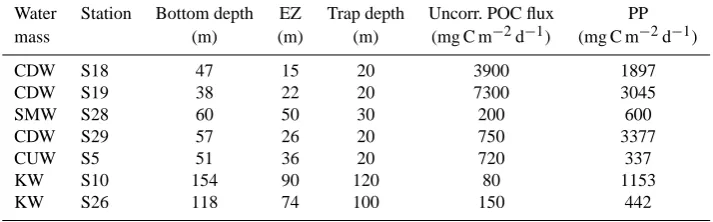
Vertical distributions of Chla, POC and TSM concentra-tions in the inner and middle shelves (e.g., S18, S19, S29,
S5, S28) and outer shelf (e.g., S10 and S26) are shown in Fig. 3a–f, respectively. In the inner shelf (e.g., stations 18, 19 and 29), elevated Chla concentrations (2–5 mg m−3)were apparent in the surface layer. In contrast to the high Chla concentration in the inner shelf (e.g., stations 10 and 26), the outer shelf had low phytoplankton biomass (surface Chla concentration<0.4 mg m−3)(Fig. 3a and b). An interesting feature is that at stations 5, 10, 26 and 28, maximum Chla concentrations were always observed above the depth of the euphotic zone (Table 1) and decreased with increasing depth. Elevated POC concentrations were generally observed near surface or subsurface waters and decreased with water depth at most stations in the inner and middle shelves (Fig. 3c and d).
3.2 Relationships between POC and Chla (TSM) and
C / N ratios in the ECS
C.-C. Hung et al.: Fluxes of particle organic carbon in the East China Sea in summer 6473
Fig. 3. Distributions of vertical Chla(A and B), POC concentra-tions (C and D) and total suspended matter (TSM) concentraconcentra-tions (E and F) in the inner shelf (S18, S19, S29, S5, and S28) and the outer shelf (S10 and S26) of the East China Sea. The different color lines indicate the depths of the euphotic zone at stations (S18, S19, S29, S5, S28, S26 and S10).
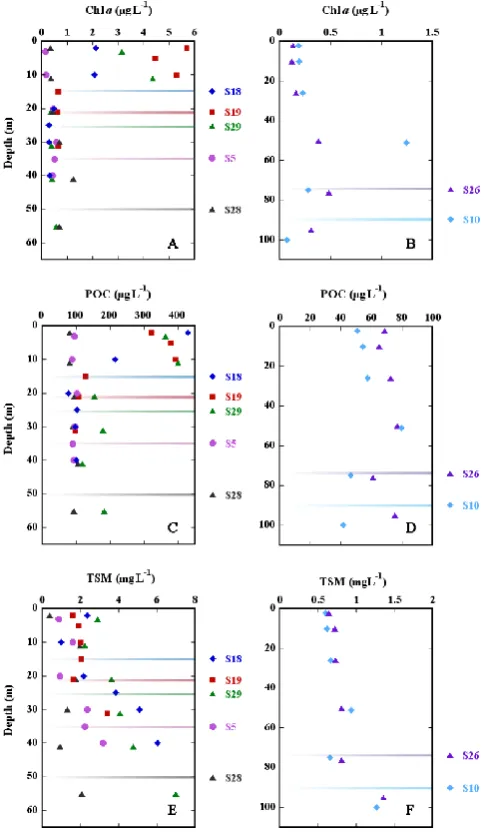
positive relationship (POC / TSM=0.74 µmol mg−1) be-tween POC and TSM in the inner shelf of the ECS in Oc-tober and November, but they did not find a good relation-ship between POC and TSM in the middle shelf. Moreover, a significant correlation between POC and particulate nitrogen (PN) was obtained, as shown in Fig. 4c, where the slope is approximately 5.9, close to Redfield ratios suggesting a ma-rine biogenic source of the particles. Figure 4d shows a good relationship (some data away from the correlation line) be-tween POC / TSM and the reciprocal of TSM suggesting that the constituents of TSM are a mixture of two end-members:
one consisting of high POC content and low TSM, and the other consisting of low POC content and high TSM.
3.3 Spatial variation of uncorrected POC fluxes and PP
in the ECS
Uncorrected elevated POC fluxes (720–7300 mg C m−2d−1) during the summer found in the inner shelf (trap depths about 18–27 m above the bottom) stations S5, S18, S19, and S29 were 720, 3900, 7300 and 750 mg C m−2d−1, re-spectively. Uncorrected high POC flux in the inner shelf gradually decreased towards the middle shelf station S28 (trap depth about 30 m above the bottom) approximately 200 mg C m−2d−1, and then the outer shelf stations S10 (80 mg C m−2d−1) and S26 (150 mg C m−2d−1)(trap depth about 18–34 m about the bottom), respectively (Table 1). Iseki et al. (2003) reported that seasonal POC fluxes (100–3000 mg C m−2d−1) in the inner shelf (e.g., station PN 12, marked in Fig. 1) of the ECS with the highest value oc-curring in the bottom turbid layer (∼5 to 30 m above the bottom) in winter (February to March) and fall (October), and the lowest value in spring. However, Iseki et al. (2003) did not have summer POC flux data in the inner shelf of the ECS. Iseki et al. (2003) also found that high POC fluxes (∼50–4000 mg C m−2d−1)appear at the bottom turbid layer in the middle (e.g., station PN8, the moored trap depths were approximately 5 to 40 m above the bottom, Fig. 1) shelf of the ECS with the highest POC flux in summer (August). In the outer shelf (e.g., station PN5, the moored trap depths were approximately 5 to 80 m above the bottom, Fig. 1), the POC flux ranged from∼30 to∼1100 mg C m−2d−1 with the highest value in winter and fall (Iseki et al., 2003). In comparison, the uncorrected POC flux in the middle shelf in summer is much lower than the value reported by Iseki et al. (2003). However, the uncorrected POC flux in the outer shelf in summer is similar to the value reported by Iseki et al. (2003).
6474 C.-C. Hung et al.: Fluxes of particle organic carbon in the East China Sea in summer
57 Fig. 4
994
995 996 997 998
Fig. 4. Relationships between POC and Chla(A); POC and TSM (B); POC and PN (C); POC / TSM and 1/TSM (D) in the ECS.
possible influences from resuspended particulate matter from the surface sediments.
3.4 Using a vertical particle mixing model to correct POC flux
As mentioned above, some of uncorrected POC fluxes were much higher than those of primary production, suggesting that bottom sediment resuspension could be likely associated with the elevated POC fluxes in the ECS. First, we used a ver-tical particle mixing model derived by Morris et al. (1987) to obtain two end-member values: one with high POC con-tent and low total suspended matter (TSM), and the other with low POC content and high TSM (Bloesch, 1994). The two end-member mixing model is shown in Eq. (1) (Bale and Morris, 1998).
C=(So(Co−Cs))/S+Cs, (1)
whereC is the observed POC concentration (%) in the mix-ture,Sothe total weight of surface phytoplankton (mg L−1),
Sthe total weight of observed suspended particles (mg L−1), Cothe POC concentration of phytoplankton (%), andCsthe
POC concentration of surface sediment (%). The data ofCs
andCocan be obtained according to the observed parameters
C andS by plotting suspended POC concentrations against the reciprocal of observed suspended particle concentration, TSM (Fig. 5). It is noted that SMW (shelf mixing water) was composed of CDW (major) and YSW+TCWW (minor) so that we used the values of the slope obtained for CDW at station 28.
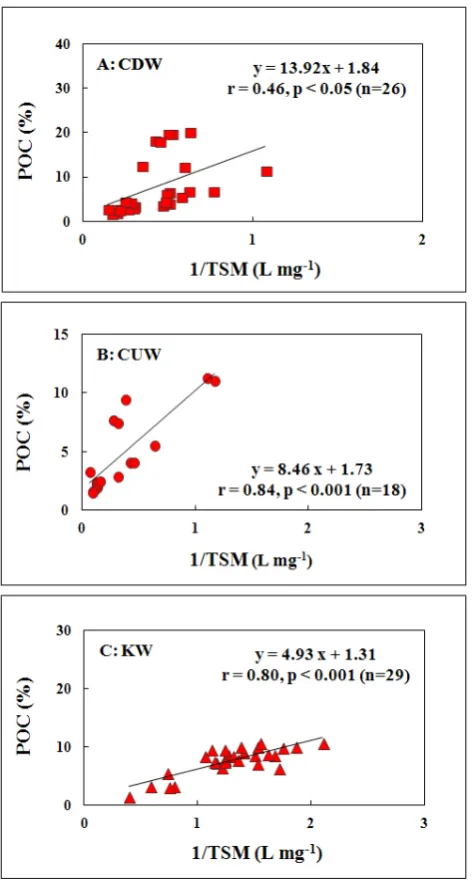
Linear relationships between POC and TSM in the CDW, CUW and KW all show significant correlations with low p values (<0.001, Fig. 5), suggesting that POC content is mainly controlled by the mixing of two end-members, thus attesting to the utility of this mixing model (Morris et al., 1987; Bale and Morris, 1998). The slope in Fig. 5 is equal to So (Co−Cs), and the intercept on the y axis
(Cs) estimates a value for the POC value of the
resus-pended particles. The estimated POC concentrations in the surface sediments (Cs) ranged from 1.3 to 1.8 % (Table 2).
The measured POC values in the surface sediments in the ECS in this study ranged from 0.20 to 0.54 % (an average value=0.34±0.14 %). Because the derived values ofCs in
the CDW are much higher than published data (Table 2), herein the averageCsvalues (data from previous studies and
this study; see Table 2) are used to represent the POC con-tent of the surface sediments rather than using the derived Cs values. With the Cs data, we assume a reasonable
sur-face phytoplankton weight (So=0.5 mg L−1) to solve theCo
values. The statistical data of intercept and slope in differ-ent water masses (CDW, CUW and KW) are shown in Ta-ble 3. The predictedCo(phytoplankton POC concentration)
values in different water masses ranged from 9.9 to 28.3 %, which are in agreement with the published phytoplankton culture data (Thalassiosira weissflogii (POC=10.2–15.8 %); Skeletonema sp. (POC=10.7–14.8 %); Chaetoceros affinis (POC=8.1–16.8 %), Tseng, 2010). In comparison, both de-rivedCoandCsin the ECS are comparable to previously data
C.-C. Hung et al.: Fluxes of particle organic carbon in the East China Sea in summer 6475
58 Fig. 5
999
1000 1001 1002
Fig. 5. (A) Relationships between POC (%) and 1/TSM in the CDW of the ECS. (B) Relationship between POC (%) and 1/TSM in the CUW of the ECS. (C) Relationship between POC (%) and 1/TSM in the KW of the ECS.
a two end-member mixing model to describe particle mixing in the ECS seems to give reasonable results.
Secondly, with the two end-member values (Cs andCo),
we can use Eq. (2) (see below) reported by Bloesch (1994), to estimate the ratio of resuspended particles to total sinking particles in the ECS.
R/T =(Ct−Co)/(Cs−Co), (2)
[image:7.595.50.287.61.502.2]where R represents the fraction of resuspended particles (mg L−1, dry weight, dw) collected by a sediment trap,T the total entrapped sinking particles (mg L−1, dw) collected
Table 2. Organic content (Cs, %) in the surface sediments in the ECS.
Water Station Cs1 Cs2 Cs3 Cs4
mass (%)
CDW S18 1.8 0.19 0.67 0.54±0.03 CDW S19 1.8 0.66 0.19 0.42±0.20 SMW S28 1.8 0.38 0.29 0.25±0.03 CDW S29 1.8 0.27 0.28 0.22±0.02 CUW S5 1.7 0.45 0.88 0.49±0.03 KW S10 1.3 0.29 0.42 0.24±0.06 KW S26 1.3 0.28 0.23 0.20±0.09
1Model-estimated values,
2Sheu et al. (1995),
3Kao et al. (2003).
4This study (average±1 std,n=4).
by a sediment trap, andCt the organic fraction of observed
sinking particles (%). WithCt,Co, andCs, the ratio (R/T)
of resuspended particles to entrapped sinking particles can be estimated from Eq. (2). Consequently, the corrected POC flux can be calculated based on Eq. (3).
Corrected (Corr.) POC flux=uncorrected POC flux×(1−R/T )(3) The detailed data ofR/T, uncorrected and corrected POC fluxes are summarized in Table 4. The predicted R/T in trapped particles of the ECS ranged from approximately 27 % to 93 % with higher values in the inner shelf and lower values in the outer shelf, suggesting that sediment pension is a ubiquitous phenomenon in the ECS. If resus-pension results in the outer shelf (27–58 %) of the ECS in this study are excluded, the resuspension results (57–93 %) in this study seem to be similar to the estimated resuspen-sion ratios (70–94 %) in the inner and middle shelves of the Yellow Sea and the ECS (Guo et al., 2010). The cor-rected POC fluxes (58±33–63±36 mg C m−2d−1)in the outer and middle shelves gradually increased to 297±168– 785±438 mg C m−2d−1, which are all lower than the PP values (Table 5) in the ECS, revealing that appropriate cor-rections for constraining POC fluxes in marginal seas are necessary.
4 Discussion
4.1 Spatial POC variation, OC content in sediments and
possible POC flux impact in the ECS
[image:7.595.323.530.92.209.2]6476 C.-C. Hung et al.: Fluxes of particle organic carbon in the East China Sea in summer
Table 3. Statistical data of linear regressions of POC values versus the reciprocal of total suspended matter concentrations in the East China Sea. The unit ofCsandCois %.Co(max) andCo(min) represent the minimum and maximum derived POC concentrations of phytoplankton.
Water Station Slope (Cs) Co Co(max) Co(min) mass So(Co−Cs) (So=0.5) (So=0.25) (So=0.75)
CDW S18 13.9 0.54 28.3 56.1 19.1
CDW S19 13.9 0.42 27.9 55.7 18.7
SMW S28 13.9 0.25 28.0 55.8 18.8
CDW S29 13.9 0.22 28.0 55.8 18.7
CUW S5 8.5 0.49 13.3 26.1 9.0
KW S10 4.9 0.24 10.0 19.8 6.7
KW S26 4.9 0.20 9.9 19.7 6.6
Sois the total weight of surface phytoplankton (mg L−1).
Cois the POC concentration of phytoplankton (%).
Csis the OC concentration of surface sediment (%).
Table 4. Detailed values ofCt,R/T, uncorrected POC flux (Uncorr. POC flux) and corrected POC flux (Corr. POC flux±uncertainty) in the different areas of the ECS.
Water Station Ct R/T Uncorr. POC flux Corr. POC flux
mass (%) (%) (mg C m−2d−1) (mg C m−2d−1)
CDW S18 6.1 80 3900 785±438
CDW S19 2.0 93 7300 486±275
SMW S28 9.9 65 200 69±39
CDW S29 11.2 60 750 297±168
CUW S5 5.9 57 720 307±169
KW S10 7.3 27 80 58±33
KW S26 4.2 58 150 63±36
Rrepresents the fraction of resuspended particles (mg L−1, dry weight, dw) collected by a
sediment trap.
T: total entrapped sinking particles (mg L−1, dw) collected by a sediment trap.
Ct: organic fraction of observed sinking particles (%).
Note: the uncertainty of the calculated fluxes was based on the standard deviation of threeCo
values (Co,Co(min),Co(max)).
carbon : Chla values in the ECS with low values in the in-ner shelf and high values in the middle (or outer) shelves using the POC–Chla regression (inner POC / Chl a: mid-dle POC / Chla=13 : 93 g g−1)and phytoplankton cell vol-ume (inner POC / Chla: middle POC / Chla=18 : 67 g g−1). Chang et al. (2003) also suggested that carbon : Chla vari-ations are due to phytoplankton species difference and phy-toplankton cell abundance. For example, Skeletonema costa-tum and Synechococcus spp., Synechococcus spp. and Pseu-dosolenia calcar-avis, and Trichodesmium spp and nanoflag-ellates are the main phytoplankton groups contributing au-totrophic carbon in the inner (75 % of auau-totrophic carbon), middle (79 % of autotrophic carbon) and outer (80 % of au-totrophic carbon) shelves, respectively. Therefore, the insid-ers in the dotted circles in Fig. 4a, b and d could be the re-sults of different phytoplankton species composition and cell abundance.
Vertical profiles of POC were reflected in elevated Chla patterns in the inner shelf and outer shelf, while at stations 29 and 26, POC concentrations at the lower depths were higher
than at shallow depths, implying lateral transport or sediment resuspension at greater depth. Similarly, vertical profiles of TSM showed similar patterns as POC profiles (Fig. 3e and f). One can easily see that TSM concentrations at lower depths at all stations were higher than at more shallow depths, sug-gesting that sediment resuspension and/or lateral transport of TSM are remarkable features in the ECS. Iseki et al. (2003) also suggested that the bottom turbid layer (BTL) is a poten-tial source of downslope transport of resuspended particles on the shelf.
[image:8.595.162.436.280.391.2]C.-C. Hung et al.: Fluxes of particle organic carbon in the East China Sea in summer 6477
measurements (Chang et al., 2003). The phytoplankton car-bon level in the inner shelf was 143 mg C m−3and accounted for 47.7 % of POC concentration (∼300 mg C m−3; the de-tailed information can be found in Chang et al., 2003). Never-theless, other factors, such as dead phytoplankton cells, zoo-plankton, resuspended particles, and fecal pellets are likely sources of POC in the water column. The result suggests that the Changjiang plume carrying fluvial particles in the water column of the inner shelf approximately contributes<50 % to measured POC concentration. Moreover, distributions of salinity, sigma-T (kg m−3)and NO3in the inner shelf
(sta-tion 19, 19A and 29) are shown in Fig. 6a suggesting that low PP in the inner shelf with riverine influence could be caused by high turbidity and water stratification rather than nutrient limitation. As a consequence, it will cause a highere ratio due to low PP values. Furthermore, beside low PP in the inner shelf, one may see the lowest PP appearing in the in-ner shelf (i.e., S5) too. It could be mainly caused by nutrient limitation (Fig. 6b) and high total suspended matter (TSM >1–2 mg L−1, e.g., a light effect). The low concentrations of nitrate at station 5 support the phenomenon reflecting that the higher POC was a passive result while the low PP is an in situ measured parameter when incubated in the bottles. As shown in Fig. 6b, the nitrate concentration in the water col-umn at station 5 was almost close to zero, which will signif-icantly inhibit phytoplankton growth, and then result in low PP value. Therefore, theeratio (POC flux / PP) will be in-creased because of low PP.
As mentioned above, POC sources are mainly from in situ phytoplankton (also zooplankton) production, detritus, ter-restrial input, and fluvial carbon. Recently, a hypoxia zone (dissolved oxygen concentration <62.5 µM) has been no-ticed in the estuarine and coastal regions of the ECS (Chen et al., 2007, 2013; Wang, 2009; Zhu et al., 2011), but the mechanisms for the occurrence of oxygen depletion is still unclear. Our data support the contention that high organic matter fluxes may consume oxygen in the near-bottom waters off the Changjiang diluted water regions during the summer, as was reported by Chen et al. (2007) and Zhu et al. (2011).
Most organic carbon (OC) concentrations in surface sedi-ments in this study are slightly lower than previous data (Ta-ble 2, Sheu et al., 1995; Kao et al., 2003). In comparison, OC contents in surface sediments of the ECS ranged from 0.1 to 0.4 % for the majority of the ECS continental shelf sediments (Lin et al., 2002). Other scientists reported that OC contents in the ECS ranged from 0.1 to 0.9 % (Sheu et al., 1995; Kao et al., 2003). It is difficult to find the real reasons to interpret the difference among these studies. Lin et al. (2002) pointed out that OC contents less than (or close to) 0.2 % were found in the outer shelf area where approximately 90 % of the sed-iments were composed of coarse-grained quartz and/or car-bonate sand. Low concentrations of OC found in the middle shelf and were possibly a combined result of limited fine-grained and large sediments (Lin et al., 2000). It is worth not-ing that the model-derived high values of surface organic
car-Fig. 6. (A) Distributions of salinity, sigma-T and nitrate in the in-ner shelf stations S19, S19A and S29. (B) Distributions of vertical nitrate (S26, S28, S10 and S5) in the East China Sea.
bon could be caused by extrapolation of the mixing model or selective mobilization of lightest fraction (i.e., organic mat-ter rich mamat-terial) of the bed sediment during resuspension (Jago and Jones, 1998; Jones et al., 1998; Bale and Morris et al., 1998). In addition, the OC values (Table 2) in this study were the average value of bed sediments within 2 cm rather than only surface sediment (i.e., with elevated organic carbon sediment).
4.2 Sensitivity of the vertical particle mixing model and comparison of the resuspension of trapped matter in different regions
Two parameters, Cs andCo, will affect the ratio of
[image:9.595.309.545.68.462.2]6478 C.-C. Hung et al.: Fluxes of particle organic carbon in the East China Sea in summer
Table 5. Data of corrected POC flux (POC flux), primary production (PP) anderatio (POC flux / PP) in the ECS.
Water Station Bottom depth EZ Trap depth POC flux PP eratio mass (m) (m) (m) (mg C m−2d−1) (mg C m−2d−1)
CDW S18 47 15 20 785±438 1897 0.41±0.23
CDW S19 38 22 20 486±275 3045 0.16±0.09
SMW S28 60 50 30 69±39 600 0.12±0.07
CDW S29 57 26 20 297±168 3377 0.09±0.05
CUW S5 51 36 20 307±169 337 0.91±0.50
KW S10 154 90 120 58±33 1153 0.05±0.03
KW S26 118 74 100 63±36 442 0.14±0.08
the predictedCs(Cs1in Table 2) and a fixedCtandCo, to
es-timate theR/T, the variation ofR/T in the study area ranges from 4 % to 9 %, suggesting thatR/T is not significantly af-fected byCs(detailed data shown in the Supplement).
How-ever, most derived Cs values are higher than the observed
OC values in the surface sediments of the ECS, suggesting that discharge of suspended particles (with low carbon high TSM) of the Changjiang River could affect the results be-sides bottom sediment resuspension (Zhu et al., 2006; Guo et al., 2010). These results illustrate that the derivedCs
val-ues need appropriate adjustment by field-observed OC data in the sediments.
If we use a givenCo (So=0.25 mg L−1, about 50 % of
uncertainty) and a fixed Ct and Cs to estimate the R/T,
the variation of R/T ranges from 3 % to 51 % (on aver-age 28 %) (detailed data shown in the Supplement). If we changeCoto (So=0.75) and fixCtandCs, the variation of
R/T ranges from 4 % to 51 % (on average 29 %). The re-sults suggest thatCo is more sensitive than Cs. If we use
So=0.5 mg L−1to estimateR/T, then the predictedCowill
be 13.4 to 21.9 %, which is very close to the phytoplank-ton culture data (10–17 %, Tseng, 2010). Overall, the vertical mixing model is a simple approach to constrain the effect of resuspended particles on POC flux effectively, but it is not a perfect tool in the inner shelf in the turbid waters under flu-vial influence, because resuspended particles cannot be com-pletely separated from sinking particles.
As shown in Table 5, the corrected POC fluxes in this study in the inner and middle shelves are much lower than POC flux values reported by Iseki et al. (2003). Firstly, as we mentioned, the mixing model cannot distinguish fluvial sus-pended matter from resussus-pended sediments. Secondly, Iseki et al. (2003) found elevated POC fluxes always occurring within the bottom turbid layer, which might have significant particle resuspension, but they did not calibrate it. Thirdly, the deployment depths of sediment traps and hydrographic settings between two studies are different so that it is diffi-cult to compare them.
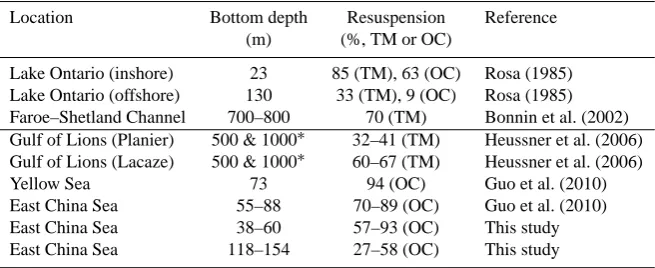
In coastal areas, continental shelves or marginal seas, sediment resuspension phenomenon is ubiquitous (Lampitt, 1985; Jones et al., 1998; Bales and Morris, 1998; Bonnin et
al., 2002; Guo et al., 2010), but estimated resuspension by model or two end-member approaches is limited. To date, only a few investigations have reported the sediment resus-pension impact on trapped matter or organic carbon in lakes, shelf regions and deep water (Table 6, Rosa, 1985, Bonnin et al., 2002; Heussner et al., 2006; Guo et al., 2010). For instance, resuspension (or called rebound sediments) mat-ter trapped by sediment traps in shallow wamat-ter (<100 m) re-gion in Lake Ontario, Yellow Sea or ECS ranged from 63 to 94 % for trapped organic carbon and was approximately 85 % for trapped matter (Table 6). In deep water, resuspension in Faroe–Shetland Channel or Gulf of Lions ranged from 32 to 70 % for trapped matter (Table 6). In comparison, the esti-mated results of resuspension in this study are in agreement with previously reported results although survey regions are different.
4.3 Possible carbon export in the ECS
C.-C. Hung et al.: Fluxes of particle organic carbon in the East China Sea in summer 6479
Table 6. Estimated resuspension of total trapped mater or organic carbon collected by sediment traps in different regions.
Location Bottom depth Resuspension Reference (m) (%, TM or OC)
Lake Ontario (inshore) 23 85 (TM), 63 (OC) Rosa (1985) Lake Ontario (offshore) 130 33 (TM), 9 (OC) Rosa (1985) Faroe–Shetland Channel 700–800 70 (TM) Bonnin et al. (2002) Gulf of Lions (Planier) 500 & 1000∗ 32–41 (TM) Heussner et al. (2006) Gulf of Lions (Lacaze) 500 & 1000∗ 60–67 (TM) Heussner et al. (2006)
Yellow Sea 73 94 (OC) Guo et al. (2010)
East China Sea 55–88 70–89 (OC) Guo et al. (2010) East China Sea 38–60 57–93 (OC) This study East China Sea 118–154 27–58 (OC) This study
∗trap depth. TM: total trapped matter; OC: trapped organic carbon.
(Hoshika et al., 2003) and/or enter the open ocean interior or partly deposited near northern Okinawa Trough (Fig. 1).
Besides the carbon export in the outer shelf of the ECS, we also find a higher carbon export rate (eratio=0.09–0.41 for CDW and 91 % for CUW) in the CDW and CUW regions. The higher carbon export rate in the CDW regions is mainly caused by strong phytoplankton primary production because of high nutrient supply from the Changjiang River and/or partly from the Changjiang plume carrying fluvial particles. The higheratios in this study are similar to the reported val-ues in the middle Yellow Sea and in the upwelling region off Zhejiang by Guo et al. (2010). While the nutrient sup-ply in the CUW is not pronounced, the question arises as to why the carbon export rate is so high. Possible explanations are the following: (1) PP is limited by light intensity (due to high suspended particles, TSM>1–2 mg L−1), (2) nutri-ent limitation in the surface layer or (3) strong vertical mix-ing (e.g., water un-stabilization). Regardless of the POC flux values in the inner shelf, there is another unanswered ques-tion: where is the carbon going? This study indeed provides quantitative POC flux data, but it is difficult to compare them with direct evidence. Another possible transport pathway in the inner shelf would be south, along the coast, with eventual burial in the southern Okinawa Trough (Liu et al., 2000). Ac-cording to Berelson (2002), the average settling velocity of particles in the ocean ranges from 100 to 300 m d−1. Given that the water depth in the ECS ranges from 30 to 200 m, particles would settle in a day or less. In other words, par-ticles are being transported, undergo continuous sinking and resuspension in the bottom turbid layer (Hoshika et al., 2003) or to the bottom of sediments. Tsai (1996) also reported that when tidal currents flow eastward in the southern ECS, the suspended particulate matter flux is elevated, revealing that tidal currents are an important mechanism for transporting particles from marginal seas to the open ocean. Therefore, we suggest that lateral POC transport is driven by the interac-tions of surface sediment resuspension with tidal currents, or contour currents or via isopycnal diffusion. Apparently, fine particles did not accumulate in the middle shelf (Kao et al.,
2003), suggesting that these fine particles were transported elsewhere.
4.4 Rare earth element
Some rare earth elements (REEs) such as light rate earth el-ements (LREES) have been used as proxies to evaluate sedi-ment sources in numerous settings (Goldstein and Jacobsen, 1988; Zhang et al., 1998; Sholkovitz et al., 1999; Li et al., 2013). Most LREES (Table 7) in this study have difficulties in distinguishing suspended particles from sediments based on their levels, but Eu concentrations in particles seem to be a good tracer due to remarkable differences between sus-pended particles and sediments. Therefore, we used the Eu anomaly (Eu / Eu∗) (Eu∗=1.90±0.07µg g−1 was the
aver-age value of Eu∗ in both sediment (1.85 µg g−1) and
6480 C.-C. Hung et al.: Fluxes of particle organic carbon in the East China Sea in summer
Table 7. Concentrations of light rare earth elements (LREEs) in the sinking particles, sediment and suspended matter (SPM) in the East China Sea.
Station La Ce Pr Nd Sm Eu Gd
(µg g−1) (µg g−1) (µg g−1) (µg g−1) (µg g−1) (µg g−1) (µg g−1)
S18 40.87 72.44 6.77 35.18 5.37 1.11 5.61
S19 44.29 78.94 7.86 40.40 6.25 1.23 6.18
S28 4.17 4.86 0.24 0.46 ND ND ND
S29 17.92 31.27 2.85 14.44 1.63 0.44 1.47
S5 42.80 78.76 7.15 37.01 5.09 1.06 5.21
S10 11.04 21.99 1.84 9.84 1.20 0.31 0.98
S26 23.88 43.20 4.19 21.64 3.27 0.65 3.22
Sediment∗ 43.00 86.00 ND 44.00 6.00 0.89 ND
SPM∗ 44.00 85.00 ND 40.00 6.00 1.31 ND
∗The data of sediment and SPM were from the river mouth (near station 19) of Yangtze River in Zhang et al. (1998).
ND: no data.
value. Furthermore, we should provide Eu values in both sus-pended particles and sediments, while the rare earth elements in this study were not available due to the fact that we used GF/F filters. The fractions of REE are a potential approach to evaluate the possible contribution of suspended and resus-pended particles in marginal seas where a large river emp-ties into it. The estimated percentage of resuspended particles based on REE is different from the mixed model on organic matter, but it may reflect the fact that each component of REE shows a distinctive nature during weathering, erosion, and fluvial transportation (McLennan, 1989). As mentioned before, the resuspension particles were likely from lightest organic matter, which can be different from REE character-istics, but REE data can provide another avenue to know if suspension exists in the study area.
4.5 Comparing short-time measurements of POC fluxes
and PP values with long-time estimates of234 Th-derived POC fluxes and satellite-Th-derived PP
In this study, one may ask questions if short-time (hours–day) measurements of sediment-trap-measured POC fluxes and C-14 incubation PP values are reliable. First, sediment traps are often used to measure POC flux directly, despite possi-ble biases by hydrodynamic and biological effects (Gardner, 1980; Gardner et al., 1983; Lee et al., 1988; Karl and Knauer, 1989). Furthermore, Marty et al. (2009) reported that short-term fluctuations of POC fluxes were quite obvious with a diel periodicity: higher POC fluxes during the night period and lower POC fluxes during the day period. However, Li (2009) investigated POC fluxes using a time series (4, 8, 12 and 24 h) of trap deployments in the ECS and found no significant difference in POC flux between night and day. Hung et al. (2010c) also reported that daytime POC fluxes (8 a.m. to 5 p.m.) at 120 m and 150 m in the outer shelf of the ECS off northeastern Taiwan in summer in 2008 were 46±7 mg C m−2d−1 and 48±8 mg C m−2d−1, respec-tively. Nighttime POC fluxes (12 a.m. to 9 a.m.) at 120 m and
60 1009
1010 Fig. 7 1011 1012
0.2 0.4 0.6 0.8 1.0 1.2 1.4
SPM* S18 S19 S29 S5 S10 S26 Sed.*
Eu
(
µ
g/
g)
Samples
A
0.0 0.2 0.4 0.6 0.8
SPM* S18 S19 S29 S5 S10 S26 Sed.*
Eu
/Eu
*
Samples
B
1013 1014 1015 1016
[image:12.595.311.545.271.598.2]C.-C. Hung et al.: Fluxes of particle organic carbon in the East China Sea in summer 6481
150 m were 53±9 mg C m−2d−1and 44±7 mg C m−2d−1, respectively, suggesting no variation in the fluxes occurred between night and day. The inconsistent field observations may reflect the fact that POC fluxes are affected by both physical and biological processes simultaneously. Moreover, content of sinking particles also contains other detritus, dead phytoplankton cells, aggregates, etc. besides fecal pellets. Our floating trap is designed to collect passive vertical par-ticles below or close to the depth of the euphotic zone so that we cannot catch active particles such as deep fecal pel-lets, which is a difficult part to estimate in terms of its mass and POC content. More studies are needed for this in the fu-ture. Furthermore, the trapping efficiency of sediment traps is variable and it may also give additional uncertainties to our estimate of the POC fluxes in the ECS.
Besides sediment traps,234Th has been increasingly used as a tracer to estimate POC flux due to its timescales (weeks to month) in surface water (Coale and Bruland, 1985; Santschi et al., 2006) based on calculation of the product of the POC /234Th ratio in sinking particles and the234Th flux. Although both methods have their uncertainties (see review in Buesseler et al., 2006, 2007; Hung and Gong, 2010; Xu et al., 2011; Hung et al., 2012), recent studies have shown that both methods are complementary means for estimating POC flux in the upper ocean in different marine environments in-cluding the ECS, the Kuroshio, the South China Sea, the Gulf of Mexico, and the oligotrophic northwestern Pacific Ocean (Hung and Gong, 2007; Li, 2009; Hung et al., 2004, 2010c; Wei et al., 2011). The POC fluxes measured by sed-iment traps and234Th approaches in the Kuroshio, the Gulf of Mexico, and the South China Sea are in good agreement if the ratio of POC /234Th is appropriately selected. These results support that our short-time sediment trap method is reliable.
Secondly, short-time (hours incubation) PP experiment was conducted in the ECS covering all four seasons by Gong et al. (2003), and the results showed seasonal variations with elevated values in the inner shelf of the ECS and low ues in the outer shelf of the ECS. For example, PP val-ues in the southern ECS off northeastern Taiwan were ap-proximately 400–500 mg C m−2d−1 in summer under good weather conditions. In comparison, Siswanto et al. (2009) reported that the satellite-derived PP value (daily data) in the southern ECS in summer in 2005 under non-typhoon conditions was approximately 500 mg C m−2d−1, which is in good agreement with the PP values. Recently, Hung et al. (2010c) reported that PP values estimated by the model (1283 mg C m−2d−1, Behrenfeld and Falkowski, 1997) and by C-14 incubation (1773 mg C m−2d−1, Gong et al., 2003; 1367–1945 mg C m−2d−1, Shih et al., 2013) in the south-ern ECS after typhoon events in 2007 and 2008 are quite comparable if the analytical uncertainty (20–30 %) is con-sidered. The enhanced PP after a typhoon event was mainly caused by high nutrient supply via both vertical mixing and upwelling. The detailed discussion can be found in Hung et
al. (2010c). In other words, data (POC fluxes and PP values) obtained from short-term measurements by sediment traps and C-14 incubation are comparable to long-term methods such as 234Th-derived approaches and satellite-derived PP values.
5 Conclusions
This study involved direct measurement of POC fluxes and primary production in the ECS. It was found that some of POC fluxes were higher than primary production, suggesting that the lower PP might be inhibited due to water stratifica-tion and light limitastratifica-tion in the inner shelf. A vertical particle mixing model was used to correct effects of bottom sediment resuspension. The corrected POC fluxes in the inner, middle and outer shelves thus obtained were 297±168–785±438, 69±39 and 58±33 mg C m−2d−1, respectively, lower than previously reported values (Iseki et al., 2003). The difference between two studies could be caused by different trap de-ployment depths, ignoring fluvial suspended matter influence from Changjiang, or different trap deployment time. While the vertical mixing model is still not a perfect model to de-termine sediment resuspension fluxes accurately, because it ignored biological degradation of sinking particles, terres-trial, fluvial input and lateral transport, it does result in rea-sonable quantitative estimates of export fluxes. It is a first step towards the development of a better model to calibrate POC flux in a highly suspended marine environment, which is needed because carbon cycling in the marginal sea is more complex than previously thought.
Supplementary material related to this article is available online at http://www.biogeosciences.net/10/ 6469/2013/bg-10-6469-2013-supplement.pdf.
Acknowledgements. We are grateful to J. Z. Tseng, W. Z. Yang, W. J. Chung, W. T. Kuo, M. L. Sheu, S. L. Lee and the crew of the R/V Ocean Research I for their assistance in collecting samples. We also thank three anonymous reviewers and the guest Editor Christophe Rabouille for giving constructive comments that improved the paper. This research was funded by grants from National Science Council (NSC100-2119-M-110-003, NSC101-2611-M-110-015-MY3, NSC101-2116-M-110-001).
Edited by: C. Rabouille
References
6482 C.-C. Hung et al.: Fluxes of particle organic carbon in the East China Sea in summer
Behrenfeld, M. J. and Falkowski, P. G.: Photosynthetic rates de-rived from satellite-based chlorophyll concentration, Limnol. Oceanogr., 42, 1–20, 1997.
Berelson, W. M.: Particle settling rates increase with depth in the ocean. Deep-Sea Res. Pt. II, 49, 237–251, 2002.
Bloesch, J.: A review of methods used to measure sediment resus-pension. Hydrobiologia, 284, 13–18, 1994.
Bonnin, J., Raaphorst, W. v., Brummer, G. J., Haren, H. v., and Malschaert, H.: Intense mid-slope resuspension of particulate matter in the Faeroe-Shetland Channel: short-term deployment of near-bottom sediment traps, Deep-Sea Res. Pt. I., 49, 1485– 1550, 2002.
Buesseler, K. O., Benitez-Nelson, R. R., Moran, S. B., Burd, A., Charette, M., Cochran, J. K., Coppola, L., Fisher, N. S., Fowler, S. W., Gardner, W. D., Guo, L. D., Gustafsson, O., Lamborg, C., Masque, P., Mequel, J. C., Passow, U., Santschi, P. H., Savoye, N., Stewart, G., and Trull, T.: An assessment of particulate or-ganic carbon to thorium-234 ratios in the ocean and their impact on the application of234Th as a POC flux proxy, Mar. Chem. 100, 213–233, 2006.
Buesseler, K. O., Antia, A. N., Chen, M., Fowler, S.W., Gardner, W. D., Gustafsson, O., Harada, K., and Michaels, A. F., Rutgers van der Loeff, M., Sarin, M., Steinberg, D. K., and Trull, T.: An as-sessment of the use of sediment traps for estimating upper ocean particle fluxes, J. Mar. Res., 65, 345–416, 2007.
Chang, J., Shiah, F.-K., Gong, G.-C., and Chiang, K. P.: Cross-shelf variation in carbon-to-chlorophyll a ratios in the East China Sea, summer 1998, Deep-Sea Res. Pt. II, 50, 1237–1247, 2003. Chen, C.-C., Gong, G.-C., and Shiah, F.-K.: Hypoxia in the East
China Sea: one of the largest coastal low-oxygen areas in the world, Mar. Environ. Res., 64, 399–408, 2007.
Chen, C.-C., Gong, G.-C., Shiah, F.-K., Chou, W.-C., and Hung, C.-C.: The large variation in organic carbon consumption in spring in the East China Sea, Biogeosciences, 10, 2931–2943, doi:10.5194/bg-10-2931-2013, 2013.
Chen, C. T. A. and Wang, S. L.: Carbon, alkalinity and nutrient bud-gets on the East China Sea continental shelf, J. Geophys. Res., 104, 675–686, 1999.
Chou, W.-C., Gong, G.-C., Sheu, D.-D., Hung, C.-C., and Tseng, T.-F.: The surface distributions of carbon chemistry parameters in the East China Sea in summer 2007, J. Geophys. Res., 114, C07026, doi:10.1029/2008JC005128, 2009a.
Chou, W.-C., Gong, G.-C., Sheu, D. D., Jan, S., Hung, C.-C., and Chen, C.-C.: Reconciling the paradox that the heterotrophic wa-ters of the East China Sea shelf act as a significant CO2 sink during the summertime: evidence and implications, Geol. Res. Lett., 35, L15607, doi:10.1029/2009GL038475, 2009b. Chou, W.-C., Gong, G.-C., Tseng, C.-M., Sheu, D. D., Hung, C.-C.,
Chang, L.-P., and Wang, L.-W.: The carbonate system in the East China Sea in winter, Mar. Chem., 123, 44–55, 2011.
Chou, W.-C., Gong, G.-C., Hung, C.-C., and Wu, Y.-H.: Carbonate mineral saturation states in the East China Sea: present condi-tions and future scenarios, Biogeosciences, in press, 2013. Coale, K. H. and Bruland K. W. :234Th:238U disequilibria within
the California Current, Limnol. Oceanogr., 30, 22–33, 1985. Falkowski, P. G, Biscaye, P. E., and Sancetta, C.: The lateral flux
of biogenic particles form the eastern North America continental margin to the North Atlantic Ocean, Deep-Sea Res. Pt. II, 41, 583–601, 1994.
Fang, T. H., Chen, J. L., and Huh, C. A.: Sedimentary phosphorus species and sedimentation flux in the East China Sea. Cont. Shelf Res., 27, 1465–1476, 2007.
Gardner, W. D.: Sediment trap dynamics and calibration: a labora-tory evaluation, J. Mar. Res., 38, 17–39, 1980.
Gardner W. D., Hinga K. R., and Marra J. : Observations on the degradation of biogenic material in the deep ocean with implica-tions on the accuracy of sediment trap fluxes, J. Mar. Res., 41, 195–214, 1983.
Goldstein, S. J. and Jacobsen, S. B.: Nd and Sr Isotopic Systematics of River Water Suspended Material – Implications for Crustal Evolution, Earth Planet. Sc. Lett., 87, 249–265, 1988.
Gong, G.-C., Shiah, F.-K., Liu, K.-K., Wen, Y.-H., and Liang, M.-H.: Spatial and temporal variation of chlorophyll a, primary pro-ductivity and chemical hydrography in the southern East China Sea, Cont. Shelf Res., 20, 411–436, 2000.
Gong, G.-C., Wen, Y. H., Wang, B. W., and Liu, G. J.: Seasonal vari-ation of chlorophyllaconcentration, primary production and en-vironmental conditions in the subtropical East China Sea, Deep Sea Res. Pt. II, 50, 1219–1236, 2003.
Gong, G.-C., Chang, J., Chiang, K.-P., Hsiung, T.-M., Hung, C.-C., Duan, S.-W., and Codispoti, L. A.: Reduction of primary pro-duction and changing of nutrient ratio in the East China Sea: Ef-fect of the Three Gorges Dam?, Geophys. Res. Lett. 33, L07610, doi:10.1029/2006GL025800, 2006.
Gong, G. C., Liu, K. K., Chiang, K.P., Hsiung, T.M., Chang, J., Chen, C. C., Hung, C. C., Chou, W. C., Chung, C. C., Chen, H. Y., Shiah, F. K., Tsai, A.Y., Hsieh, C. H., Shiao, J. C., Tseng, C. M., Hsu, S. C., Lee, H. J., Lee, M. A., Lin, I. I., and Tsai, F., : Yangtze River floods enhance coastal ocean phytoplankton biomass and potential fish production, Geophys. Res. Lett., 38, L13603, doi:10.1029/2011GL047519, 2011.
Guo, X., and Zhang, Y.: Particle flux through the Huanghai Sea cold water mass, Acta Oceanol. Sin., 24, 78–88, 2005.
Guo, X., Zhang, Y., Zhang, F., and Cao, Q.: Characteristics and flux of settling particulate matter in neritic waters: The southern Yel-low Sea and the East China Sea, Deep-Sea Res. Pt. II, 57, 1058– 1063, 2010.
Heussner, S., de Madron, X. D., Galafat, A., Canals, M. Carbonne, J., Delsaut, N., and Saragoni, G.: Spatial and temporal variability of downward particle fluxes on a continental slope: Lessons from an 8-yr experiment in the Gulf of Lions (NW Mediterranean), Mar. Geol., 234, 63–92, 2006.
Hoshika, A., Tanimoto, T., Mishima, Y., Iseki, K., and Okamura, K.: Variation of turbidity and particle transport in the bottom layer of the East China Sea, Deep-Sea Res. Pt. II, 50, 443–455, 2003. Hsu, S.-C. and Lin, F.-J.: Elemental characteristics of surface
sus-pended particulates off the Changjiang estuary during the 1998 flood, J. Marine Syst., 81, 323–334, 2010.
Hung, C.-C. and Gong, G.-C.: Export flux of POC in the main stream of the Kuroshio, Geophys. Res. Lett., 34, L18606, doi:10.1029/2007GL030236, 2007.
Hung, C.-C. and Gong, G.-C.: POC /234Th ratios in particles col-lected in sediment traps in the northern South China Sea, Estuar. Coast. Shelf S., 88, 303–310, 2010.
C.-C. Hung et al.: Fluxes of particle organic carbon in the East China Sea in summer 6483
Hung, C.-C., Wong, G. T. F., Liu, K.-K., Shiah, F.-K., and Gong, G.-C.: The effects of environmental conditions on the relation-ship between nitrate reductase activity and15NO3−uptake: field observations in the East China Sea, Limnol. Oceanogr., 45, 836– 848, 2000.
Hung, C.-C., Guo, L., Roberts, K., and Santschi, P.H.: Upper ocean carbon flux determined by234Th and sediment traps in the Gulf of Mexico, Geochem. J., 38, 601–611, 2004.
Hung, C.-C., Gong, G.-C., Chung, W.-C., Kuo, W.-T., and Lin, F.-C.: Enhancement of particulate organic carbon export flux in-duced by atmospheric forcing in the subtropical oligotrophic northwest Pacific Ocean, Mar. Chem., 113, 19–24, 2009a. Hung, C.-C., Gong, G.-C., Chiang, K.-P., Chen, H.-Y., and Yeager,
K. M.: Particulate carbohydrates and uronic acids in the northern East China Sea. Estuar. Coast. Shelf S., 84, 565–572, 2009b. Hung, C.-C., Gong, G.-C., Ko, F.-C., Chen, H.-Y., Hsu, M.-L., Wu,
J.-M., Peng, S.-C., Nan, F.-H., Yeager, K. M., and Santschi, P. H.: Relationships between persistent organic pollutants and car-bonaceous materials in aquatic sediments of Taiwan, Mar. Pol-lut. Bull., 60, 1010–1017, doi:10.1016/j.marpolbul.2010.01.026, 2010a.
Hung, C. C., Xu, C., Santschi, P. H., Zhang, S. J., Schwehr, K. A., Quigg, A., Guo, L. D., Gong, G. C., Pinckney, J. L., Long, R. A., and Wei, C. L.: Comparative evaluation of sediment trap and Th-234-derived POC fluxes from the upper oligotrophic waters of the Gulf of Mexico and the subtropical northwestern Pacific Ocean, Mar. Chem., 121, 132–144, 2010b.
Hung, C.-C., Gong, G.-C., Chou, W.-C., Chung, C. -C., Lee, M.-A., Chang, Y., Chen, H.-Y., Huang, S.-J., Yang, Y., Yang, W.-R., Chung, W.-C., Li, S.-L., and Laws, E.: The effect of ty-phoon on particulate organic carbon flux in the southern East China Sea, Biogeosciences, 7, 3007–3018, doi:10.5194/bg-7-3007-2010, 2010c.
Hung, C.-C., Gong, G.-C., Ko, F. C., Lee, H. J., Chen, H. Y., Wu, J. M., Hsu, M. L., Peng, S. C., Nan, F. H., and Santschi, P. H.: Poly-cyclic aromatic hydrocarbons in surface sediments of the East China Sea and their relationship with carbonaceous materials, Mar. Pollut. Bull., 63, 464–470, 2011.
Hung, C.-C., Gong, G.-C., and Santschi, P. H.:234Th in different size classes of sediment trap collected particles from the North-western Pacific Ocean, Geochim. Cosmochim. Ac., 91, 60–74, 2012.
Hung, J.-J., Lin, C. S., Hung, G. W., and Chung, Y. C.: Lateral trans-port of lithogenic particles from the continental margin of the southern East China Sea, Estuar. Coast. Shelf S., 49, 483–499, 1999.
Hung, J.-J., Lin, C. -S., Chung, Y.-C., Hung, G.-W., and Liu. W.-S.: Lateral fluxes of biogenic particles through the Mien-Hua canyon in the southern East China Sea slope, Cont. Shelf Res., 23, 935– 955, 2003.
Iseki, K., Okamura, K., and Kiyomoto, Y.: Seasonality and compo-sition of downward particulate fluxes at the continental shelf and Okinawa Trough in the East China Sea, Deep-Sea Res. Pt. II, 50, 457–473, 2003.
Jago, C. F., and Jones, S. E.: Observation and modeling of the dy-namics of benthic fluff resuspended from a sandy bed in the southern North Sea, Cont. Shelf Res., 18, 1255–1282, 1998. Jones, S. E., Jago, C. F., Bale, A. J., Chapman, D., Howland, R. M.
J., and Jackson, J. J.: Aggregation and resuspension of suspended
particulate matter at a seasonally stratified site in the southern North Sea: physical and biological controls, Cont. Shelf Res., 18, 1283–1309, 1998.
Kao, S. J., Lin, F. J., and Liu, K. K.: Organic carbon and nitrogen contents and their isotopic compositions in surficial sediments from the East China Sea shelf and the southern Okinawa Trough, Deep-Sea Res. Pt. II, 50, 1203–1217, 2003.
Karl, D. M. and Knauer G. A. : Swimmers, a recapitulation of the problem and a potential solution, Oceanography, 2, 32–35, 1989. Lampitt, R. S.: Evidence for the seasonal deposition of detritus to the deep-sea floor and its subsequent resuspension, Deep-Sea Res., 32, 885–897, 1985.
Lee, H.-J. and Chao, S.-Y.: A climatological description of circula-tion in and around the East China Sea, Deep Sea Res. Pt. II, 50, 1065–1084, 2003.
Lee, C., Wakeham S. G., and Hedges J. I. : The measurement of oceanic particle flux – are “swimmer” a problem?, Oceanogra-phy, 1, 34–36, 1988.
Li, C.-S., Shi, X.-F., Kao, S.-J., Liu, Y.-G., Lyu, H.-H., Zou, J.-J., Liu, S.-F., and Qiao, S.-F.: Rare earth elements in fine-grained sediments of major rivers from the high-standing island of Tai-wan, J. Asian Earth Sci., 69, 39–47, 2013.
Lee, H.-J. and Chao, S.-Y.: A climatological description of circula-tion in and around the East China Sea, Deep Sea Res. Pt. II, 50, 1065–1084, 2003.
Li, S.-L.: Particulate organic carbon flux in the upwelling region off northeastern Taiwan. Thesis, National Taiwan Ocean University, Keelung, Taiwan, 1–55, 2009.
Lin, S., Hsieh, I.-J., Huang, K.-M., and Wang, C.-H.: Influence of the Yangtze River and grain size on the spatial variations of heavy metals and organic carbon in the East China Sea continental shelf sediments, Chem. Geol., 182, 377–394, 2002.
Liu, K.-K., Iseki, K., and Chao, S. Y.: Continental margin carbon fluxes, in: The Changing Ocean Carbon, edited by: Hanson, R. B., Cycle, IGBP book series. Cambridge University Press, Cam-bridge, 187–239, 2000.
Liu, K.-K., Chao, S.-Y., Marra, J., and Snidvongs, A.: Monsoonal forcing and biogeochemical environments of outer southeast asia seas, in: The sea: Ideas and observations on progress in the study of seas, vol. 14, the global coastal ocean: Interdisciplinary re-gional studies and synthesis, edited by: Robinson, A. and Brink, K. H., Harvard Univ. Press, Cambridge, 673–721, 2006. Liu, K.-K., Gong, G.-C., Wu, C.-R., Lee, H.-J., and Lee, B.-S.:
Bio-geochemistry of the Kuroshio and the East China Sea, in: Carbon and nutrient fluxes in continental margins: a global synthesis, edited by: Liu, K.-K., Atkinson, L., Quinones, R., and Talaue-McManus, L., IGBP Book Series, Springer, 2010.
Marty, J. C., Goutx, M., Guigue, C., Leblond, N., and Raim-bault, P.: Short-term changes in particulate fluxes measured by drifting sediment traps during end summer oligotrophic regime in the NW Mediterranean Sea, Biogeosciences, 6, 887–899, doi:10.5194/bg-6-887-2009, 2009.
McLennan, S. M.: Rare earth elements in sedimentary rocks: in-fluene of provenance and sedimentary processes, in: Geochem-istry and Mineralogy of Rare Earth Elements, edited by: Lipin, B. R. and McKay, G. A., Reviews in Mineralogy, vol 21., Miner-alogy Society of America, Washington, DC, 169–200, 1989. Morris, A. W., Bale, A. J., Howland, R. J. M., Loring, D. H., and
par-6484 C.-C. Hung et al.: Fluxes of particle organic carbon in the East China Sea in summer
ticle populations in a macrotidal estuary (Tamar Estuary, U.K.), Cont. Shelf Res., 7, 1351–1355, 1987.
Oguri, K., Matsumoto, E., Yamada, M., Saito, Y., and Iseki, K.: Sediment accumulation rates and budgets of depositing particles of the East China Sea, Deep-Sea Res. Pt. II, 50, 513–528, 2003. Parsons, T. R., Maita, Y., Lalli, C. M.: A manual of chemical and
bi-ological methods for seawater analysis, Pergamon Press, Oxford, 173 pp., 1984.
Peng, T.-H., Hung, J.-J., Wanninkhof, R., and Millero, F. J.: Carbon budget in the East China Sea in spring, Tellus B, 51, 531–540, 1999.
Rosa, F.: Sedimentation and sediment resuspension in lake ontario, J. Great Lakes Res., 11, 13–25, 1985.
Santschi, P. H., Hung, C.-C., Guo, L., Schultz, G. G., Pinckney, J., and Walsh, I.: Control of acid polysaccharide production,234Th and particulate organic carbon export flux by marine organisms, Geophys. Res. Lett., 30, 1044, doi:10.1029/2002GL015727, 2003.
Santschi, P. H., Murray, J. W., Baskaran, M., Benitez-Nelson, C., Guo, L. D., Hung, C.-C., Lamborg, C., Moran, S. B., Passow, U., and Roy-Barman, M.: Thorium speciation in seawater, Mar. Chem., 100, 250–268, 2006.
Sheu, D. D., Jou, W.-C., Chen, M.-J., Lee, W.-Y., and Lin, S.: Vari-ations of calcium carbonate, organic carbon and their isotopic compositions in surface sediments of the East China Sea, Terr. Atmos. Ocean. Sci., 6, 115–128, 1995.
Shih, Y.-Y., Hsieh, J.-S., Gong, G.-C., Hung, C.-C., Chou, W.-C., Lee, M.-A., Chen, K.-S., Chen, M.-H., and Wu, C.-R.: Field ob-servations of changes in SST, chlorophyll and POC flux in the southern East China Sea before and after the passage of Typhoon Jangmi, Terr. Atmos. Ocean. Sci., 24, 899–910, 2013.
Shim, J., Kim, D., Kang, Y. C., Lee, J. H., Jang, S.-T., and Kim, C.-H.: Seasonal variations inpCO2and its controlling factors in surface seawater of the northern East China Sea, Cont. Shelf Res., 27, 2623–2636, 2007.
Sholkovitz, E. R., Elderfield, H., Szymczak, R., and Casey, K.: Is-land weathering: river sources of rare earth elements to the West-ern Pacific Ocean, Mar. Chem., 68, 39–57, 1999.
Siswanto, E., Morimoto, A., and Kojima, S.: Enhancement of phy-toplankton primary productivity in the southern East China Sea following episodic typhoon passage, Geophys. Res. Lett., 36, L11603, doi:10.1029/2009GL037883, 2009.
Smith, S. V. and Hollibaugh, J. T.: Coastal metabolism and the oceanic carbon balance, Rev. Geophys., 31, 75–89, 1993. Tsai, C. H.: An assessment of a time-of-transition laser size in
mea-suring suspended particles in the ocean, Mar. Geol., 134, 85–112, 1996.
Tseng, C. W.: Summer particulate organic carbon flux in the East China Sea. Thesis, National Taiwan Ocean University, Keelung, Taiwan, 1–43, 2010.
Tsunogai, S., Watanabe, S., and Sato, S. T.: Is there a “continental shelf pump” for the absorption of atmospheric CO2?, Tellus B, 51, 701–712, 1999.
Walsh, J. J.: How much shelf production reaches the deep sea?, in: Productivity of the Ocean: Present and Past, edited by: Berger, W. H., Smetacek, V. S., and Wefer, G., 175–191, New York, Wiley, 1989.
Wang, B.: Hydromorphologiccal mechanisms leading to hypoxia off the Changjiang estuary, Mar. Environ. Res., 67, 53–58, 2009. Wang, S. L., Chen, C. T. A., Hong, G. H., and Chung, C. S.: Carbon dioxide and related parameters in the East China Sea, Cont. Shelf Res., 20, 525–544, 2000.
Wei, C.-L., Lin, S.-Y., Sheu, D. D.-D., Chou, W.-C., Yi, M.-C., Santschi, P. H., and Wen, L.-S.: Particle-reactive radionuclides (234Th,210Pb,210) as tracers for the estimation of export pro-duction in the South China Sea, Biogeosciences, 8, 3793–3808, doi:10.5194/bg-8-3793-2011, 2011.
Xu, C., Santschi, P.H., Hung, C.-C., Zhang, S., Schwehr, K. A., Roberts, K. A., Guo, L., Gong, G.-C., Quigg, A., Long, R. A., Pinckney, J. L., Duan, S., Amon, R., and Wei, C.-L.: Controls of 234Th removal from the oligotrophic ocean by polyuronic acids and modification by microbial activity, Mar. Chem., 123, 111– 126, 2011.
Zhang, G., Wang, L., Zhang, S., and Li, X.: Geochemistry of rate earth elements in the mainstream of the Yangtze River, China, Appl. Geochem., 12, 451–462, 1998.
Zhu, Z.-Y., Zhang, J., Wu, Y., and Lin J.: Bulk particulate organic carbon in the East China Sea: Tidal influence and bottom trans-port, Prog. Oceanogr., 69, 37–60, 2006.