Gulf of Mexico
Z. Xue1, R. He1, K. Fennel2, W.-J. Cai3, S. Lohrenz4, and C. Hopkinson5
1Dept. of Marine, Earth & Atmospheric Sciences, North Carolina State University, Raleigh, NC 27695, USA 2Dept. of Oceanography, Dalhousie University, Halifax, Canada
3School of Marine Science and Policy, University of Delaware, Newark, DE 19716, USA
4School for Marine Science and Technology, University of Massachusetts Dartmouth, New Bedford, MA 02747, USA 5Dept. of Marine Sciences, University of Georgia, Athens, GA 30602, USA
Correspondence to: Z. Xue ([email protected])
Received: 8 April 2013 – Published in Biogeosciences Discuss.: 8 May 2013
Revised: 15 September 2013 – Accepted: 27 September 2013 – Published: 12 November 2013
Abstract. A three-dimensional coupled
physical-biogeochemical model is applied to simulate and examine temporal and spatial variability of circulation and biogeo-chemical cycling in the Gulf of Mexico (GoM). The model is driven by realistic atmospheric forcing, open boundary conditions from a data assimilative global ocean circulation model, and observed freshwater and terrestrial nitrogen input from major rivers. A 7 yr model hindcast (2004–2010) was performed, and validated against satellite observed sea surface height, surface chlorophyll, and in situ observations including coastal sea level, ocean temperature, salinity, and dissolved inorganic nitrogen (DIN) concentration. The model hindcast revealed clear seasonality in DIN, phytoplankton and zooplankton distributions in the GoM. An empirical orthogonal function analysis indicated a phase-locked pattern among DIN, phytoplankton and zooplankton concentrations. The GoM shelf nitrogen budget was also quantified, revealing that on an annual basis the DIN input is largely balanced by the removal through denitrification (an equivalent of∼80 % of DIN input) and offshore exports to the deep ocean (an equivalent of∼17 % of DIN input).
1 Introduction
Continental shelves are known to play an important role in global biogeochemical cycling (e.g., Liu et al., 2010) and are generally considered globally important sites of deni-trification, importers of fixed nitrogen from the open ocean
(Seitzinger et al., 2006) and exporters of organic matter (Gat-tuso et al., 1998). The magnitude of organic and inorganic matter exchange between shelves and the open ocean is a key quantity, yet hard to determine empirically; thus estimates of these fluxes in coastal ocean/marginal seas are scarce.
The focus of this study is the Gulf of Mexico (GoM here-after), which is the largest semi-enclosed marginal sea of the western Atlantic. Encompassing both eutrophic coastal wa-ters and oligotrophic deep-ocean wawa-ters, it is a very produc-tive marine ecosystem (estimated at 150–300 g C m−2yr−1;
7220 Z. Xue et al.: Modeling ocean circulation and biogeochemical variability in the GoM
Previous marine biogeochemical studies in the GoM have been mainly based on satellite sea surface temperature and ocean color (surface chlorophyll) observations. Turbid and nutrient rich freshwater from major rivers and the associated high chlorophyll coastal waters have a strong impact on the coastal ocean color variability in the GoM (Muller-Karger et al., 1991; Gilbes et al., 1996; Jolliff et al., 2003; Toner et al., 2003; Martinez-Lopez and Zavala-Hidalgo, 2009; Nababan et al., 2011), especially in regions surrounding the Missis-sippi River delta, the shelf break off Veracruz, and the Bay of Campeche. Analyses of gulf-wide, long-term satellite sea surface Temperature (SST hereafter) and ocean color data provide evidence that the GoM waters have two characteris-tic states: (1) a winter mixing period characterized by annual maxima of surface pigment concentration, and (2) a ther-mally stratified period characterized by the annual minimum of surface pigment concentration (Jolliff et al., 2008). One major limitation of satellite data is that they are insufficient to determine marine ecosystem variations in the water col-umn, and whether the spatial and temporal variability in sur-face pigment (e.g., chlorophyll) is caused by local biological effects or by three-dimensional ocean advection across large gradients. Because of the presence of relatively high concen-trations of colored dissolved organic matter (CDOM), stan-dard satellite data processing algorithms also tend to over-estimate chlorophyll concentrations in the coastal regions (Nababan et al., 2011, also see observation/model data com-parison in Sect. 3).
Ever-increasing human activities, such as shoreline de-velopment, changes in land use practices, and the result-ing increases in pollutant and nutrient/carbon input con-tinue to threaten the well-being of marine ecosystems in the GoM. Notable examples are coastal eutrophication, recurring hypoxia, a.k.a. the “dead zone” (e.g., Rabalais et al., 2002), and coastal ocean acidification (Cai et al., 2011) on the Louisiana–Texas shelf (LATEX hereafter). The Mississippi/Atchafalaya river system is the largest fluvial source in the GoM and delivers 0.11×10⁹mol yr−1 (or 1.5 million ton yr−1) nitrogen into the LATEX shelf. This ni-trogen load has tripled from the 1970s to 1990s (Goolsby et al, 2001). The primary production and CO2uptake in the
river plume has been found to be significantly correlated with increased inorganic nitrogen flux (e.g., Lohrenz et al., 1997; Guo et al., 2012). A classic explanation for the hypoxia on the LATEX shelf is that the nutrient-enhanced phytoplankton growth results in the sinking of enormous amounts of organic matter to bottom waters on the shelf. This organic matter is then decomposed microbially in the bottom water, drawing down the oxygen concentration and subsequently producing hypoxic conditions. Recent studies have shown that several other factors are also important in the formation of hypoxia (see Bianchi et al., 2010 for a detailed review). For example, Lehrter et al. (2009) reported that shelf-wide primary produc-tion was not significantly related to nutrient loading. Wise-man et al. (1997), CENR (2000), and Fennel et al. (2013)
provide evidence that the physically controlled stratification is an important process regulating hypoxia formation below the pycnocline. DiMarco et al. (2010) pointed out that spa-tial variability of dissolved oxygen concentration is closely linked to local topographic features. These recent ideas urge more comprehensive studies of physical and biogeochemical processes affecting the GoM ecosystem.
Progress in ocean modeling has made it possible to ap-ply coupled physical-biogeochemical models to realistically simulate and characterize marine ecosystem variations, and discover complex physical and biogeochemical interactions (e.g., Walsh et al., 1989). More recently, Fennel et al. (2011) successfully reproduced many features of observed nutri-ent and phytoplankton dynamics on the LATEX shelf cov-ering the period of 1990–2004. Model results showed a pos-itive correlation between phytoplankton biomass and nitro-gen loading. However, simulated phytoplankton growth rate was not correlated with nitrogen loading, suggesting that the changes in biomass may be controlled by loss processes (e.g., vertical sinking, mortality, grazing by zooplankton) as well. Fennel et al. (2013) further incorporated dissolved oxygen concentration into the coupled model and results supported the view that simulated hypoxia spatial extent is very sensi-tive to the parameterization of sediment oxygen consumption and vertical stratification.
Here we present a coupled physical-biogeochemical mod-eling study of ocean circulation and biochemical cycling for the entire GoM. Complementary to the Fennel et al. (2011) study, our work is aimed at achieving an improved under-standing of marine ecosystem variations and their relations with three-dimensional ocean circulation in a gulf-wide con-text. Our specific objectives were to (1) investigate tempo-ral and spatial variability of ocean circulation and marine ecosystem dynamics in the GoM, and (2) to quantify the ni-trogen budget of the GoM shelf.
2 Methods
2.1 Physical model
Mellor and Yamada (1982) Level 2.5 closure scheme was ap-plied to compute the vertical turbulent mixing, as well as the quadratic drag formulation for the bottom friction specifica-tion.
2.2 Biogeochemical model
The SABGOM ROMS ocean circulation model is coupled with a marine biogeochemical model described in Fennel et al. (2006, 2008, 2011). While this biogeochemical model is capable of simulating phosphate and the inorganic carbon processes in addition to nitrogen cycling, we focused on the nitrogen cycle first in this work. Omission of phosphate cy-cling is justified by results of earlier studies (e.g., Rabalais et al., 2002) that have shown that the primary production on the LATEX shelf is typically nitrogen-limited during the low dis-charge season, and that dissolved NOx: PO4ratios are often
higher than the 16 : 1 “Redfield ratio” (Lohrenz et al., 2008; Lohrenz et al., 1997; Lohrenz et al., 1999). An understanding of the role of phosphate and how its rapid recycling affects regional marine ecosystem processes warrants more detailed study (e.g., Laurent et al., 2012 for the LATEX shelf). How-ever, here we focus on nitrogen and will report on the role of phosphate in a future correspondence.
The nitrogen cycling model has seven state variables: two species of dissolved inorganic nitrogen (DIN hereafter, ni-trate (NO3) and ammonium (NH4)), one functional
phyto-plankton group, chlorophyll as a separate state variable to al-low for photoacclimation, one functional zooplankton group, and two pools of detritus representing large, fast-sinking par-ticles, and suspended, small particles. The sediment com-ponent of the biogeochemical model is a simplified repre-sentation of benthic remineralization processes, where the flux of sinking organic matter out of the bottommost grid box results immediately in a corresponding influx of am-monium at the sediment–water interface. The parameteriza-tion accounts for the loss of fixed nitrogen through sediment denitrification based on the linear relationship between sed-iment oxygen consumption and denitrification reported by Seitzinger and Giblin (1996) and only accounts for the por-tion of denitrificapor-tion that is supported by nitrificapor-tion of am-monium in the sediment (referred to as coupled nitrification– denitrification).
sissippi and Atchafalaya rivers in particular, we also consid-ered riverine particulate organic nitrogen (PON hereafter) ex-port, which was determined as the difference between total unfiltered Kjeldahl nitrogen and NH4(Fennel et al., 2011).
The PON flux for other rivers was assigned a small, pos-itive value as no continuous Kjeldahl nitrogen observation was available.
Similar to the LATEX model simulation reported by Fen-nel et al. (2011), we specified SABGOM initial and boundary conditions of NO3using World Ocean Atlas data (Garcia et
al., 2010). Other variables (NH4, phytoplankton, chlorophyll,
zooplankton, small and large particles) were initialized with small, positive values over the entire domain. Biogeochemi-cal model parameters (i.e., phytoplankton growth/loss rates, remineralization and light attenuation) were chosen as those used in Fennel et al. (2006, 2011).
We performed a 7 yr (1 January 2004–31 December 2010) regional ocean circulation and marine ecosystem hindcast. The first year was used to spin up the biogeochemical model. Analyses described in the following sections focus on the next 6 yr period between 1 January 2005 and 31 December 2010.
One of the analyses to be discussed later in the text in-volves quantifying along-shelf and cross-shelf exchange of water and nitrogen (DIN and PON). Compared with hori-zontal advection, diffusion plays only a minor role in nu-trient exchanges in the open ocean (Fasham et al., 1993; McGillicuddy et al., 2003). Considering this, the cross-shelf and along-shelf exchange was estimated using the mean ve-locity and DIN/PON concentration fields (averaged inter-nally through all steps within a month) of the 72 months dur-ing 2005–2010. We first decomposed the model simulated velocity fields into along and across 50 m isobath directions, then the cross-shelf and along-shelf nitrogen fluxes were cal-culated according to the equations below:
Eh= 0
Z
−50
Uh(z)×N (z)·dzwhereUh=proj1hU, (1)
Et= 0
Z
−50
7222 Z. Xue et al.: Modeling ocean circulation and biogeochemical variability in the GoM
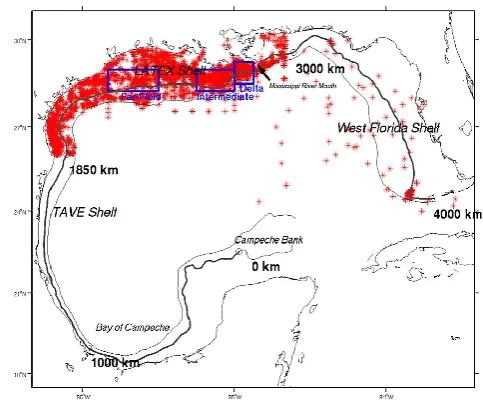
Fig. 1. The SABGOM ROMS model domain overlaid with water depth (color-shading), location of 13 tidal stations (black triangles), and a schematic circulation pattern.
Here Eh and Et are the nitrogen transport fluxes (unit:
mmol N s−1m−1) across and along isobaths, respectively,Uh
andUt are the normal and tangential components of the
ve-locity along the isobath (unit: m s−1), respectively,N is the DIN (NO3 and NH4 combined) and PON (phytoplankton,
zooplankton, and small and large detritus combined) concen-tration at a given depth (unit: mmol N m−3), and zis water depth (unit: m).
3 Model–data comparisons
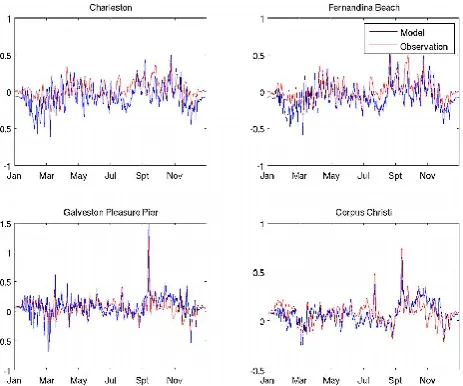
[image:4.595.45.289.62.259.2]Model-simulated physical and biogeochemical variables were validated against extensive satellite and in situ obser-vations (see Figs. 1 and 2 for positions of coastal sea level stations and ship surveys). Hourly coastal sea level obser-vations were obtained from 13 tidal gauges operated by the NOAA National Ocean Service/Center for Operational Oceanographic Products and Services (NOS/CO-OPS). We were especially interested in the model skill in resolving sub-tidal circulation processes because they dominate material property transport in the ocean. As such, a 36 h low pass filter was applied to both observed and modeled sea level time se-ries to facilitate comparisons. An example of this can be seen in Fig. 3, which shows the comparisons between observed and modeled subtidal sea levels in 2008 at Charleston, Fer-nandina Beach, Galveston, and Corpus Christi. At all these locations, the modeled sea level time series track their ob-servational counterparts reasonably well. Both the seasonal trend and synoptic storm surge events (as results of hurri-canes) are well reproduced. A more robust statistical assess-ment of the model skill over the entire 7 yr hindcast period is shown in the form of a Taylor diagram (Fig. 4; Taylor, 2001),
Fig. 2. Locations (star) of in situ ship survey data. Also shown are the 50 and 200 m isobaths in the Gulf of Mexico, and the lo-cation of three subregions: Delta, Intermediate, and Far-field. Us-ing the 50 m isobath as the boundary between the inner shelf and deep ocean (∼4000 km long), we divide the shelf areas in the gulf into 4 major sections (see Fig. 2): (1) the Bay of Campeche shelf (bounded by the 50 m isobath between 0 and 1000 km starting from the Campeche Bank, (2) the Tamaulipas–Veracruz shelf (bounded by the 50 m isobath between 1000 and 1850 km), (3) the LATEX shelf (bounded by the 50 m isobath between 1850 and 3000 km), and (4) the West Florida Shelf (bounded by the 50 m isobath be-tween 3000 and 4000 km).
where correlation coefficients, centered root mean square dif-ference (RMSD) between observed and simulated subtidal sea level, and their normalized standard deviations are all present in a single plot. At most of the 13 coastal stations mentioned above, the correlation coefficients between simu-lated and observed sea level range between 0.7 and 0.95, and the simulated sea levels are within one standard deviation of the observed values.
In a gulf-wide spatial context, we compared eddy kinetic energy (EKE hereafter) derived from satellite altimetry ob-servations (AVISO sea surface height) with model-simulated EKE. Reasonably good agreement was found between the satellite- and model-derived multiyear mean (2004–2010) EKE (Fig. 5), an indication that the model is capable of re-producing gulf-wide sea-level and associated circulation and EKE distributions. It is not surprising to see that high EKE values were associated with the LC and its adjacent eddies in the GoM while the shelf regions (e.g., west Florida shelf, LATEX shelf) generally had low EKE.
Fig. 3. Comparisons between observed and simulated sea-level time series at four tidal stations in 2008.
Fig. 4. Taylor diagram for model simulated and observed sea-level anomaly at 13 tidal stations from 2004 to 2010. Radial distance represents the ratio of simulated to observed standard deviations, and azimuthal angle represents model–data correlation. Green arcs represent centered root mean square difference between model and data.
Lehrter et al., 2009, 2012; Lohrenz et al., 2008; Cai et al., 2011; Huang et al., 2012; Louisiana Universities Ma-rine Consortium; Rabalais et al., 2007; Mechanisms Con-trolling Hypoxia (MCH) Project; Southeast Monitoring and Assessment Program (SEAMAP); the NSF-funded GulfCar-bon Project and Mississippi–Atchafalaya–Gulf of Mexico Mixing Experiment (MMAGMIX)). Together, there are more than 8000 surface observations of water temperature,
salin-Fig. 5. Comparison of 7 yr (2004–2010) mean eddy kinetic energy calculated based on (a) AVISO SSH observation and (b) SABGOM model simulated SSH.
ity, NO3, NH4, and chlorophyll concentrations. To avoid the
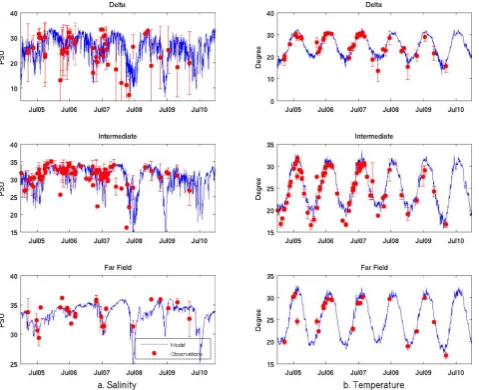
scale mismatch between in situ point measurements and our 5 km model grid resolution, we followed the approach used in Fennel et al. (2011), and divided the northern gulf area into three subregions (i.e., Delta, Intermediate, and Far-field, see Fig. 2). Observed and modeled (both are surface values unless otherwise stated) variables that fell into each subre-gion were spatially averaged. The resulting time series com-parisons were used to evaluate the model’s skill in predict-ing each state variable under consideration. Figures 6 and 7 show the comparisons between observed and simulated sea surface salinity (Fig. 6a), surface temperature (Fig. 6b), NO3 (Fig. 7a), and chlorophyll concentration (Fig. 7b). For
chlorophyll, we also acquired Moderate Resolution Imag-ing Spectroradiometer (MODIS hereafter) satellite-derived monthly mean time series for the comparison in each of the three subregions. The model reproduced both seasonal and interannual variations of salinity, temperature, NO3, and
chlorophyll concentration reasonably well. Simulated values generally fell within the 1 standard deviation range of cor-responding observations. Surface temperature and salinity in all three subregions were characterized by clear seasonal cy-cles. We note that the model underpredicted a sharp salinity drop in spring–summer 2008, which was induced by the Mis-sissippi River flooding during that year (White, el al., 2009; also see freshwater discharge time series in Fig. 9a). This was likely due to small-scale variability in the Mississippi– Atchafalaya river plume structure that was not fully resolved by our 5 km resolution model.
Seasonal patterns of NO3and chlorophyll concentrations
were similar. In general, these variables peaked in late spring–early summer (April–July) when riverine discharge was highest. The influence of river discharge and NO3
[image:5.595.51.285.308.526.2]7224 Z. Xue et al.: Modeling ocean circulation and biogeochemical variability in the GoM
41 Fig. 6 Time series comparisons between observed and simulated a) sea surface salinity
(left panels) and b) sea surface temperature (right panels) in 2005-2010. Results are
presented for each of three sub-regions illustrated in Fig.2. Blue lines are simulated
values and filled red circles are observed values. Error bars stand for one standard
deviation of available observations.
Fig. 6. Time series comparisons between observed and simulated (a) sea surface salinity (left panels) and (b) sea surface temperature (right panels) in 2005–2010. Results are presented for each of three subregions illustrated in Fig. 2. Blue lines are simulated values and filled red circles are observed values. Error bars stand for one stan-dard deviation of available observations.
variations, but generally overestimated the concentrations measured in situ. This was not surprising because MODIS estimates of chlorophyll were likely influenced by other op-tical constituents including suspended sediment and CDOM (e.g., Nababan et al., 2011). Nevertheless, MODIS imagery provided valuable information about the spatial distribution of surface chlorophyll, allowing the examination of model skill over the entire gulf, as can been seen for the comparison of seasonal means of observed and simulated surface chloro-phyll fields (Fig. 8). These means were calculated by averag-ing MODIS-derived and model-simulated chlorophyll con-centration, respectively over a 6 yr period (2005–2010). The spatial correlation coefficients between the two were 0.60, 0.65, 0.53 and 0.45 for spring, summer, fall, and winter, re-spectively, suggesting that the model has intrinsic capability to reproduce the temporal and spatial variations of surface chlorophyll. Both MODIS data and model simulation show that high chlorophyll concentrations were present in coastal areas adjacent to major rivers, such as the LATEX shelf, the Bay of Campeche and Campeche Bank. The chlorophyll content was much lower in the deep ocean. In general, the surface chlorophyll concentration was higher in winter and spring than in summer and fall.
In summary, all the above-mentioned compar-isons (Figs. 3–8) indicate that our coupled physical-biogeochemical model is capable of resolving the main spatiotemporal variations of circulation and biogeochemical variables in the GoM, providing confidence in our approach to use the 7 yr hindcast to further characterize the temporal
[image:6.595.308.548.63.259.2]42 Fig.7 Time series comparison between observed and simulated (similar to Fig. 6) (a)
nitrate (left panel) and (b) chlorophyll (right panels). For chlorophyll comparison,
MODIS monthly mean pigment concentration data (pink line) are also shown for each of
three regions.
Fig. 7. Time series comparison between observed and simulated (similar to Fig. 6) (a) nitrate (left panel) and (b) chlorophyll (right panels). For chlorophyll comparison, MODIS monthly mean pig-ment concentration data (pink line) are also shown for each of three regions.
and spatial variability of physical and biogeochemical dynamics over the entire gulf.
4 Results and discussion
4.1 Nutrient, phytoplankton, and zooplankton
dynamics
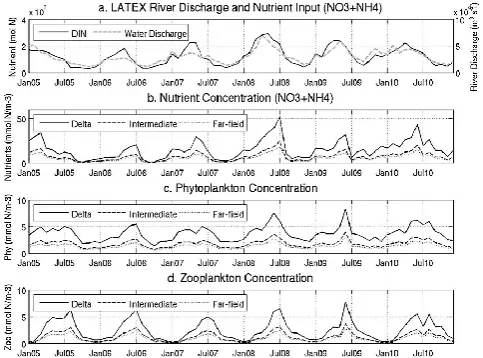
The Mississippi–Atchafalaya river system provides the ma-jority of the nutrient loading on the LATEX shelf (Walsh et al., 1989; Turner and Rabalais, 1999). In our 7 yr sim-ulation, we found riverine DIN input on the LATEX shelf accounts for ∼80 % of the total DIN loading in the GoM (108.86 and 135.87×10⁹mol N yr−1, Table 2). We first ex-amine the correlations among riverine input and DIN, phy-toplankton, and zooplankton concentrations on the LATEX shelf. We note that our simulation spans 2004–2010. It par-tially overlaps with the modeling period (1990–2004) of Fen-nel et al. (2011), allowing some comparisons to be drawn be-tween the two studies.
[image:6.595.49.289.64.259.2]Fig. 8. Comparison of simulated (left panels) and MODIS observed (right panels) seasonal mean surface chlorophyll. Also shown in each panel are 50 (labeled with distance) and 200 m isobaths.
two months. DIN, phytoplankton and zooplankton concen-trations were characterized by a clear decreasing trend from Delta to Intermediate, and further to the Far-field region. The correlation coefficient between the riverine input and coastal DIN concentration time series was 0.85 for the Delta, 0.67 for the Intermediate regions, and 0.27 for the Far-field region. The significant reduction in correlation in the Far-field region was consistent with the findings of Lehrter et al. (2009), who reported that there was no clear relationship between Missis-sippi River nutrient loading and regional–wide primary pro-duction on the LATEX shelf.
The influence of river plumes is typically limited to the inner–mid shelf (<50 m water depth) in the GoM (e.g., Morey et al., 2003). Both satellite-derived and model-simulated surface chlorophyll maps (Fig. 8) are consistent with the presence of high chlorophyll concentration mainly located near the coast. In the following section, we separate the gulf into shelf and deep-ocean regions using the 50 m isobath as the demarcation line. We consider the temporal
Fig. 9. Monthly mean time series of (a) river discharge and DIN loading, (b) surface DIN concentration, (c) surface phytoplankton concentration, and (d) surface zooplankton concentration in each of the three analysis regions (Delta, Intermediate, Far-field) on the LATEX shelf.
variations of DIN, phytoplankton, and zooplankton concen-trations in each region and their dominant modes of variabil-ity.
Consistent with what we found on the LATEX shelf, DIN, phytoplankton and zooplankton concentrations in the GoM shelves are strongly correlated with coastal river in-put (Fig. 10a, correlation coefficient: 0.91). The maximum riverine freshwater and DIN input was seen in July 2008 (largely contributed by the 2008 Mississippi River flooding), along with high DIN, phytoplankton and zooplankton con-centrations on the shelf. Surface DIN concon-centrations in the deep ocean were limited (to∼1/10 of the inner shelf) and showed no clear correlation with riverine input. The only ex-ception to this was in summer 2008 when DIN values peaked in association with the flooding of Mississippi River, which increased DIN loading and contributed to higher DIN con-centrations offshore. Unlike on the shelf, DIN concentra-tions in the deep ocean were seen to increase around Jan-uary when wind mixing was stronger (Jolliff et al., 2008). A high DIN peak appeared around February 2010, which was also observed during a March 2010 cruise and was re-lated to wind-driven transport of the plume to normally olig-otrophic offshore waters (Huang et al., in press). Because of the enhanced biological activity as a result of plume trans-port, an unusually high CO2sink was also observed during
that cruise. Surface phytoplankton concentrations in the deep ocean were ∼0.5 mmol N m−3, about 50 % of that on the
[image:7.595.49.290.64.427.2]7226 Z. Xue et al.: Modeling ocean circulation and biogeochemical variability in the GoM
Fig. 10. Monthly mean time series of (a) river discharge and DIN loading, (b) surface DIN concentration, (c) surface phytoplankton concentration, and (d) surface zooplankton concentration on the shelf, and deep-sea areas over the entire gulf.
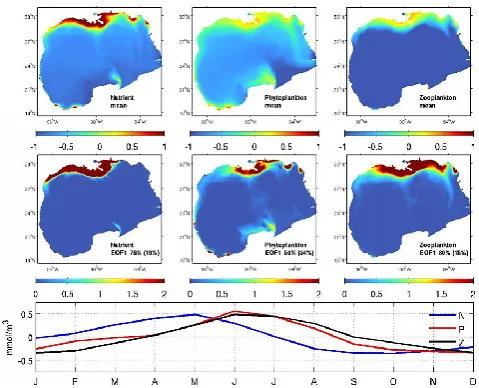
To quantify the intrinsic linkages between DIN, phyto-plankton and zoophyto-plankton variability, we removed their mul-tiyear mean (2005–2010) and applied an empirical orthogo-nal function (EOF) aorthogo-nalysis to their residuals. The temporal mean DIN and phytoplankton fields resembled each other, both showing high values on the shelf (Fig. 11, upper pan-els). The mean zooplankton concentrations were elevated in the northern GoM. The first EOF mode of the DIN, phyto-plankton, and zooplankton accounted for 76, 50, and 80 % of their respective variance. Their corresponding first princi-pal components (PC1s) displayed clear seasonal cycles. DIN, phytoplankton, and zooplankton concentrations each reached their peak values in May–June, June, June–July, respectively. Together, surface DIN, phytoplankton and zooplankton con-centrations showed a phase-locked pattern. The DIN varia-tions generally lead phytoplankton variavaria-tions by 0–1 month, which in turn lead zooplankton variations by 0–1 month. The second EOF modes of DIN, phytoplankton, and zooplankton accounted for 19, 34, and 14 % of their respective variances, representing other higher order dynamical processes.
4.2 Shelf nitrogen budget
Monthly means (averaged over 2005–2010) of simulated cross-shelf (normal components) velocity and nitrogen flux at the 50 m isobath in the gulf exhibited distinct tempo-ral patterns (Fig. 12). Although the depth integrated current shows significant variability along the 50 m isobath, both DIN and PON fluxes were dominated by an overall off-shore transport (from shelf to deep ocean; Fig. 12b–d). Com-pared with DIN, the monthly climatology of the PON flux was more similar to the cross-shelf current climatology. This may be explained by the observation that transport of PON
Fig. 11. EOF analyses of surface DIN, phytoplankton and zoo-plankton fields. Mean fields are shown in the top panels (units: mmol N m−3, log scale), the first EOF modes and the variance they account for are shown in the middle panels and their corresponding first principle components are shown in the bottom panels.
was predominantly associated with surface waters, making PON transport more sensitive to surface wind and current forcing; in contrast, the higher DIN concentrations in deep water resulted in DIN transport being more strongly influ-enced by deep water movements. A similar nitrogen trans-port pattern has also been retrans-ported in the Middle Atlantic Bight (Fennel et al., 2006). Along the 50 m isobath, substan-tial cross-shelf nitrogen exchange was found to the southeast of the Mississippi River mouth. Overall the shelf waters re-ceive 135.87×10⁹mol DIN yr−1 from rivers (estimated by river nitrogen concentration×freshwater discharge×time), and export 24.93×10⁹mol N (10.49×10⁹mol DIN and 14.44×10⁹mol PON) to the deep ocean (see: Tables 1 and 2).
The factors that determine water transport and nitrogen fluxes in the gulf can be explored by examining the shelf cir-culation and wind forcing on a region-by-region basis. To do that we generated seasonal means of surface wind and sur-face currents by averaging our 6 yr (2005–2010) model hind-cast solutions. We found that the surface wind shows a sim-ilar spatial and temporal pattern with the COADS wind cli-matology (DaSilva et al., 1994). Shelf circulation is mainly wind-driven and the circulation pattern is generally consis-tent with a previous GoM modeling study covering the pe-riod of 1994–2004 by Morey et al. (2005).
[image:8.595.48.289.62.242.2]SPRING (mmol N m−1s−1) PON 3.11 1.07 −3.19 2.48 0.17 Denitrification∗∗∗∗(mmol N m−2d−1) −0.53 −0.92 −2.49 −0.55 −1.28
SUMMER
River DIN Input (mol N m−3s−1) 1.13 0.37 5.21 0.99 7.69
Cross-shelf DIN −0.05 0.38 −0.48 −0.21 −0.12 (mmol N m−1s−1) PON −0.29 0.23 −0.19 −0.31 −0.15
Along-shelf DIN −0.27 0.25 −5.06 5.37 0.18
(mmol N m−1s−1) PON 1.96 −0.93 −2.66 4.56 0.28
Denitrification (mmol N m−2d−1) −0.74 −1.13 −2.39 −0.84 −1.4
F
ALL
River DIN Input (mol N m−3s−1) 0.58 0.21 3.75 0.5 5.04
Cross-shelf DIN −0.13 −0.07 −0.16 0.09 −0.07 (mmol N m−1s−1) PON −0.16 −0.1 0.04 0.01 −0.05
Along-shelf DIN 1.0 0.49 −2.78 1.44 0.02
(mmol N m−1s−1) PON 2.61 −0.59 −2.62 1.17 0.02
Denitrification (mmol N m−2d−1) −0.37 −0.36 −1.12 −0.64 −0.73
WINTER
River DIN Input (mol N m−3s−1) 0.80 0.29 4.25 0.70 6.04
Cross-shelf DIN −0.02 −0.22 −0.24 0.03 −0.11 (mmol N m−1s−1) PON −0.16 −0.17 −0.05 −0.04 −0.1
Along-shelf DIN 0.08 2.78 −5.61 2.89 0.05
(mmol N m−1s−1) PON 0.86 1.77 −4.44 2.44 0.08
Denitrification (mmol N m−2d−1) −0.28 −0.45 −1.36 −0.52 −0.76
ANNU
AL
River DIN Input (mol N m−3s−1) 0.86 0.30 4.63 0.74 6.53
Cross-shelf DIN −0.04 0.05 −0.28 0 −0.08
(mmol N m−1s−1) PON −0.21 −0.04 −0.08 −0.13 −0.11
Along-shelf DIN 0.23 1.04 −4.0 2.96 0.23
(mmol N m−1s−1) PON 2.14 0.33 −3.23 2.67 1.90
Denitrification (mmol N m−2d−1) −0.48 −0.72 −1.84 −0.64 −1.04
∗Shelf abbreviations: BOC shelf: Bay of Campeche, TAVE: Tamaulipas–Veracruz shelf, LATEX: Louisiana–Texas shelf, WFS: West Florida Shelf.
∗∗Mean value through the water column along 50 m isobath, for cross-shelf DIN/PON transport, +: onshore,−: offshore. ∗∗∗Mean value through the water column along 50 m isobath, for along-shelf DIN/PON transport, +: net gain,−: net loss. ∗∗∗∗Denitrification rates are spatially averaged on the sediment–water interface within a given region, presented in negative values as it is a nitrogen removal process.
shelf hereafter, bounded by the 50 m isobath between 1000 and 1850 km, Fig. 14), (3) the LATEX shelf (bounded by the 50 m isobath between 1850 and 3000 km, Fig. 15), and (4) the West Florida Shelf (WFS hereafter, bounded by the
[image:9.595.124.472.82.587.2]7228 Z. Xue et al.: Modeling ocean circulation and biogeochemical variability in the GoM
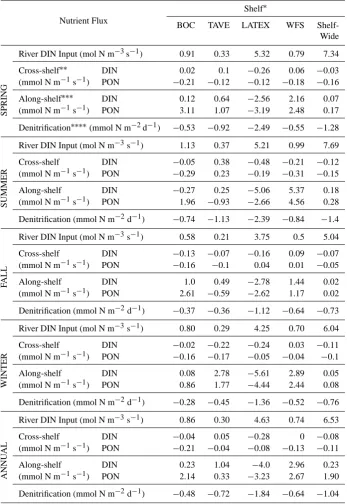
Table 2. River, cross-shelf (at 50 m isobath), along-shelf, and denitrification budget in the inner shelf.
Nutrient Budget (109mol N yr−1)
Shelf∗
BOC TAVE LATEX WFS
Shelf-Wide
SPRING
River DIN Input 1.41 0.26 42.68 2.08 46.42
Cross-shelf∗∗ DIN 0.14 0.66 −2.32 0.5 −1.02 PON −1.68 −0.8 −1.05 −1.39 −4.93
Along-shelf∗∗∗ DIN 0.32 0.25 −2.15 1.87 0.29
PON 3.06 0.44 −2.64 2.12 2.98
Denitrification∗∗∗∗ −3.56 −2.0 −24.93 −5.28 −35.77
SUMMER
River DIN Input 4.30 0.59 26.31 7.27 38.47
Cross-shelf DIN −0.37 2.52 −4.28 −1.63 −3.77 PON −2.24 1.55 −1.69 −2.46 −4.85
Along-shelf DIN 0.25 −0.19 −4.5 4.67 0.23
PON 2.58 −1.2 −2.81 3.91 2.48
Denitrification −4.97 −2.46 −23.87 −7.97 −39.27
F
ALL
River DIN Input 4.19 0.59 13.85 2.54 21.17
Cross-shelf DIN −0.98 −0.45 −1.44 0.72 −2.15
PON −1.23 −0.64 0.36 0.07 −1.43
Along-shelf DIN 0.2 0.79 −2.12 1.25 0.12
PON 0.65 0.78 −1.95 1.01 0.49
Denitrification −2.47 −0.79 −11.24 −6.08 20.59
WINTER
River DIN Input 2.52 0.39 26.02 0.88 29.81
Cross-shelf DIN −0.18 −1.45 −2.19 0.27 −3.55 PON −1.28 −1.15 −0.49 −0.31 −3.23
Along-shelf DIN 0.2 1.68 −4.28 2.45 0.05
PON 0.74 1.14 −3.46 1.98 0.4
Denitrification −1.86 −0.99 −13.61 −4.94 −21.4
ANNU
AL
River DIN Input 12.42 1.83 108.86 12.76 135.87
Cross-shelf DIN −1.4 1.28 −10.23 −0.14 −10.49 PON −6.43 −1.04 −2.87 −4.1 −14.44
Along-shelf DIN 0.97 2.52 −13.05 10.23 0.67
PON 7.03 1.15 −10.68 9.02 6.34
Denitrification −12.85 −6.25 −73.66 −24.27 −117.04
∗Shelf abbreviations: BOC: Bay of Campeche shelf, TAVE: Tamaulipas–Veracruz shelf, LATEX: Louisiana–Texas shelf, WFS: West Florida Shelf.
∗∗Mean value through the water column along 50 m isobath, for cross-shelf DIN/PON transport, +: onshore,−: offshore.
∗∗∗Mean value through the water column along 50 m isobath, for along-shelf DIN/PON transport, +: net gain,−: net loss.
∗∗∗∗Denitrification rates are spatially averaged on the sediment–water interface within a given region, presented in negative values as it is a nitrogen removal process.
riverine nutrient input into the model domain (US rivers are based on USGS observation, and Mexican and Cuban rivers are based on climatology, see the Methods section for more details), denitrification (coupled nitrification/denitrification),
Fig. 12. Depth-integrated monthly mean cross-shelf (a) velocity, (b) DIN flux, (c) PON flux and (d) annual mean DIN and PON flux cross the 50 m isobath. Positive/negative values stand for shore-ward/seaward transport.
4.2.1 BOC shelf
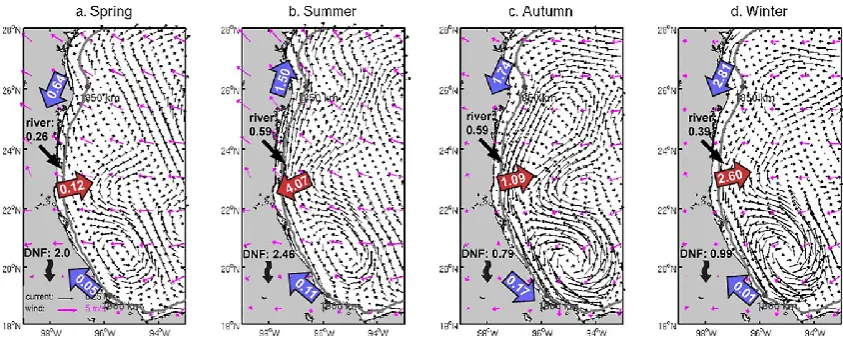
BOC is the southernmost semi-enclosed region in the GoM. Estimated nitrogen loading was 12.42×10⁹mol N yr−1 (Ta-bles 1 and 2), the majority of which was discharged by the Usumacinta River. Mean (averaged over 2005–2010) nitrogen loading in spring, summer, fall, and winter were 1.41, 4.30, 4.19 and 2.52×10⁹mol N respectively. Consis-tent with findings of earlier studies (Zavala-Hidalgo et al., 2003; Morey et al., 2005), our results identify two prevail-ing circulation patterns in the BOC. In the northeast, up-welling favorable winds and upcoast currents (flowing in the direction with coast to the left) occupy the Campeche Bank throughout the year. The westward winds and associ-ated current induced significant along-shelf transport, bring-ing 8.40×10⁹mol N yr−1(DIN and PON combined, unless otherwise indicated) into the BOC at the east end of the BOC shelf (Fig. 13). West of the Campeche Bank the coast-line is directed north–south, thus the westward current in-duced an overall offshore nitrogen flux throughout the year (7.82×10⁹mol N yr−1). In the center of the BOC, there is a permanent wind-driven cyclonic circulation (Vazquez de la Cerda et al., 2005), which tends to increase during au-tumn to winter months. At the same time, a strong down-coast (flowing in the direction with down-coast to the right) current traveled into the southernmost part of the BOC (Fig. 13c), causing a local convergence on the inner shelf. This along-shelf current transported 0.17×10⁹mol N from the TAVE shelf to the BOC shelf. In the following winter, spring, and summer months, offshore cyclonic circulation weakened, while the upcoast current from the Campeche Bank gradually strengthened (Fig. 13a, b, d), transporting 0.17×10⁹mol N
Fig. 13. Seasonal mean surface current and wind fields in the BOC shelf in (a) spring, (b) summer, (c) autumn, and (d) winter. Also shown is regional along-shelf nitrogen transport (blue arrows, unit: 109mol N), cross-shelf nitrogen transport (red arrows, unit: 109mol N), river inputs (unit: 109mol N) and nitrogen removed by denitrification (DNF, unit: 109mol N), and 50 m isobath (grey line).
back to the TAVE shelf (winter, spring, and summer months combined). The BOC had the smallest denitrification rate among the four shelf sections (0.48 mmol N m−2d−1, mul-tiyear mean, Table 2). The rate peaks during summer months (0.78 mmol N m−2d−1). The total amount of the DIN
re-moved by denitrification was 12.85×10⁹mol N yr−1, which
closely balanced the nitrogen loading from local rivers.
4.2.2 TAVE shelf
[image:11.595.49.287.64.251.2]7230 Z. Xue et al.: Modeling ocean circulation and biogeochemical variability in the GoM
Fig. 14. Similar to Fig. 13 but for the TAVE shelf.
offshore nitrogen flux in fall and winter, which amounted to 3.69×10⁹mol N to the deep sea. Due to the limited width, denitrification on the TAVE shelf was smallest among the four shelf sections (6.25×10⁹mol N yr−1, Table 2).
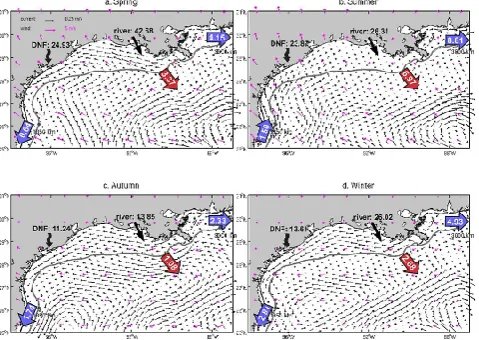
4.2.3 LATEX shelf
Our calculations indicated that the LATEX shelf received 0.78 billion tons of freshwater and 108.86×10⁹mol N annu-ally (averaged over 2005–2010). More than 90 % of these river inputs were from the Mississippi–Atchafalaya river system, which had peak discharge values in spring months (42.68×10⁹mol N, Tables 1 and 2). Despite the large river-ine input, the multiyear mean net flux calculation indicated 73.66×10⁹mol N was denitrified on the inner shelf, which is an equivalent of ∼67.7 % of the riverine nitrogen (Ta-ble 2). 23.73×10⁹mol N yr−1, an equivalent of ∼21.7 % of the riverine nitrogen, was transported to either the TAVE shelf in the west or the WFS in the east through along-shelf flows; 13.1×10⁹mol N yr−1, an equivalent of∼12.0 % of the riverine input was exported offshore to the deep ocean, mainly in association with waters southwest of the Missis-sippi River delta (Figs. 8, 15).
Our simulation results support other observations that the inner LATEX shelf is dominated by downcoast winds in non-summer months (e.g., Cho et al., 1998; Zavala-Hidalgo et al., 2003; Morey et al., 2005; Fig. 15a, c, d). The corre-lation between monthly averaged currents and along-shelf wind stress was positive and highly significant (Nowlin et al., 2005). In spring, the upcoast currents from the north-ern TAVE shelf encountered the downcoast currents from the LATEX shelf, forming a confluence zone and a high chloro-phyll anomaly can also be seen in the monthly climatology of SeaWiFS ocean color maps (Martinez-Lopez and Zavala-Hidalgo, 2009). However, no prominent offshore transport was seen in either seasonal chlorophyll climatology (Fig. 8) or cross-shelf velocity (Fig. 12a) at this location.
The outer LATEX shelf is more influenced by its interac-tion with LC eddies (e.g., Ohlmann et al., 2001; Nowlin et al., 2005), which can bring large temporal and spatial vari-ability to the current fields along the 50 m isobath. Despite such variability, strong offshore nitrogen export was seen in areas around the Mississippi Delta almost throughout the year (Fig. 12). In addition to offshore export, the LATEX shelf continuously delivered nitrogen to the adjacent TAVE shelf (5.19×10⁹mol N, fall, winter, and spring combined) and WFS (20.22×10⁹mol N yr−1) throughout most of the year. As previously described, westward along-shelf flow on the western LATEX shelf during non-summer months continuously transported nitrogen to the TAVE shelf. The only exception was during summer months when the winds changed to northwestward, and currents on the western LA-TEX shelf shifted to the upcoast direction (Fig. 15b). East of the Mississippi Delta, the along-shelf currents also flowed eastward, transporting materials from the LATEX shelf to the WFS. This nitrogen flux reached its annual maximum (8.81×10⁹mol N) in summer.
4.2.4 WFS
Circulation of the WFS is influenced by both local and deep–ocean LC forcing. Our 6 yr mean wind and surface current fields (Fig. 16) reproduced many known features identified in earlier studies (e.g., He and Weisberg, 2002, 2003; Weisberg et al., 2005). Annual riverine nitrogen in-put (12.76×10⁹mol N yr−1) to the WFS was comparable
to that to the BOC shelf (12.42×10⁹mol N yr−1, Table 2).
Fig. 15. Similar to Fig. 13 but for the LATEX shelf.
a large amount of low salinity water from the Mississippi River during summer months (e.g., Morey et al., 2003, 2005). A low salinity “tongue” is formed as a result of intensive cross-shelf freshwater export (e.g., Morey et al., 2003) and can be identified as a patch of high chlorophyll waters flow-ing to the south/southeast (Fig. 8). The 6 yr mean offshore nitrogen flux was 4.24×10⁹mol N yr−1. Unlike the LATEX shelf, the offshore nitrogen flux at WFS is dominated by PON export (∼96.7 %). Not surprisingly, the along-shelf nitrogen flux from the LATEX shelf (20.22×10⁹mol N yr−1) is the major nitrogen source for the WFS. Denitrification removed 24.27×10⁹mol N on the WFS annually, which is largely balanced by the combination of local river inputs and nitro-gen transported from the LATEX shelf.
4.2.5 Gulf-wide results
Our calculations show that the GoM shelves receives 142.88×10⁹mol N annually, the majority of which was input by local rivers (135.87×10⁹mol N yr−1) and the rest (7.01×10⁹mol N yr−1) is from the open ocean. On an annual basis, the magnitude of riverine input was roughly balanced by denitrification and cross-shelf export (141.97×10⁹mol N yr−1). We attribute the small resid-ual difference (0.91×10⁹mol N yr−1, or <1 % of the an-nual nitrogen input) between shelf nitrogen input and re-moval to either lateral diffusion or computational errors of the model integration. Denitrification (coupled nitrification– denitrification) accounts for over 80 % of the nitrogen re-moval from the water column (117.04×10⁹mol N yr−1).
The shelf-wide denitrification rate was estimated to be 1.04 mmol N m−2d−1, which was comparable to that in the Middle Atlantic Bight (0.92 mmol N m−2d−1, Fennel et al., 2008) and Massachusetts Bay in the Gulf of Maine (1.3 mmol N m−2d−1, Hopkinson et al., 2001). Among the four shelf sections, the LATEX shelf has the highest deni-trification rate (1.84 mmol N m−2d−1) corresponding to the
51 Fig. 16. Similar to Fig. 13 but for the West Florida Shelf.
largest local river inputs, and concomitantly the largest or-ganic N export to the bottom sediments. For both WFS and TAVE shelves, a large part of the denitrified nitrogen (both PON and DIN) was from the adjacent LATEX shelf through along-shelf transport. On the BOC shelf, aside from local river inputs, an important nitrogen source was the PON trans-ported in the along-shelf direction from waters in the east.
Our calculations also support the view that the gulf-wide mean cross-shelf nitrogen exchange between the in-ner shelf and deep ocean is seaward. On an annual ba-sis, the amount of the nitrogen exported from the shelf (24.93×10⁹mol N yr−1) was an equivalent of∼17 % of that
received from local rivers and along-shelf transport. Across-shelf nitrogen flux changes its onshore/offshore direction seasonally on the TAVE shelf and WFS, but remains persis-tently offshore on LATEX and BOC shelves.
5 Summary and conclusions
[image:13.595.306.548.65.283.2]7232 Z. Xue et al.: Modeling ocean circulation and biogeochemical variability in the GoM
then used to investigate the temporal and spatial characteris-tics of the GoM circulation and ecosystem variability.
Clear seasonality and interannual variability was seen in riverine freshwater and nitrogen input. While significant tem-poral correlations were found between riverine input and DIN concentration on the shelf, no clear correlation was seen between river loading and surface DIN concentration in the deep ocean. EOF analyses revealed that the largest variabil-ity in DIN and plankton distributions occurred in the north-ern GoM. PC1s of the EOF analyses were indicative of a phase-locked pattern common all aquatic ecosystem where DIN variations generally lead phytoplankton variations with a 0–1 month lag, which in turn lead to zooplankton variations with a further 0–1 month lag.
A shelf nitrogen budget was developed based on the multiyear mean conditions over 2005–2010. Based on our estimated flux, we concluded that riverine nitrogen input is largely balanced by the removal through denitrification. Along-shelf transport played an important role in distributing the large nitrogen load in the LATEX shelf to adjacent WFS and TAVE shelves. Persistent cross-shelf exchange was seen between the shelf and deep ocean. Regions off the BOC, Mis-sissippi River delta and in the MisMis-sissippi–Alabama–Florida junction were identified as major nitrogen export sites. On an annual basis, the amount of exported nitrogen was equivalent to 17 % of that received from rivers and along-shelf transport. Our study provides a modeling framework to examine im-portant hydrologic-physical-biogeochemical coupling pro-cesses in the GoM, allowing for an integrated understand-ing of regional marine ecosystem responses to a broad spec-trum of processes, ranging from extreme synoptic weather events (e.g., hurricanes) to climate and land use changes. We note however that the complexity of the food web and un-certainties in model parameterizations remain an active re-search topic in coupled physical-biogeochemical modeling. For instance, we have not considered the process of nitro-gen fixation process by cyanobacteria (Walsh et al., 1989; Mulholland et al., 2006) and our description of dissolved or-ganic nitrogen is still rudimentary. The lack of accounting for phosphate and silicate compartments in the ecosystem model may compromise the model’s ability and accuracy in simulat-ing phytoplankton population dynamics and the couplsimulat-ing to higher trophic levels. Improved marine biogeochemical mod-eling skill can be further achieved with refinement of model process/parameterizations and advances in observational in-frastructure (e.g., more rapid and accurate nutrient sensors) together with sophisticated techniques for data assimilation.
Acknowledgements. Research support provided through NASA grants NNX10AU06G and NNX12AP84G; NOAA grant NA11NOS0120033, and GRI GISR grant SA/GoMRI-006 is much appreciated. We thank our editor, Marilaure Grégoire, and two reviewers, Matthew Howard (TAMU) and Sergio deRada (NRL), for their constructive comments and suggestions that helped improve this manuscript. K. Chen (WHOI), Z. Yao (OUC), and Y. Li (NCSU) are also acknowledged for useful discussions.
Edited by: M. Grégoire
References
Aulenbach, B. T., Buxton, H. T., Battaglin, W. T., and Coupe, R. H.: Streamflow and nutrient fluxes of the Mississippi-Atchafalaya River Basin and subbasins for the period of record through 2005, US Geological Survey Open-File Report 2007-1080, 2007. Bianchi, T., DiMarco, S., Cowan Jr., J., Hetland, R., Chapman, P.,
Day, J., and Allison, M.: The science of hypoxia in the Northern Gulf of Mexico: a review, Sci. Total Environ., 408, 1471–1484, doi:10.1016/j.scitotenv.2009.11.047, 2010.
Cai, W.-J., Hu, X., Huang, W.-J., Murrell, M. C., Lehrter, J. C., Lohrenz, S. E., Chou, W.-C., Zhai, W., Hollibaugh, J. T., Wang, Y., Zhao, P., Guo, X., Gundersen, K., Dai, M., and Gong, G.-C.: Acidification of subsurface coastal waters enhanced by eutroph-ication, Nat. Geosci., 4, 766–770, 2011.
CENR (Committee on Environmental and Natural Resources): In-tegrated Assessment of Hypoxia in the Northern Gulf of Maxico, Washington, DC, 48, 2000.
Chassignet, E. P., Hurlburt, H. E., Smedstad, O. M., Halliwell, G. R., Hogan, P. J., Wallcraft, A. J., Baraille, R., and Bleck, R.: The HYCOM (HYbrid Coordinate Ocean Model) data assimilative system, J. Mar. Syst., 65, 60–83, 2007.
Cho, K. W., Reid, R. O., and Nowlin, W. D.: Objectively mapped stream function fields on the Texas-Louisiana shelf based on 32 months of moored current meter data, J. Geophys. Res.-Oceans, 103, 10377–10390, 1998.
DaSilva, A., Younga, A. C., and Levitus, S.: Atlas of Surface Marine Data 1994, Volume 1: Algorithms and Procedures, 1994. DiMarco, S., Nowlin, W., and Reid, R. O.: A statistical
descrip-tion of the velocity fields from upper ocean drifter in the Gulf of Mexico, in: Circulation in the Gulf of Mexico: Observations and Models, Geophys. Monogr. Ser., AGU, Washington, DC, 101– 110, 2005.
DiMarco, S. F., Chapman, P., Walker, N., and Hetland, R. D.: Does local topography control hypoxia on the eastern Texas-Louisiana shelf?, J. Mar. Syst., 80, 25–35, 2010.
Egbert, G. D. and Erofeeva, S. Y.: Efficient Inverse Modeling of Barotropic Ocean Tides, J. Atmos. Ocean. Tech., 19, 183–204, doi:10.1175/1520-0426(2002)019<0183:EIMOBO>2.0.CO;2, 2002.
Fasham, M. J. R., Sarmiento, J. L., Slater, R. D., Ducklow, H. W., and Williams, R.: Ecosystem behavior at Bermuda Station “S” and ocean weather station “India”: A general circulation model and observational analysis, Global Biogeochem. Cy., 7, 379–415, doi:10.1029/92GB02784, 1993.
R.: Sensitivity of hypoxia predictions for the northern Gulf of Mexico to sediment oxygen consumption and model nesting, J. Geophys. Res.-Oceans, 118, 990–1002, doi:10.1002/jgrc.20077, 2013.
Flather, R. A.: A tidal model of the northwest European continental shelf, Mem. Soc. R. Sci. Liege, 10, 141–164, 1976.
Fuentes-Yaco, C., de Leon, D. A. S., Monreal-Gomez, M. A., and Vera-Herrera, F.: Environmental forcing in a tropical estuarine ecosystem: the Palizada River in the southern Gulf of Mexico, Mar. Freshwater Res., 52, 735–744, 2001.
Garcia, H. E., Locarnini, R. A., Boyer, T. P., Antonov, J. I., Zweng, M. M., Baranova, O. K., and Johnson, D. R.: World Ocean At-las 2009, NOAA AtAt-las NESDIS 71, edited by: Levitus, S., US Government Printing Office, Washington DC, 398 pp., 2010. Gattuso, J. P., Frankignoulle, M., and Wollast, R.: Carbon and
Car-bonate Metabolism in Coastal Aquatic Ecosystems, Annu. Rev. Ecol. Syst., 29, 405–434, 1998.
Gilbes, F., Tomas, C., Walsh, J. J., and MullerKarger, F. E.: An episodic chlorophyll plume on the West Florida Shelf, Cont. Shelf Res., 16, 1201–1224, 1996.
Goolsby, D. A., Battaglin, W. A., Aulenbach, B. T., and Hooper, R. P.: Nitrogen input to the Gulf of Mexico, J. Environ. Qual., 30, 329–336, 2001.
Guo, X. H., Cai, W. J., Huang, W. J., Wang, Y. C., Chen, F. Z., Mur-rell, M. C., Lohrenz, S. E., Jiang, L. Q., Dai, M. H., Hartmann, J., Lin, Q., and Culp, R.: Carbon dynamics and community pro-duction in the Mississippi River plume, Limnol. Oceanogr., 57, 1–17, 2012.
Haidvogel, D. B., Arango, H., Budgell, W. P., Cornuelle, B. D., Cur-chitser, E., Di Lorenzo, E., Fennel, K., Geyer, W. R., Hermann, A. J., Lanerolle, L., Levin, J., McWilliams, J. C., Miller, A. J., Moore, A. M., Powell, T. M., Shchepetkin, A. F., Sherwood, C. R., Signell, R. P., Warner, J. C., and Wilkin, J.: Ocean forecast-ing in terrain-followforecast-ing coordinates: Formulation and skill as-sessment of the Regional Ocean Modeling System, J. Comput. Phys., 227, 3595–3624, 2008.
He, R. Y. and Weisberg, R. H.: West Florida shelf circulation and temperature budget for the 1999 spring transition, Cont. Shelf Res., 22, 719–748, 2002.
He, R. Y. and Weisberg, R. H.: West Florida shelf circulation and temperature budget for the 1998 fall transition, Cont. Shelf Res., 23, 777–800, 2003.
Heileman, S. and Rabalais, N.: XV-50 Gulf of Mexico LME, United Nations Environment Programme, Nairobi, Kenya, 673– 688, 2008.
Hyun, K. H. and He, R.: Coastal upwelling in the South Atlantic Bight: A revisit of the 2003 cold event using long term observa-tions and model hindcast soluobserva-tions, J. Mar. Syst., 83, 1–13, 2010. Jolliff, J. K., Walsh, J. J., He, R. Y., Weisberg, R., Stovall-Leonard, A., Coble, P. G., Conmy, R., Heil, C., Nababan, B., Zhang, H. Y., Hu, C. M., and Muller-Karger, F. E.: Dispersal of the Suwannee River plume over the West Florida shelf: Simula-tion and observaSimula-tion of the optical and biochemical conse-quences of a flushing event, Geophys. Res. Lett., 30, 1709, doi:10.1029/2003GL016964 2003.
Jolliff, J. K., Kindle, J. C., Penta, B., Helber, R., Lee, Z., Shul-man, I., Arnone, R., and Rowley, C. D.: On the relationship be-tween satellite-estimated bio-optical and thermal properties in the Gulf of Mexico, J. Geophys. Res.-Biogeo., 113, G01024, doi:10.1029/2006JG000373, 2008.
Laurent, A., Fennel, K., Hu, J., and Hetland, R.: Simulating the ef-fects of phosphorus limitation in the Mississippi and Atchafalaya River plumes, Biogeosciences, 9, 4707–4723, doi:10.5194/bg-9-4707-2012, 2012.
Lehrter, J. C., Murrell, M. C., and Kurtz, J.: Interactions be-tween freshwater input, light, and phytoplankton dynamics on the Louisiana continental shelf, Cont. Shelf Res., 29, 1861–1872, 2009.
Lehrter, J. C., Beddick, D. L., Devereux, R., Yates, D. F., and Mur-rell, M. C.: Sediment-water fluxes of dissolved inorganic carbon, O2, nutrients, and N2from the hypoxic region of the Louisiana
continental shelf, Biogeochemistry, 109, 233–252, 2012. Liu, K. K., Atkinson, L. P., Quinones, R., and Talaue-McManus, L.:
Carbon and Nutrient Fluxes in Continental Margins: A Global Synthesis, IGBP Book Series, Springer, Berlin, 2010.
Lohrenz, S. E., Fahnenstiel, G. L., Redalje, D. G., Lang, G. A., Chen, X. G., and Dagg, M. J.: Variations in primary production of northern Gulf of Mexico continental shelf waters linked to nu-trient inputs from the Mississippi River, Mar. Ecol.-Prog. Ser., 155, 45–54, 1997.
Lohrenz, S., Fahnenstiel, G., Redalje, D., Lang, G., Dagg, M., Whitledge, T., and Dortch, Q.: Nutrients, irradiance, and mix-ing as factors regulatmix-ing primary production in coastal waters impacted by the Mississippi River plume, Cont. Shelf Res., 19, 1113–1141, 1999.
Lohrenz, S. E., Redalje, D. G., Cai, W. J., Acker, J., and Dagg, M.: A retrospective analysis of nutrients and phytoplankton produc-tivity in the Mississippi River plume, Cont. Shelf Res., 28, 1466– 1475, 2008.
7234 Z. Xue et al.: Modeling ocean circulation and biogeochemical variability in the GoM
Martinez-Lopez, B. and Zavala-Hidalgo, J.: Seasonal and interan-nual variability of cross-shelf transports of chlorophyll in the Gulf of Mexico, J. Mar. Syst., 77, 1–20, 2009.
McGillicuddy, D. J., Anderson, L. A., Doney, S. C., and Mal-trud, M. E.: Eddy-driven sources and sinks of nutrients in the upper ocean: Results from a 0.1◦ resolution model of the North Atlantic, Global Biogeochem. Cy., 17, 1035, doi:10.1029/2002GB001987, 2003.
Mellor, G. L. and Yamada, T.: Development of a turbulence closure model for geophysical fluid problems, Rev. Geophys., 20, 851– 875, 1982.
Milliman, J. D. and Farnsworth, K. L.: River discharge to the coastal ocean : a global synthesis, Cambridge University Press, Cam-bridge, New York, viii, 384 pp., 2011.
Morey, S. L., Martin, P. J., O’Brien, J. J., Wallcraft, A. A., and Zavala-Hidalgo, J.: Export pathways for river discharged fresh water in the northern Gulf of Mexico, J. Geophys. Res.-Oceans, 108, 3303, doi:10.1029/2002JC001674, 2003.
Morey, S. L., Zavala-Hidalgo, J., and O’Brien, J. J.: The seasonal variability of continental shelf circulation in the northern and western Gulf of Mexico from a high-resolution numerical model, in: Circulation in the Gulf of Mexico: Observations and Models, Geophys. Monogr. Ser., AGU, Washington, DC, 203–218, 2005. Mulholland, M. R., Bernhardt, P. W., Heil, C. A., Bronk, D. A., and O’Neil, J. M.: Nitrogen fixation and release of fixed nitrogen by Trichodesmium spp. in the Gulf of Mexico, Limnol. Oceanogr., 51, 1762–1776, 2006.
Muller-Karger, F. E., Walsh, J. J., Evans, R. H., and Meyers, M. B.: On the Seasonal Phytoplankton Concentration and Sea-Surface Temperature Cycles of the Gulf of Mexico as Determined by Satellites, J. Geophys. Res.-Oceans, 96, 12645–12665, 1991. Nababan, B., Muller-Karger, F. E., Hu, C., and Biggs, D. C.:
Chloro-phyll variability in the northeastern Gulf of Mexico, Int. J. Re-mote Sens., 32, 8373–8391, do:10.1080/01431161.2010.542192, 2011.
Nixon, S. W., Ammerman, J. W., Atkinson, L. P., Berounsky, V. M., Billen, G., Boicourt, W. C., Boynton, W. R., Church, T. M., Ditoro, D. M., Elmgren, R., Garber, J. H., Giblin, A. E., Jahnke, R. A., Owens, N. J. P., Pilson, M. E. Q., and Seitzinger, S. P.: The fate of nitrogen and phosphorus at the land sea margin of the North Atlantic Ocean, Biogeochemistry, 35, 141–180, 1996. Nowlin, W., Jochens, A. E., DiMarco, S., Reid, R. O., and Howard,
M. K.: Low-frequency circulation over the Texas-Louisiana con-tinental shelf, in: Circulation in the Gulf of Mexico: Observa-tions and Models, Geophys. Monogr. Ser., AGU, Washington, DC, 219–240, 2005.
Ohlmann, J. C., Niiler, P. P., Fox, C. A., and Leben, R. R.: Eddy energy and shelf interactions in the Gulf of Mexico, J. Geophys. Res.-Oceans, 106, 2605–2620, 2001.
Rabalais, N., Turner, R. E., and Wiseman, W. J. J.: GULF OF MEX-ICO HYPOXIA, A.K.A. THE DEAD ZONE, Annu. Rev. Ecol. Syst., 33, 235–263, 2002.
Rabalais, N. N., Turner, R. E., Sen Gupta, B. K., Boesch, D. F., Chapman, P., and Murrell, M. C.: Hypoxia in the northern Gulf of Mexico: Does the science support the plan to reduce, mitigate, and control hypoxia?, Estuar. Coasts, 30, 753–772, 2007. Seitzinger, S. P. and Giblin, A. E.: Estimating denitrification in
North Atlantic continental shelf sediments, Biogeochemistry, 35, 235–260, 1996.
Shchepetkin, A. F. and McWilliams, J. C.: The Regional Ocean Modeling System (ROMS): a split-explicit, free-surface, topography-following coordinates ocean model, Ocean Model., 9, 347–404, 2005.
Sturges, W. and Leben, R.: Frequency of Ring Separations from the Loop Current in the Gulf of Mexico: A Revised Estimate, Journal of Physical Oceanography, 30, 1814–1819, 2000.
Taylor, K. E.: Summarizing multiple aspects of model performance in a single diagram, J. Geophys. Res., 106, 7183–7192, 2001. Toner, M., Kirwan, A. D., Poje, A. C., Kantha, L. H., Muller-Karger,
F. E., and Jones, C. K. R. T.: Chlorophyll dispersal by eddy-eddy interactions in the Gulf of Mexico, J. Geophys. Res.-Oceans, 108, 3105, doi:10.1029/2002JC001499, 2003.
Turner, R. and Rabalais, N.: Suspended particulate and dissolved nutrient loadings to Gulf of Mexico estuaries, in: Biogeochem-istry of Gulf of Mexico estuaries, edited by: Bianchi, T., Pen-nock, J., and Twilley, R., John Wiley & Sons, Inc., New York, 1999.
Vazquez de la Cerda, A. M., Reid, R. O., DiMarco, S. F., and Jochens, A. E.: Bay of Campeche circulation: An update, in: Cir-culation in the Gulf of Mexico: Observations and Models, Geo-phys. Monogr. Ser., AGU, Washington, DC, 279–293, 2005. Walsh, J. J., Dieterle, D. A., Meyers, M. B., and Muller-Karger,
F. E.: Nitrogen exchange at the continental margin: A numeri-cal study of the Gulf of Mexico, Progr. Oceanogr., 23, 245–301, 1989.
Weisberg, R., He, R. Y., Liu, Y. G., and Virmani, J. I.: West Florida Shelf circulation on synoptic, seasonal, and Interannual time scales, in: Circulation in the Gulf of Mexico: Observations and Models, Geophys. Monogr. Ser., AGU, Washington, DC, 325– 347, 2005.
White, J. R., Fulweiler, R. W., Li, C. Y., Bargu, S., Walker, N. D., Twilley, R. R., and Green, S. E.: Mississippi River Flood of 2008: Observations of a Large Freshwater Diversion on Physical, Chemical, and Biological Characteristics of a Shal-low Estuarine Lake, Environ. Sci. Technol., 43, 5599–5604, doi:10.1021/es900318t, 2009.
Wiseman, W. J., Rabalais, N. N., Turner, R. E., Dinnel, S. P., and MacNaughton, A.: Seasonal and interannual variability within the Louisiana coastal current: stratification and hypoxia, J. Mar. Syst., 12, 237–248, 1997.