www.biogeosciences.net/11/6483/2014/ doi:10.5194/bg-11-6483-2014
© Author(s) 2014. CC Attribution 3.0 License.
Forest conversion to poplar plantation in a Lombardy floodplain
(Italy): effects on soil organic carbon stock
C. Ferré1, R. Comolli1, A. Leip2, and G. Seufert2
1Department of Earth and Environmental Sciences, Milano Bicocca University, Milan, Italy 2European Commission, Joint Research Centre (JRC), Institute for Environment and Sustainability,
Ispra (VA), Italy
Correspondence to: G. Seufert (guenther.seufert@jrc.ec.europa.eu)
Received: 12 March 2014 – Published in Biogeosciences Discuss.: 20 June 2014
Revised: 13 September 2014 – Accepted: 9 October 2014 – Published: 27 November 2014
Abstract. Effects of forest conversion to poplar plantation on soil organic carbon (SOC) stocks were investigated by sampling paired plots in an alluvial area of the Ticino River in Northern Italy. According to land registers and historical aerial photographs, the two sites were part of a larger area of a 200 yr old natural forest that was partly converted to poplar plantation in 1973. The soil sampling of three layers down to a depth of 100 cm was performed at 90 and 70 points in the natural forest (NF) and in the nearby poplar plantation (PP) respectively. The substitution of the natural forest with the poplar plantation strongly modified soil C stock down to a depth of 55 cm, although the management practices at PP were not intensive. After calculation of equivalent soil masses and of SOC stocks in individual texture classes, the comparison of C stocks showed an overall decrease in SOC of 5.7 kg m−2or 40 % in consequence of 37 years of poplar cultivation.
Our case study provides further evidence that (i) spatial heterogeneity of SOC is an important feature in paired plot studies requiring a careful sampling strategy and high enough number of samples; (ii) land use changes through tillage are creating a more homogeneous spatial structure of soil prop-erties and may require the application of dedicated spatial statistics to tackle eventual problems of pseudo-replicates and auto-correlation; (iii) short rotation forests are not prop-erly represented in current reporting schemes for changes of SOC after land use change and may better be considered as cropland.
1 Introduction
Soils play an important role in the global carbon cycle rep-resenting the major midterm reservoir of organic carbon from photosynthesis. The global reservoir of soil organic car-bon (SOC) is estimated to be 1500–2000 Gt C compared to 500–700 Gt C in the biomass (IPCC, 2000; Lal, 2004). Con-sidering an atmospheric reservoir of 760 Gt C as CO2, a 5 %
shift in SOC stocks in global soils might change atmospheric CO2by up to 16 % (Baldock, 2007). Globally, the annual
car-bon uptake in gross primary production of the terrestrial bio-sphere is estimated at 120 Gt C. At the timescale of decades, almost all assimilated CO2 flows back into the atmosphere
due to major losses by plant respiration, decomposition and natural disturbances, and only about 1 Gt C is stored annually as net biome production mainly in the soil (IPCC, 2000), in-dicating that accumulation of current SOC is a very slow pro-cess extending over centuries, whereas losses of SOC can be very fast (Schmidt et al., 2011).
Land use has always reduced the amount of organic car-bon accumulated by natural terrestrial ecosystems, but the losses since 1850 are estimated to be larger than during all periods of human activity before (Houghton, 2012). Global losses of terrestrial organic carbon in the period 1850–2000 were estimated at 156 Gt, mainly from tropical deforesta-tion, with a contribution of 3/4 from biomass and 1/4 from soil (Houghton, 2003). Soil carbon losses can be attributed mainly to agricultural activities such as drainage, tillage and elevated extraction of biomass; the basic underlying process is a combination of enhanced reduction of the SOC reser-voirs by decomposition, leaching, soil erosion and reduced
input of organic matter with plant/root litter and rhizodeposi-tion (Schmidt et al., 2011; Poeplau et al., 2011). A reducrhizodeposi-tion in SOC is linked to a general degradation of chemical, phys-ical and biologphys-ical soil properties, with the overall effect of reduced fertility, biodiversity and resilience of the ecosystem (Nieder and Benbi, 2008).
Consequently, the protection of soil organic matter (SOM) is considered in various policies and strategies; in the Euro-pean Union, the “Soil Thematic Strategy” (COM (2006) 232) has established common principles to maintain and increase levels of organic matter and to protect the main soil functions from a series of environmental stressors. In the context of in-ventories of emissions and sinks of greenhouse gases under UNFCCC and its Kyoto Protocol, the stock changes of SOC need to be reported annually by all Parties under the cate-gory Land Use, Land Use Change and Forestry (LULUCF); however, neither soil carbon stocks, nor their changes can be measured easily (Schrumpf et al., 2011), and there are very few data available from replicate SOC inventories like the ones taken in 1978 and 2003 by Bellamy et al. (2005) across England and Wales allowing a direct estimate of impacts of land use change on SOC.
Therefore, for assessing the impact of various land use changes on SOC we mainly rely on space for time substitute studies following a paired plot or chronosequence design like the one of Poeplau and Don (2013); hundreds of such stud-ies covering various land use changes have been compiled by several reviews and meta-analytical analyses (e.g., Guo and Gifford, 2002; Murty et al., 2002; Liao et al., 2012). How-ever, intrinsic problems of the space for time approach re-main with the assumption of an identical starting point of the paired plots, which is often difficult to prove, and of a lim-ited number of samples to be representative for the plots. In addition, many paired plot studies cannot be judged if their reference ecosystem represents the potential natural carbon stock of the area, which is helpful to know for assessing the impacts of land-related policies, particularly in regions with a long history of intense land use and related SOC losses like Europe. This is especially true for the Po Valley in Northern Italy where dense oak forests and swamps covering once all the area were almost totally transformed into intensive crop-lands of maize, wheat, rice and woody cropcrop-lands (mainly poplar plantations) under various rotation regimes between 2 and 15 years. In Italy, poplar plantations on agricultural lands are explicitly not considered as forest in order to pro-vide some flexibility to farmers to return these lands back into non-woody croplands.
We present here the results of a paired plot study in north-ern Italy, comparing a remnant of natural forest representing the original vegetation of the Po Valley with a poplar planta-tion which was established in 1973 on lands covered before by the same type of natural forest. We selected the two sites because (i) they were comparable with regard to pedologi-cal conditions, (ii) the history of the area and the land use change was well documented, (iii) the period since the
trans-formation was long enough to allow the poplar plantation to achieve its typical agroecosystem properties (IPCC, 2003, 2006; Poeplau et al., 2011). To our knowledge, the transition from natural forest to a woody cropland has not been studied before. The goal of our study was to quantify the impact of such land use change on SOC stocks based on an appropriate sampling scheme.
2 Materials and methods 2.1 Study site
The site is located within the “Parco Regionale del Ti-cino”, Italy, about 10 km northwest of the city of Pavia (45◦1202200N; 9◦303500E). It is represented by a poplar
plan-tation (PP) and a relic of a natural floodplain forest (NF), the “Riserva Integrale Bosco Siro Negri”, about 1 km away from each other (Fig. 1). NF represents the natural land cover of the area, the Padanian–Illyrian hardwood alluvial forest in transition to the mesophytic Padanian mixed oak forest, together covering an area of more than 40 000 km2or 80 % of the overall Po Plain (Bohn et al., 2003). The landscape was mostly forested (dominated by deciduous oaks – Quer-cus spp. – and hornbeam – Carpinus betulus) until the late Middle Age clearings (Ravazzi et al., 2013). The woods were substituted by intense agriculture, with rice and corn cultiva-tion (since the 16th century), and poplar cultivacultiva-tion (since the early 19th century). The remnant NF wood, with a size of about 11 ha, received the highest level of protection as a “Riserva Integrale”, as it represents one of the few and best conserved relics of the original alluvial forest along the Ti-cino River. It was not managed for at least 70 years. Histori-cally it has always been forested as a hunting reserve of noble families from nearby Pavia with only occasional removal of precious trees; pasture and removal of fuel wood or litter by local people was strictly forbidden.
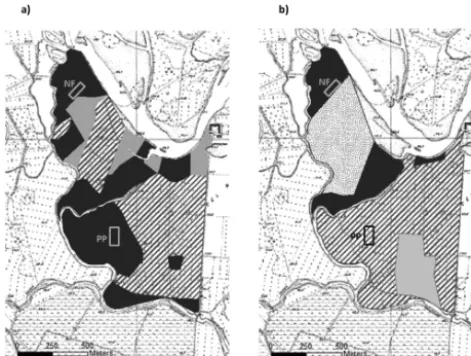
Land registers reveal that in the early 1900s the whole area indicated in Fig. 1 was covered by forests of the Bosco Siro Negri type. According to aerial photographs the study area, which is now a poplar plantation, was forested until 1954; the conversion to a poplar plantation took place in 1973, one year before constitution of the Parco Ticino, and appears to have been concluded in 1975. In 1954 the area between NF and PP was already converted from forest to croplands and poplar plantations; on the basis of aerial photographs in 2007 this area appears recently reforested.
Figure 1. Land use of the study area in 1954 (a) and 2007 (b).
(Natural forest: NF; poplar plantation: PP). Land use type: forest (black area), poplar plantation (lined area), cropland (grey area), recent afforestation (dotted area).
are dominant in the shrub layer. The humus form, accord-ing to Référentiel Pédologique (Baize and Girard, 2008), is mainly Mesomull (Ferré et al., 2005) with subordinate pres-ence of Eumull and Dysmull.
Most of the PP area is now under 3–4 generations of poplar (Clone I-214 Populus x euroamericana) with rotation period of 13–14 years. After each harvesting of poplar, the residues are removed and stumps are drilled to allow mouldboard ploughing 50–55 cm deep before establishing a new plan-tation (6×6 m distance, 278 trees per ha) by insertion of 4–5 m long shoots to a depth of 1.5 m in the soil. The inten-sity of poplar management is low and includes fertilization (300 kg ha−1 urea every 2–3 years) and removal of ground vegetation by harrowing (about 15 cm in depth) and not by chemical weeding; irrigation is never applied.
Due to proximity to the River Ticino, both sites are sub-ject to periodic flooding (three times in 10 years, Motta et al., 2009) and the dynamics of the Ticino make their sur-face morphology and spatial distribution of soil character-istics highly variable. With an elevation of 65 m a.s.l. and a distance to sea of 250 km, the PP and NF sites are already in the middle of the Po Valley, the nearest steep slopes of pre-Alpine hills are observed 70 km upstream at the outlet of the Ticino River from the more than 300 m deep Lago Maggiore, where stones are effectively retained. Consequently, the river deposits in the study area consist mainly of sand; gravel is observed only locally (presumably linked to historical river beds), and stones bigger than the coring device could not be observed at all.
At the study sites, soils do not exhibit a high pedogenetic degree since they developed on recent alluvial deposits of the Ticino River; according to the WRB classification (IUSS Working Group WRB, 2007), they are Haplic Arenosols and
Haplic Regosols, with Humic, Eutric and Arenic as com-mon suffix qualifiers (Table S1 in the Supplement). The cli-mate of the site is temperate continental, as monitored by the long-term meteorological station at Pavia (1950–2000), with yearly average rainfall of 912 mm and mean air temperature of 12.5◦C.
2.2 Soil, litter and leaf sampling
The effects of forest conversion to poplar plantation on SOC stock were investigated by sampling paired plots whose com-parability was confirmed through a reconstruction of land use history of the study area. Nine soil profiles (4 at PP site and 5 at NF site) were opened down to C horizon, described and sampled. Soil samples were taken from each horizon and analysed. Due to the alluvial origin of the soils and based on soil profiles, for the SOC stock characterization we sam-pled accounting for soil variability. The sampling was per-formed during summer 2010, using a gouge auger, apply-ing a random scheme. The maximum samplapply-ing depth was set to 100 cm, since LUC was assumed to have no impact on greater soil depths; the layer thickness was set based on vertical distribution of SOC and the average limits between horizons, according to soil profiles.
At PP, soil sampling was carried out in a rectangular area of about 3 ha. Soil samples were collected at 70 points from three layers: 0–15 cm (average harrowing thickness, corre-sponding to the Ap1 horizon), 15–55 cm (correcorre-sponding to the lower part of the Ap horizon, ploughed at the begin-ning of a rotation period) and 55–100 cm (corresponding to the C horizon, never affected by ploughing). Due to the heterogeneity of forest vegetation, at NF the soil sampling was more detailed compared to PP: 90 points were sampled in an area of about 1.3 ha, at three depths: 0–10 cm (corre-sponding to the average thickness of the A1 horizon, as ob-served in soil profiles, i.e. the layer with the greater SOC content), 10–55 cm (the lower limit taken in parallel to PP) and 55–100 cm.
The SOC stock calculation at NF considered the litter layer sampled at 90 sampling points in autumn with frames 35×35 cm; biomass samples were oven dried at 70◦C for 48 h and weighed. Instead, at the PP site a litter layer was absent. Litter accumulated only for a short period due to reg-ular harrowing; in addition, newly fallen leaves disappeared rapidly because of a high biological activity mainly of earth-worms. In order to assess the nutrient content and decom-posability of the tree litter, newly fallen leaves of poplar and of the main tree species in NF (five samples each) were col-lected from the forest floor in autumn, immediately after their falling.
For each sampling point, soil bulk density (BD) was deter-mined for the first two layers by the cylindrical core method on undisturbed core samples of 100 cm3volume, considering the volume of stones, when present. For the lowest layer or C-horizon we only have BD values from the soil profiles (see
Table S2 in the Supplement), because the BD of the lowest layer was not considered for carbon stock calculation, and undisturbed samples were difficult to get.
2.3 Soil chemical and physical analysis
On samples taken from the soil profile, organic C and to-tal N (Flash EA 1112 NC-Soil, Thermo-Fisher Scientific CN elemental analyser, Pittsburgh, USA), pHw (soil-to-solution
ratio of 1 : 2.5), soil texture (sieving and sedimentation; five fractions) and cation exchange capacity (NRCS, 2004) were determined. SOC, total N and pHw were determined on all
samples collected through soil coring. The determination of soil texture was carried out for the first two layers on all the samples while for the third layer it was done in correspon-dence to 20 sampling points selected as representative of the heterogeneity of the other soil parameters. For BD determi-nation, soil samples were oven dried at 105◦C for 48 h and
weighed; for soils containing coarse material (> 2 mm), soil volume was reduced considering the volume of stones. The OC and total N concentration of litter layers was converted to the content per area unit (kg m−2). The soil C and N con-tent on the area basis was computed for all sampled mineral layers on the basis of soil BD. C and N contents were also determined on litter and newly fallen leaf samples. The pres-ence of carbonates was investigated and they proved to be absent in soils of both the sites.
2.4 Mass correction
Major errors are linked to quantification of change in SOC stocks and other soil properties to fixed depths compared with the quantification in equivalent soil masses (Jenkinson, 1971; Ellert and Bettany, 1995). In this study the comparison of C stocks of the 0–55 cm layer between the different land uses was made by evaluating equivalent masses (Poeplau et al., 2011), accounting for differences in soil BD. The conver-sion from forest to agricultural soils usually leads to a change in soil BD due to tillage which breaks aggregates and com-pacts soil (Murty et al., 2002; Liao et al., 2012). Calculation of SOC stocks as a product of concentration, bulk density and soil depth is insufficient for assessing SOC stock changes, as it fails to account for tillage effects and consequently for the influence of different soil masses (Ellert and Bettany, 1995; Wendt and Hauser, 2013). The highest soil mass in a sin-gle point (reference soil) from 0 to 55 cm depth (836 kg) was measured at PP. All the other soil masses of both the sites were aligned: the correction was carried out making use of the deepest layer adding thickness mass to match that of the reference soil.
2.5 Statistical and geostatistical analyses
Statistical and geostatistical analyses were done by using the software package ISATIS 13.01 (Geovariances, 2013). Exploratory data analyses were performed for SOC, sand,
silt and clay content, pHw and C : N ratio of samples taken
through coring. The spatial structure of SOC stock was ex-amined with experimental variograms. A spatial pattern of SOC stock was revealed for the PP site only, using the intrin-sic random functions of orderk (IRF-k) technique of non-stationary geostatistics (Matheron, 1973; Buttafuoco and Castrignanò, 2005): it decomposes the drift and covariance structure to define models of spatial covariance through in-crements of a sufficiently high order, so that the drift can be filtered out and stationarity attained. The goodness of the se-lected model was evaluated with a cross-validation test by calculating: (1) the mean error, which proves the unbiased-ness of the estimate if its value is close to 0 and (2) the vari-ance of the standardized error; if the model is accurate, the variance of the standardized error should be close to 1.
The lack of spatial structure at the investigated scale led us to consider the NF sampling points as independent from each other and as replicates in a strict sense; their average (±
standard error) represents the mean SOC content of the for-est soil. At PP, SOC stock was instead spatially correlated; the spatial relationship between the pseudo-replicates (Hurl-bert, 1984) was identified and modelled. The SOC stock was interpolated using IRF-kkriging (Matheron, 1973) in which an auxiliary variable (coarse sand content) was incorporated as external drift function; a cumulative C stock value for the whole area was computed as the sum of values relative to each square metre of the estimation map and converted to the stock per area unit (kg m−2). For the PP site, a geostatis-tical analysis of the soil content of coarse sand (2–0.1 mm) was performed too, with the aim of understanding its spatial distribution (using ordinary kriging), in order to identify ho-mogeneous zones for each of which a cumulative SOC value was calculated.
3 Results
3.1 Soil profile description
The soil profile descriptions presented in Tables S1 and S2 and Figs. S1 and S2 in the Supplement show a general ho-mogeneity of soil properties along the profile for the PP site, whereas soils in the NF site exhibited a high differentia-tion of soil properties along the profile. The A1 horizon in NF was characterized by higher SOC (54.2 g kg−1), lower pHw values (5.6) and BD (0.96 g cm−3)and finer soil
tex-ture (sand: 38.2 %; silt: 48.7 %; clay: 13.2 %) than the deeper horizons; soil properties sharply changed with depth. The SOC strongly decreased in the A2 horizons and was very low in the C horizons. The fine material and the cation exchange capacity highly decreased with soil depth while BD and pH increased.
Table 1. Summary of results of organic layer (L) and coring of mineral soils at NF (n=90) and PP sites (n=70): average and standard error (SE) of SOC, C : N ratio, bulk density, pHw, sand, silt and clay content. Soil texturen=20 for the third layer 55–100 cm.
Site Layer SOC C : N Bulk density pHw Sand Silt Clay
2–0.05 mm 0.05–0.002 mm < 0.002 mm
[g kg−1] [g cm−3] % % %
Average SE Average SE Average SE Average SE Average SE Average SE Average SE
NF L 380.3 6.27 19.2 0.27
1 (0–10 cm) 51.5 2.44 13.4 0.09 0.99 0.01 4.6 0.05 59.9 2.12 36.9 1.94 3.2 0.25
2 (10–55 cm) 20.3 0.75 13.2 0.09 1.28 0.01 4.7 0.04 69.6 1.45 26.0 1.31 4.4 0.18
3 (55–100 cm) 3.3 0.18 14.5 0.40 5.3 0.04 84.2 1.18 13.7 1.08 2.1 0.12
PP 1 (0–15 cm) 11.1 0.42 10.9 0.10 1.21 0.01 5.9 0.02 46.7 0.21 47.4 0.20 5.9 0.28
2 (15–55 cm) 9.7 0.36 10.5 0.21 1.22 0.01 5.7 0.03 46.9 0.22 47.1 0.20 6.0 0.29
3 (55–100 cm) 3.8 0.11 9.3 0.11 5.7 0.06 51.0 0.25 43.4 0.23 5.5 0.29
[image:5.612.312.542.270.337.2]poplar, common aspen and common hawthorn leaves. The average C content was 380.3 g kg−1at a C : N ratio of 19.2 (Table 1).
3.2 SOC, physical and chemical soil properties
Results of the coring survey (Table 1) showed average SOC of 51.5 g kg−1in the topsoil (0–10 cm) of the NF site, which decreased with increasing soil depth. Compared to the sur-face content, less than half the C and N content was present in the second investigated layer (10–55 cm) and very low values of 3.3 g kg−1characterized the soils below 55 cm. At PP site we observed that SOC was distributed evenly to a depth of 55 cm, which corresponded to the maximum limit of plough-ing; its content was 11.1 g kg−1and 9.7 g kg−1in the layer 0–15 cm and 15–55 cm depth respectively. Below 55 cm the SOC decreased to 3.8 g kg−1.
For both sites, the texture (USDA class) of the topsoil was mainly sandy loam. In the 10–55 cm layer the soil texture of NF site was mainly sandy loam or loamy sand (sand: 69.6 %, silt: 26.0 %, clay: 4.4 %) while the last investigated layer (55–100 cm) showed predominantly a sandy texture (sand: 84.2 %, silt: 13.7 %, clay. 2.1 %). At PP, soil texture remained sandy loam until the deepest layer (sand: 48.4 %, silt: 45.8 %, clay: 5.8 %). At the NF site we could not find any rock frag-ments in five soil profiles and in soil corings; rock fragfrag-ments were absent also in most of the PP site with the exception of one corner of the survey area represented by the Haplic Arenosol of profile 4 (see Table S1 and Fig. S1 in the Supple-ment), where stone content ranged between 1 and 7 %. The volumetric stone content was considered both for calculat-ing the SOC stock and the bulk density. Correspondcalculat-ingly, the SOC stock of the abovementioned profile 4 decreased from 4.9 to 4.7 kg m−2(4 %) after stone volume correction for the 0–55 cm layer.
The undisturbed soils of the forest showed an average BD of 0.99 g cm−3in the 0–10 cm layer, which increased to 1.28 in the 10–55 cm layer. At the PP site, the BD was similar in the two layers with 1.21 and 1.22 g cm−3. The BD values of the lowest layer 55–100 cm can only be estimated from the
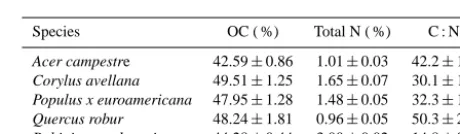
Table 2. Tree leaves (N=5): content (± SD) of organic carbon (OC), total nitrogen (N) and C : N ratio.
Species OC ( %) Total N ( %) C : N
Acer campestre 42.59±0.86 1.01±0.03 42.2±1.4 Corylus avellana 49.51±1.25 1.65±0.07 30.1±1.6 Populus x euroamericana 47.95±1.28 1.48±0.05 32.3±1.5 Quercus robur 48.24±1.81 0.96±0.05 50.3±2.8 Robinia pseudacacia 44.28±0.44 3.00±0.02 14.8±0.4
values taken at the soil profiles for the C-horizon (see Ta-ble S1 in the Supplement); with an average of 1.37 and 1.55 g cm−3for the PP and NF sites, respectively, the BD of the
NF site appears to be somewhat higher, in consistency with its higher sand content compared to the PP site (see Table 1). Under forest, soil average pHw values were less than 5.0 in
the first and second layer and increased in the 55–100 cm layer to an average value of 5.3. At PP, average pHw value
was 5.9 in the topsoil, with a minimum of 5.5 and a maxi-mum of 6.4. It slightly decreased with depth, reaching a value of 5.7 both in the second and third investigated layers. The intra-site spatial variability was high for SOC and texture; the coefficients of variation (CV) for these parameters were above 35 % (data not shown).
The chemical characteristics (OC, total N content and C : N ratio) of leaves of Populus x euroamericana and some dominant and co-dominant NF species (Quercus robur, Acer campestre, Corylus avellana and Robinia pseudacacia), which constituted the main epigeic organic matter inputs to soils, are reported in Table 2. The leaves of common oak were characterized by lower total N content and higher OC content than those of the other vegetation types and showed a C : N ratio of 50.3. The C : N value decreased to 42.2 in leaves of field maple and to 32.3 and 30.1 in leaves of poplar and common hazel respectively; false acacia leaves were charac-terized by very high N content (3.0) and a very low C : N ratio (14.8).
3.3 Spatial variability of SOC stock
The spatial variability of the SOC stock in the 0–55 cm layer was explored for both sites. The two investigated land uses differed from each other. For NF there was no spatial au-tocorrelation in the SOC data (pure nugget effect), while the experimental variogram of PP appeared not to be up-per bounded, indicating the non-stationarity of SOC (data not shown).
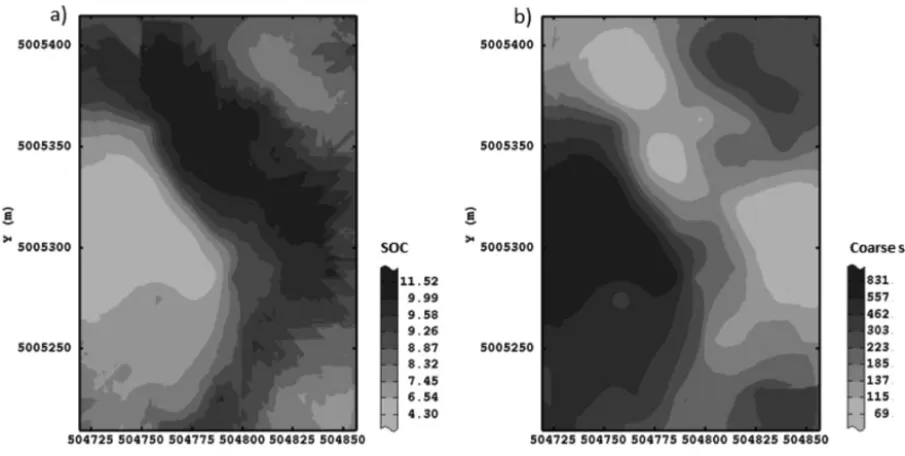
In fact, the spatial variation of SOC stock of PP soils ex-hibited a trend along with the sand content: the Generalized Covariance (GC) model was a nested model, which com-prised a nugget effect and a linear structure (order k=1). The spatial estimates of SOC stock showed a distribution inverse to that of the coarse sand content: SOC was lower in soils with higher coarse sand content while higher SOC stocks characterized finer textured areas (Fig. 2).
3.4 SOC stock comparison between land uses
A SOC stock of 14.2 (ranging between 6.2 and 23.9) kg m−2 characterized the investigated thickness down the profile to 55 cm (litter layer included and accounting for 0.5 kg m−2)at the NF site (Fig. 3). At PP, the SOC content was 8.5 (ranging between 4.3 and 10.7) kg m−2in the 0–55 cm layer, 40 % less than that observed for the forest land use. The SOC changes owing to land use conversion were more pronounced in soils with coarser texture: losses of 48 and 61 % were observed for coarse (2–0.1 mm) sand contents in the range 14–56 and 56–83 % respectively (Fig. 3).
4 Discussion
4.1 Site comparability
To achieve comparability of SOC stocks between the two neighbouring sites, we performed soil sampling by depth increments, compared equivalent soil masses, and analysed SOC stocks per texture cluster. The conversion of forest to poplar plantation affected the first two layers only, as shown by descriptions and analyses of soil profiles and corings; the ploughed limit never exceeded the depth of 55 cm and the av-erage SOC content of the third layer of the PP site was low and comparable with that found at the same depth in the for-est soils. The detailed sampling carried out in the study sites made it possible to describe the variability of soil character-istics and to understand the changes both in stock and verti-cal distribution of SOC after land use conversion, differently from what was obtained in the same study area by Cerli et al. (2009), who sampled only four soil profiles to a depth of 60 cm for each site; the sampling approach they applied made it possible to observe a SOC redistribution along the soil pro-files but not a change in SOC stocks as a consequence of the transformation of the natural forest to the poplar plantation.
Through the geostatistical analysis we modelled the spatial structure of the SOC stock in the 0–55 cm layer. The analysis showed differences between the two environments, in terms of spatial structure and SOC contents, reflecting the diver-gence that occurred in the PP soil after deforestation: while for the natural forest the SOC stock was not autocorrelated, a linear trend of SOC along with the coarse sand content was instead observed at PP. The geostatistical approach, taking into account the spatial variability and correlations between sampling points, made it possible to characterize the average SOC stock at PP through the cumulative value per average area unit, which was 8.5 kg m−2and somewhat higher com-pared to the value of 7.3 kg m−2obtained by simply averag-ing the 70 samplaverag-ing points (PP1 in Fig. 3).
A core feature of our land use change is the horizontal and vertical soil homogenization effect by deep plough and regular harrowing at PP, in contrast to a high level of soil diversification linked to a high heterogeneity of biotic ele-ments in the mature natural forest; therefore, a specific dif-ference of the spatial structure and variability of related soil parameters must be expected and linked to this type of land use change itself. Whereas a strong and in most cases signif-icant (negative) correlation between sand content and SOC stock was noticeable for both sites and for all layers (except the upper layer in NF, see Table S3 in the Supplement), a spatial structure could be identified for PP only. Instead, the SOC stock distribution of the 0–55 cm layers at the NF site was quite scattered and not spatially structured, probably due to an inherent variability at scale shorter than the measure-ments, which reflects the heterogeneous spatial pattern of the forest vegetation. In contrast, the deepest layer 55–100 cm shows a spatial structure for SOC content also at NF (data not shown), as it is less influenced by vegetation and manage-ment and mainly represents the soil parent material. Based on the above considerations, we compared in Fig. 3 the SOC stocks for equal classes of coarse sand content, thus separat-ing those effects of soil texture variability on SOC stocks, which are not connected to the land use change but to the alluvial origin of the investigated area.
Figure 2. Spatial estimates of (a) SOC stock (kg m−2)and (b) coarse sand content (g kg−1)of the 0–55 cm layer at the PP site. The grey scale represents isofrequency classes.
40 % (Fig. 3) for soils with high coarse sand content; our es-timate for changes in SOC stock as a consequence of land use conversion from forest to poplar are therefore likely to be conservative.
4.2 Comparison with published data
As a consequence of 37 years of poplar cultivation we found a decrease in SOC of about 40 % compared with the pre-conversion amount (mineral soil and litter layer combined), thus confirming a considerable reduction in SOC stock after transformation of forest to agricultural land use as found in the two meta-analytical reviews of Guo and Gifford (2002) and Poeplau et al. (2011). Guo and Gifford (2002) reported an average SOC stock decline of about 50 % in the 0–60 cm layer after land use change from forest to crop. For the same type of conversion Poeplau et al. (2011), using an exponen-tial model to describe the temporal dynamic of SOC loss in the mineral soil, obtained a SOC decrease at equilibrium of −32 %±20 % (±95 % confidence interval) of the initial stock.
The SOC stock of NF with 14.2 kg m−2 (0–55 cm) is
quite high compared with the average carbon pool of about 4.2 kg m−2(0–20 cm) reported by Baritz et al. (2010) for
Eu-ropean forest soils belonging to the pedological type and cli-mate areas comparable with ours, or with 5.0 kg m−2 esti-mated by Arrouays et al. (2001) for the top layer (0–30 cm) of French forest soils of the Regosol type. Instead the SOC stock of our NF is comparable to a stock of 15.8 kg m−2 (0–45 cm) found by Ferré et al. (2012) in another semi-natural mixed oak forest on Regosol in Lombardia, Italy.
24 659
Figure 3. Average SOC stock (kg m-2) of the 0-55 cm layer at the NF and the PP sites and 660
SOC values relative to various content of coarse sand (from soil coring, mass corrected) 661
NF: results are given as average (n=90) and range of variation (minimum value – maximum value); PP1: results 662
are given as average (n=70) and range of variation (minimum value – maximum value); PP2: results are given as 663
cumulative value per area unit and range of variation (minimum value – maximum value). 664
665
Figure 3. Average SOC stock (kg m−2) of the 0–55 cm layer at the NF and the PP sites and SOC values relative to various content of coarse sand (from soil coring, mass corrected). NF: results are given as average (n=90) and range of variation (minimum value – maximum value); PP1: results are given as average (n=70) and range of variation (minimum value – maximum value); PP2: results are given as cumulative value per area unit and range of variation (minimum value – maximum value).
The intensity of management of our PP is low; soil mould board ploughing to a depth of approximately 55 cm was done every 12–14 years at the start of a cultivation cycle, with annual harrowing (0–15 cm) providing continuous organic matter input of herbs, grasses, twigs, leaves and roots.
[image:7.612.309.545.348.530.2]mal management of poplar plantations in the Po Plain in-cludes regular irrigation and fertilization, the cultivation cy-cle is 8–10 years, and therefore ploughing and harrowing is more frequent. Hence, under more intensive management SOC losses even higher than the quantified 40 % could be ex-pected following conversion of natural forest to poplar plan-tations.
4.3 Application of the IPCC method for the calculation of SOC changes due to land use conversion
In providing general rules for reporting of carbon stock changes due to land use, land use change and forestry (LU-LUCF), IPCC (2006) gives default SOC stocks for a cli-matic/edaphic situation comparable to ours (high activity clay soil, tree crop-full tillage-low input, cool/warm temper-ate moist climtemper-ate) of 92 t ha−1 for the native forest and of
84 t ha−1 SOC stock after the land use conversion to tree
crop. The corresponding variation of −8 % appears to be much too low compared to our measurements. IPCC (2006) assumes that forests above 30 % canopy cover are excluded from conversion to cropland; thus, considering mature forest with less than 30 % cover as prior land use probably resulted in an underestimation of the reference organic carbon con-tent. On the other side, the IPCC method refers to SOC in the mineral topsoil layer 0–30 cm only, which is considered the common thickness of ploughed horizons. Since the depth taken into account can significantly affect estimates of total SOC, it would be more appropriate to consider a cautionary deeper sampling limit in order to properly describe the effects of land use change on soil C stock. Anyhow, for a hypotheti-cal soil depth of 30 cm, the difference in SOC stock between our sites would become 57 % instead of 40 %.
4.4 Further changes in soil properties due to land use conversion
The conversion of a forested soil to cultivated land usually comes with a decrease in the addition of organic matter; at the same time the characteristics of added organic matter change. Leaf litter input to the soil at PP with a leaf area index (LAI) of about 2 (Migliavacca et al., 2009) was lower than in the natural forest with a LAI between 5 and 6. In ad-dition, the PP woody biomass is almost completely removed at harvest, whereas all dead biomass remains in the natural forest, where the volume of coarse woody debris represents about 30 % of the living tree volume (Motta et al., 2009). Poplar leaves are significantly richer in N, and have a lower C : N ratio than those of common oak, the main tree of the forest site (Table 2). The C : N ratio can be used as a proxy of the organic matter mineralization rate, with respect to which it is inversely related (Berg and Ekbohm, 1983; Zhang et al., 2008). Based on a global compilation of decomposition stud-ies, Pietsch et al. (2014) characterized the leaf decomposabil-ity (Kleaf)of common oak with 0.66, whereasKleafof poplar
(1.3) was very similar to that of black locust (1.33). In the forest site the oak leaves accumulate on the soil surface as litter and their organic matter follows mainly the humifica-tion path; in contrast, poplar leaves do not accumulate on the surface and are quickly mineralized (Cotrufo et al., 2005).
Furthermore, mechanical actions (shredding and mixing) produced by pedofauna and tillage impact carbon turnover in soils by enhancing soil aeration and consequently SOC mineralization. In addition, the agricultural practices adopted cause the breakdown of aggregates and further increase the degradation processes by exposing organic material to biodegradation and oxidative agents (Six et al., 2000). As a consequence, a litter layer was lacking at PP, and C : N ra-tios of mineral soil (0–55 cm) were lower at PP than those at NF. In our study area, Cerli et al. (2009) found differences in fractions of particulate organic matter (POM) connected to conversion of NF to PP; most OM was bound to mineral components at PP, while small amounts were in the free and occluded light fractions, thus suggesting that the periodical disturbances accelerated the turnover and disruption of ag-gregates and therefore the OM mineralization rate, leaving behind only organic material strongly protected against de-composition.
The mineralization rates at PP may further be enhanced by higher soil surface temperatures due to sun exposure leading to increases of heterotrophic soil respiration (Rodeghiero and Cescatti, 2005; Ferré et al., 2012). For the same study area, the poplar stand studied by Migliavacca et al. (2009) showed higher mean soil temperatures from May 2002 to November 2003 in the 0–5 cm layer of 15.7◦C, as compared to 14.4◦C at the NF site. Soil CO2fluxes measured in 2003 at the PP
site (1.6 kg m−2y−1)showed a similar magnitude as the NF
site (2.2 kg m−2y−1)despite a much higher content of SOC
especially in the upper soil (+litter) layer of the natural for-est, indicating a faster turnover (and shorter residence time) of organic matter in the poplar cropland (Ferré et al., 2005).
In parallel to differences of the soil texture, somewhat higher pHw values at PP in the 55–100 cm layer can be
linked to the alluvial origin of the soils. A higher pHw of
the poplar topsoil is not due to the agronomic management, because liming was never done and fertilization was always performed with urea, but probably due to the quality of the litter – that of the poplar does not acidify the soil, unlike common oak litter (Nordén, 1994; Hagen-Thorn et al., 2004). Poplar topsoil pH may further be increased by the mixing ac-tivity of soil macrofauna (earthworms are very active in the studied poplar soil) (De Schrijver et al., 2012; Slade and Ri-utta, 2012), which brings to the surface less acid soil material taken in depth. However, SOC variations were not linked to variations of the pHw values as demonstrated by the lack of
significant correlations between SOC and pHwof the parent
5 Conclusions
We studied the effects of forest conversion to poplar plan-tation on SOC and soil properties in a paired plot design through a sampling scheme that took into account the het-erogeneity of surface and deep soil horizons, which is related to site characteristics and land uses. As commonly observed on young alluvial soils, the soil properties like texture at the neighbouring NF and PP sites showed a high and compara-ble variability within the site as well as between the sites. For this reason, a dedicated sampling scheme and geostatis-tical treatment of data was required to quantify the effects of 37 years of poplar cultivation on SOC transfer in depth and the overall stock.
In comparison to the relic forest, at the poplar site the litter layer was lost and the carbon stock in the 0–55 cm layer of the mineral soil was depleted by 5.7 kg m−2resulting in an
overall SOC decrease of about 40 %. Considering soils with sand content higher than 56 %, the SOC loss became more pronounced, reaching 61 %. For a soil depth of 30 cm as con-sidered in IPCC reporting, the SOC loss in our study with
−57 % was almost an order of magnitude higher compared to the IPCC value of−8 % to be considered for a correspond-ing land use change.
The key question remains: if soil texture and SOC are spa-tially structured and autocorrelated in PP but not in NF, how can a paired plot study guarantee that the land use change is responsible for the observed changes in SOC? For our case study we are convinced we could provide this proof by (i) a high enough number of samples to properly describe the spatial variability within and between plots, (ii) identifying and handling the feature of autocorrelation via geostatistical analysis, and (iii) sampling enough points to allow compari-son of carbon stocks per texture clusters.
However, if a land use change per se, e.g. through soil har-monization effects of ploughing and harrowing, creates an underlying spatial structure driving SOC variability, then lated soil sampling strategies need to be discussed with re-gard to the number of samples and to the application of spa-tial statistics. As the feature observed in our study could be valid for many land use changes involving tillage, one may assume that the experimental effort required in general for proofing effects of LUC on SOC through paired plot stud-ies and chronosequences would increase substantially, well beyond to what we observe in many such studies published until now.
From the very beginning our LUC-SOC case study was designed to show and to handle the real-world complexity; it leads us to a very simple overall conclusion: instead of “space for time” we need more replicate studies “time after time”, with clear georeferencing of sampling plots investi-gated before and after land use conversion, in the framework of a long-term SOC stock monitoring network covering all land uses and following a joint protocol. In order to facili-tate assessment of policy impacts, a special effort would be
needed to include mature reference ecosystems representing the potential natural carbon stock of an area.
The Supplement related to this article is available online at doi:10.5194/bg-11-6483-2014-supplement.
Acknowledgements. This work was supported by the FP7-JRC
contract IES.B384603 (Technical Support to the JRC Kyoto experiment) and by the Progetto Kyoto of the Lombardy Region. We received substantial help from the owner and site manager of the poplar site, G. Cova-Minotti. F. Zanoli, and from those responsible for the Ticino Park and Bosco Siro Negri, M. Furlanetto and F. Sartori respectively. We thank F. Biressi, M. Brambilla and M. Franchini for help with field and laboratory work and F. Moia for laboratory assistance. A special thanks to Annamaria Castrig-nanò (Research Unit for Cropping Systems in Dry Environments, CRA-SCA, Bari) for her kind assistance in geostatistical analyses. The paper was substantially improved thanks to helpful comments and suggestions of four anonymous referees and of the editor. Edited by: Y. Kuzyakov
References
Arrouays, D., Deslais., W., and Badeau, V.: The carbon content of top soil and its geographical distribution in France, Soil Use Manage., 17, 7–11, 2001.
Baize, D. and Girard, M. C. (Eds.): Référentiel pédologique, Quae, Versailles, France, 2008.
Baldock, J. A.: Composition and cycling of organic carbon in soil, in: Nutrient Cycling in Terrestrial Ecosystems, edited by: Marschner, P. and Rengel, Z., Springer-Verlag, Heidelberg, Ger-many, 1–35, 2007.
Baritz, R., Seufert, G., Montanarella, L., and Van Ranst, E.: Carbon concentrations and stocks in forest soils of Europe, Forest Ecol. Manag., 260, 262–277, 2010.
Bellamy, P. H., Loveland, P. J., Bradley, R. I., Lark, P. M., and Kirk, G. J. D.: Carbon losses from all soils across England and Wales 1978–2003, Nature, 437, 245–248, 2005
Berg, B. and Ekbohm, G.: Nitrogen immobilization in decompos-ing needle litter at variable Carbon : Nitrogen ratios, Ecology, 64, 63–67, 1983.
Bohn, U., Neuhäusl, R., Gollub, G., Hettwer, C., Neuhäuslová, Z., Raus, Th., Schlüter, H., and Weber, H.: Map of the natural vege-tation of Europe. Scale 1 : 2 500 000. Bundesamt für Naturschutz, Bonn, Germany, 2003.
Buttafuoco, G. and Castrignanò, A.: Study of the spatio-temporal variation of soil moisture under forest using intrinsic random functions of order k, Geoderma, 128, 208–220, 2005.
Cerli, C., Celi, L., Bosio, P., Motta, R., and Grassi, G.: Effect of land use change on soil properties and carbon accumulation in the Ticino Park (North Italy), Studi Trent. Sci. Nat., 85, 83–92, 2009.
COM(2006)232: Proposal for a directive of the European Parlia-ment and the Council establishing a framework for the protection of soil and amending directive 2004/35/EC, Commission of the European Communities, Brussels, Belgium, 2006.
Cotrufo, M. F., De Angelis, P., and Polle, A.: Leaf litter production and decomposing in a poplar short-rotation coppice exposed to free air CO2enrichment (POPFACE), Glob. Change Biol., 11,
971–982, 2005.
De Schrijver, A., De Frenne, P., Staelens, J., Verstraeten, G., Muys, B., Vesterdal, V., Wuyts K., Van Nevel, L., Schelfhout, S., De Neve, S., and Verheyen, K.: Tree species traits cause divergence in soil acidification during four decades of postagricultural forest development, Glob. Change Biol., 18, 1127–1140, 2012. Ellert, B. H. and Bettany, J. R.: Calculation of organic matter and
nutrients stored in soils under contrasting management regimes, Can. J. Soil Sci., 75, 529–538, 1995.
Ferré, C., Leip, A., Matteucci, G., Previtali, F., and Seufert, G.: Im-pact of 40 years poplar cultivation on soil carbon stocks and greenhouse gas fluxes, Biogeosciences Discuss., 2, 897–931, doi:10.5194/bgd-2-897-2005, 2005.
Ferré, C., Zenone, T., Comolli, R., and Seufert, G.: Estimating het-erotrophic and autotrophic soil respiration in a semi-natural for-est of Lombardy, Italy, Pedobiologia, 55, 285–294, 2012. Geovariances: Isatis technical ref., release 13.01. Avon Cedex,
France: Geovariances & Ecole Des Mines De Paris, 2013. Guo, L. B. and Gifford, R. M.: Soil carbon stocks and land use
change: a meta-analysis, Glob. Change Biol., 8, 345–360, 2002. Hagen-Thorn, A., Callesen, I., Armolaitis, K., and Nihlgard, B.: The impacts of six European tree species on the chemistry of mineral topsoil in forest plantations on former agricultural land, Forest Ecol. Manag., 195, 373–384, 2004.
Houghton, R. A.: Revised estimates of the annual net flux of carbon to the atmosphere from changes in land use and land manage-ment 1850–2000, Tellus, 55, 278–390, 2003.
Houghton, R. A.: Historic changes in terrestrial carbon storage, in: Recarbonization of the biosphere – Ecosystems and the global carbon cycle, edited by: Lal, R., Lorenz, K., Hüttl, R. F., Schnei-der, B. U., and von Braun, J., Springer Verlag, Heidelberg, Ger-many, 59–82, 2012.
Hurlbert, S. J.: Pseudoreplication and the design of ecological field experiments, Ecol. Monogr., 54, 187–211, 1984.
IPCC (Intergovernmental Panel of Climate Change): Land Use, Land Use Change, and Forestry, Cambridge University Press, Cambridge, England, 2000.
IPCC (Intergovernmental Panel of Climate Change): Good Practice Guidance for Land use, Land-use Change and Forestry, IGES, Hayama, Japan, 2003.
IPCC (Intergovernmental Panel of Climate Change): Revised IPCC guidelines for national greenhouse gas inventories, Intergovern-mental Panel of Climate Change Publication, Cambridge Univer-sity Press, Cambridge, England, 2006.
IUSS Working Group WRB: World Reference Base for Soil Re-sources 2006, first update 2007, World Soil ReRe-sources Reports, 103, FAO, Rome, Italy, 2007.
Jenkinson, D. S.: The accumulation of organic matter in soil left uncultivated, Rothamsted Experimental Station Report for 1970, 2, Lawes Agricultural Trust, Harpenden, England, 1971. Lal, R.: Soil Carbon Sequestration Impacts on Global Climate
Change and Food Security, Science, 304, 1623–1627, 2004.
Liao, C., Luo, Y., Fang, C., Chen, J., and Li, B.: The effects of plan-tation practice on soil properties based on the comparison be-tween natural and planted forests: a meta-analysis, Global Ecol. Biogeogr., 21, 318–327, 2012.
Matheron, G.: The intrinsic random functions and their applica-tions, Adv. Appl. Probab., 5, 239–465, 1973.
Migliavacca, M., Meroni, M., Manca, G., Matteucci, G., Mon-tagnani, L., Grassi G., Zenone, T., Teobaldelli, M., Goded, I., Colombo, R., and Seufert, G.: Seasonal and interannual patterns of carbon and water fluxes of a poplar plantation in Northern Italy, Agr. Forest Meteorol., 149, 1460–1476, 2009.
Motta, R., Nola, P., and Berretti, R.: The rise and fall of the black locust (Robinia pseudoacacia L.) in the “Siro Negri” Forest Re-serve (Lombardy, Italy): lessons learned and future uncertainties, Ann. For. Sci., 66, 410–419, 2009.
Murty, D., Kirschbaum, M. U. F., McMurtrie, R. E., and McGilvray, H.: Does conversion of forest to agricultural land change soil car-bon and nitrogen? A review of the literature, Glob. Change Biol., 8, 105–123, 2002.
Nieder, R. and Benbi, D. K.: Carbon and nitrogen in the terrestrial environment, Springer-Verlag, Heidelberg, Germany, 2008. Nordén, U.: Influence of tree species on acidification and mineral
pools on deciduous forest soils of south Sweden, Water Air Soil Poll., 76, 363–381, 1994.
NRCS: Soil survey laboratory methods manual, Soil Survey Inves-tigations Report, 42, USDA-NRCS, Lincoln, NE, USA, 2004. Pietsch, K. A., Ogle, K., Cornelissen, J. H. C., Cornwell, W. K.,
Boenisch, G., Craine, J. M., Jackson, B. G., Kattge, J., Peltzer, D. A., Pemuelas, J., Reich, P. B., Wardle, D. A., Weedon, J. T., Wright, I. J., Zanne, A. E., and Wirth, C.: Global relationship of wood and leaf litter decomposability: the role of functional traits within and across plant organs, Global Ecol. Biogeogr., 23, 1046–1057, 2014.
Poeplau, C. and Don, A.: Sensitivity of soil organic carbon stocks and fractions to different land-use changes across Europe, Geo-derma, 192, 189–211, 2013.
Poeplau, C., Don, A., Vesterdal, L., Leifeld, J., van Wesemael, B., Schumacher, J., and Gensior, A.: Temporal dynamics of soil or-ganic carbon after land-use change in the temperate zone – Car-bon response functions as a model approach, Glob. Change Biol., 17, 2415–2427, 2011.
Ravazzi, C., Marchetti, M., Zanon, M., Perego, R., Quirino, T., Deaddisa, M., De Amicis, M., and Margaritora, D.: Lake evo-lution and landscape history in the lower Mincio River valley, unravelling drainage changes in the central Po Plain (N-Italy) since the Bronze Age, Quatern. Int., 288, 195–205, 2013. Rodeghiero, M. and Cescatti, A.: Main determinants of forest soil
respiration along an elevation/temperature gradient in the Italian Alps, Glob. Change Biol., 11, 1024–1041, 2005.
Schmidt, M. W., Torn, M. S., Abiven, S., Dittmar, T., Guggenberger, G., Janssens, I. A., Kleber, M., Kogel-Knabner, I., Lehmann, J., Manning, D. A. C., Nannipieri, P., Rasse, D. P., Weiner, S., and Trumbore, S. E.: Persistence of soil organic matter as an ecosys-tem property, Nature, 478, 49–56, 2013.
Six, J., Merckx, R., Kimpe, K., Paustian, K., and Elliott, E. T.: A re-evaluation of the enriched labile soil organic matter fraction, Eur. J. Soil Sci., 51, 283–293, 2000.
Slade, E. M. and Riutta, T.: Interacting effects of leaf litter species and macrofauna on decomposition in different litter environ-ments, Basic Appl. Ecol., 13, 423–431, 2012.
Tomaselli, R. and Gentile, S.: La riserva naturale integrale“Bosco Siro Negri” dell’Università di Pavia, Atti Ist. Lab. Critt. Univ. Pavia, 7, 41–70, 1971.
Wendt, J. W. and Hauser, S.: An equivalent soil mass procedure for monitoring soil organic carbon in multiple soil layers, Eur. J. Soil Sci., 64, 58–65, 2013.
Zhang, D., Hui, D., Luo, Y., and Zhou, G.: Rates of litter decom-position in terrestrial ecosystems: global patterns and controlling factors, J. Plant Ecol., 1, 85–93, 2008.