Creative Components Iowa State University Capstones, Theses and Dissertations
Spring 2018
Using EEG to Assess Programming Expertise against
Using EEG to Assess Programming Expertise against
Self-reported Data
reported Data
Greeshma Reddy Padiri
Iowa State University, [email protected]
Follow this and additional works at: https://lib.dr.iastate.edu/creativecomponents
Part of the Other Computer Sciences Commons
Recommended Citation Recommended Citation
Padiri, Greeshma Reddy, "Using EEG to Assess Programming Expertise against Self-reported Data" (2018). Creative Components. 16.
https://lib.dr.iastate.edu/creativecomponents/16
Using EEG to Assess Programming
Expertise against Self-reported Data
Iowa State University
Computer Science
Creative Component Report
Greeshma Reddy Padiri
Program of Study Committee
Dr. Carl K. Chang
Dr. Simanta Mitra
Abstract
Cognitive processes like working memory, attention play a key role in evaluating any subject's performance at a given task. Instead of proceeding with the methods that use task the completion time or accuracy or runtime of the program, we use human Electroencephalography (EEG) data and its features to quantify the programming expertise of individuals. Motivated by few other works with similar research goals, we use EEG to check if there is any correlation between the cognitive load and the self-reported data. We believe that this study helps to learn further about common threats to validity associated with the research in this area.
Hypothesizing that there is no difference between the cognitive load experienced by experts and novices, we collected the EEG data of twenty-three participants in a controlled experiment and examined if the novice and the expert programmers could be grouped based on their EEG data. Emotiv Epoc is used as the Brain Computer Interface device to record the electrical pulses produced in the brain. Main parts of this project include planning and conducting the lab experiment during which participants provide their answers to the given Java programming questions and also to the questions in the given survey, signal analysis and feature extraction, data processing and data clustering. Our results show that there is difference between the cognitive loads experienced by people with different levels of programming expertise.
Table of Contents
Section-1: Introduction ... 5
Section-II: Related work ... 6
a. Electroencephalography (EEG) ... 6
b. Cognitive Load ... 7
c. Individual Alpha Frequency... 7
d. Emotiv Epoc ... 8
Section-III: Methodology ...11
a. EEG Data Acquisition ...12
b. Signal analysis and Feature extraction ...13
i. Plotting Power Spectral Density Estimates on EEGLAB ...13
ii. Feature Extraction ...15
c. Data processing ...17
d. Clustering the data ...17
e. Threats to Validity ...19
f. Difficulties ...19
Section-IV: Results ...19
Section-V: Conclusion ...22
Acknowledgements ...23
References ...23
APPENDIX-I: Emotiv Epoc- Control Panel and TestBench ...26
APPENDIX-II: Programs given to the participants ...28
List of Figures
Figure 1: Emotive Epoc ... 8
Figure 2: Channel locations by name and by number ... 10
Figure 3: Four steps of methodology ... 12
Figure 4: PSD estimates-Rest period ... 14
Figure 5: PSD estimates-Trial Period ... 15
Figure 6: PSD estimates of a rest period signal with IAF 10 ... 16
Figure 7: Calculated IAF for all participants ... 16
Figure 8: Plots showing percentage of correct predictions by each task ... 20
Figure 9: Plots showing percentage of correct predictions by each band ... 21
Figure 10: A sample silhouette plot ... 22
Figure 11: TestBench EEG display and FFT display ... 26
Figure 12: Control Panel (SDK and Xavier SDK) ... 27
List of Tables
Table 1: Different waveforms of EEG signal ... 7Table 2: Hardware configuration of Emotive Epoc neuroheadset... 9
Section-1: Introduction
Some of the popular ways of measuring the performance or expertise of an individual are by giving him/her exams, questionnaires, surveys or taking their interviews and then judging their performance based on the task completion time or accuracy of the completed task or both. But this evaluation could be subject to bias if the evaluation involves considering the self-reported data too. This project focuses on using Electroencephalography (EEG) data and its feature cognitive load as a measure to check how correctly novice and experts could be distinguished. Hypothesis here is that there is no difference in the cognitive load experienced by individuals with different levels of programming expertise.
There has been an extensive amount of work accomplished in the area of Human-Computer Interaction, EEG signal processing and analysis in the past two decades. Besides, different tools and techniques have been developed that proved to be more sophisticated ways to measure the EEG. For instance, there has been a smooth transition from using invasive procedures to non-invasive methods of measuring brain activity which are a lot easier than the former ones. We shall discuss more about the differences between invasive and non-invasive forms of Brain-Computer Interface(BCI) in the next section.
Here, in this project, we have chosen to assess the programming expertise of the participants. The programming language used is Java as this is usually taught in most of the basic programming courses and there were participants with different educational backgrounds. All the participants have at least some basic idea of Java programming constructs. This study aims at conducting experiments to –
a. Understand the key principles of EEG data collection and common threats to
validity associated with this kind of methodologies.
b. Test the hypothesis: there is no difference between cognitive load
experienced by novice programmers and cognitive load experienced by expert programmers.
c. Examine the feasibility of the current study in differentiating the novices and
experts based on the cognitive load experienced by them while resting and also while working on providing answers to the given programming tasks.
overview of other related works. The third section explains the methodology and all the tasks associated with all the four key stages of the study-data acquisition, signal pre-processing and feature extraction, data processing, and clustering. The fourth section presents the results of data clustering and also discusses any threats to validity. The last section presents the conclusion and suggests a few changes that could help to get better results and also gives the scope of future research.
Section-II: Related work
This section presents some background information like a brief introduction to EEG, different waveforms of EEG, cognitive load, and the importance of individual alpha frequency. These concepts give an idea of EEG signal analysis. This section also briefs on how Emotiv Epoc is used for data acquisition. In the end, there is a short summary of how other works have used Emotiv Epoc in their studies with similar research goals.
a.
Electroencephalography (EEG)
Brain-Computer Interface (BCI) consists of both hardware and software and enables humans to control computers and other devices directly through their brain activity. Essentially there are three types of BCI- invasive, partially-invasive and non-invasive [1], [2]. In the invasive methods, microelectrodes are implanted directly into the brain to record the activity of neurons. In the partially-invasive BCI, electrodes are implanted in the skull but not into the brain. In the non-invasive form, electrodes are outside the skull and have less signal quality compared to invasive methods but it is often considered the safest and easiest way of recording the brain activity.
Waveform Band range Characteristics
Delta 0.5-3 Hz High in deep sleep. Largest amplitude compared to
other waves.
Theta 4-7 Hz Associated with cognitive activities like memory load,
meditation.
Alpha 8-14 Hz Most common in adults. Dominant frequency while
resting. Reduces or disappears under stress, cognitive activity.
Beta 15-38 Hz Lowest amplitude of all the waves. Associated with
Gamma 38-100 Strong focusing, concentration and information processing
Table 1: Different waveforms of EEG signal
Electroencephalography, shortly known as EEG is one of the prominent forms of non-invasive BCI to measure the nervous system activity caused by electrical signals in the brain. EEG data is often characterized by its amplitude, frequency. The frequency of brain waves varies from 0.01 Hz to 64 Hz. Classification of different brain waves based on their frequency bands [3], [4] is presented in Table 1.
b.
Cognitive Load
In simple terms, cognitive load indicates the total amount of mental effort put by working memory while performing a task. Cognitive load theory (CLT) [5] gives a relation between the capacity of the working memory and the cognitive demands of a task [6]. CLT classifies cognitive load into three categories-germane cognitive load, intrinsic cognitive load, and extraneous cognitive load. Intrinsic cognitive load describes the mental effort experienced due to the complexity of the task at hand and does not depend on the design of the problem, like germane cognitive load. It varies with the underlying complexity of the problem.
The capacity of working memory is limited and humans are conscious of the information that is held by working memory. As per CLT, working memory capacity and performance are inversely related. As working memory plays a significant role in solving the given problem, measuring the performance of working memory implies measuring the cognitive load of the user’s brain over time. Low working memory load is associated with expertise whereas high working memory load implies lack of expertise [18]. [7] demonstrates how alpha and theta rhythms reflect the cognitive and memory performance. So we have chosen only alpha and theta waveforms to be used in the project to understand the differences in the cognitive load of experts and novices.
c.
Individual Alpha Frequency
in alpha (desynchronizes). Previous findings from [7], [8] show that the frequency which indicates a transition from theta synchronization to alpha desynchronization varies with the individual and is correlated to alpha, the dominant frequency in adults. It also shows that theta frequency varies as a function of alpha frequency and suggests to use alpha frequency as a common reference point for adjusting other frequency bands to achieve consistency in the interpretation of the data. [7] gives a classic example: consider an older adult with a poor memory performance. He or she may show a very less alpha peak frequency of 7 Hz which falls in the range of theta because of using pre-defined band ranges. Using peak frequency to define band ranges has been proven to give more meaningful and accurate results. So, this peak/dominant frequency has been a common step in defining other sub-band ranges.
d.
Emotiv Epoc
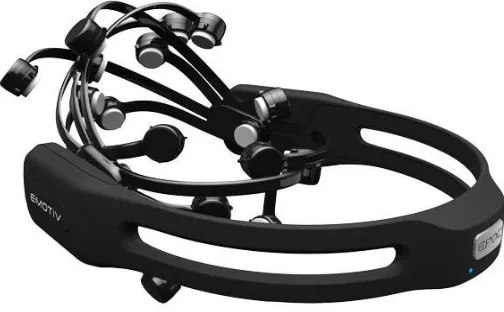
[image:9.612.179.431.469.625.2]Because of its ease of use, low set-up cost and portability, Emotiv Epoc, developed by Emotiv Corporation is one of the most used research-grade neuroheadsets. Few other commercial EEG devices available in the market are MindWave and MindSet from Neurosky, Epoc+ and Insight from Emotiv, Mindflex from Mattel, OpenBCI R&D Kit, OpenBCI Ganglion Board from OpenBCI and so on [9]. Table 2 presents the hardware configuration of the Emotiv Epoc device used in the experiments to collect the raw EEG data. Figure 1 is an image of Emotive Epoc [10].
Figure 1: Emotive Epoc
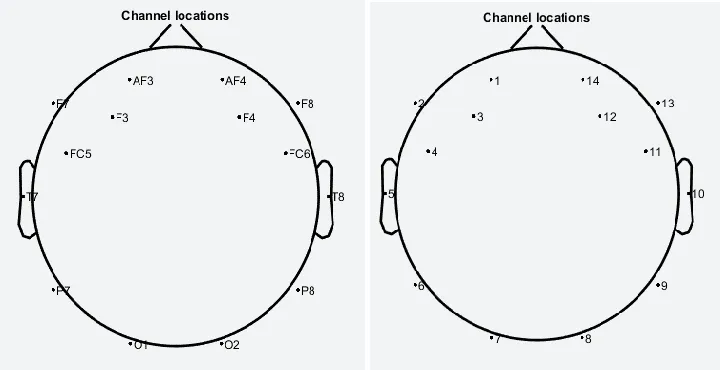
two reference electrodes. We will be using the terms channels, electrodes, and sensors in synonymous with one another. The channels are given different names based on the location of the brain where the sensors are supposed to be placed [11]. Letter F denotes frontal lobe, letter C denotes the central region, letter P denotes parietal lobe, letter O denotes occipital lobe and letter T denotes temporal lobe. Some channel names contain two alphabets in the name to indicate that the sensor is placed in the area that covers both the regions. Figure 2 shows channel location maps by name and by number respectively.
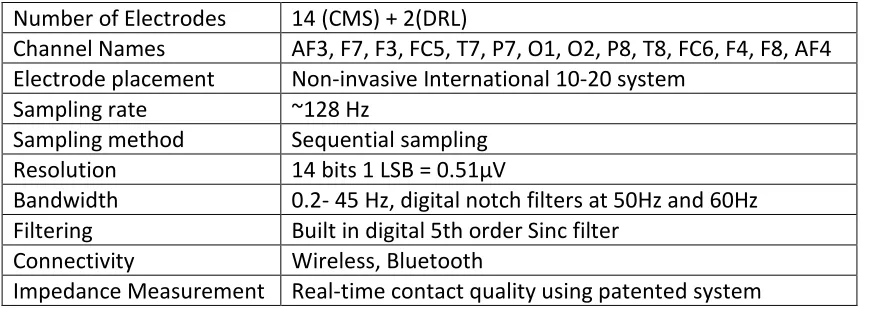
Emotiv Epoc has a sampling rate of 128 Hz and it can measure the frequencies from 0.2 Hz to 45 Hz. Epoc is wireless and connectivity is through Bluetooth. Unlike few other neuroheadsets that require a gel-like solution for the conductivity of electrodes, Emotive Epoc needs saline solution to keep the sensors wet while using the device. Dry pads do not measure any EEG activity. If required, it is good to wet the sensor pads by dripping saline solution using a small nozzle when the device is being used. But the best way to overcome this problem is to design the experiments in such a way that each session lasts no more than 30 minutes.
Number of Electrodes 14 (CMS) + 2(DRL)
Channel Names AF3, F7, F3, FC5, T7, P7, O1, O2, P8, T8, FC6, F4, F8, AF4
Electrode placement Non-invasive International 10-20 system
Sampling rate ~128 Hz
Sampling method Sequential sampling
Resolution 14 bits 1 LSB = 0.51μV
Bandwidth 0.2- 45 Hz, digital notch filters at 50Hz and 60Hz
Filtering Built in digital 5th order Sinc filter
Connectivity Wireless, Bluetooth
[image:10.612.100.538.375.530.2]Impedance Measurement Real-time contact quality using patented system
Table 2: Hardware configuration of Emotive Epoc neuroheadset
TestBench software is used to record the data and it has various displays that lets the user view the raw EEG signal and FFT data. More information about Emotiv SDK and testbench is added in the appendix section of the report.
Raw EEG data is recorded on Epoc TestBench. All the data is in EDF-European Data Format. TestBench allows converting EDF files into CSV files. TestBench user manual helps to understand different columns with the description of each column in the CSV file. Apart from development tools provided by SDKs, there are a few open-source tools like EEGlab, Fieldtrip, and BCI2000 that can be used for processing the EEG data and for feature extraction. [12] supports the use of Emotiv Epoc neuroheadset as a low-cost alternative for EEG signal acquisition by showing a good rate of classification accuracy in building an eye-wink interpretation system. Emotiv Epoc can not only be used in measuring cognitive load but also in analyzing emotions. [13] developed a video game in Android, using gyroscope that interprets head movements and EMG signals obtained from Emotiv Epoc headset. [14] focuses on only two channels and two frequencies beta and gamma to differentiate novices and experts based on the program comprehension skills. EMG and EOG data are used along with the EEG data.
[image:11.612.121.481.382.567.2]
Figure 2: Channel locations by name and by number
noise. Though we instruct participants to avoid any unnecessary muscle movements, artifacts introduced by eye-movements, ocular artifacts cannot be completely prevented or completely removed. EEG signal processing toolbox like EEGLAB have options to remove ocular artifacts like eye-blinks in the data.
After [7] presented the idea of Individual Alpha Frequency(IAF) which needs to be calculated from the power spectral density estimates of the signal, other works like [15], [16], [17] proposed several ways to find the power spectral density estimates and also how to find the peak in the given frequency range. In all these works, different terms have been used to indicate peak frequency. This project has been motivated by the works [14], [18], [19] and follows the experiment design presented in these works. [20] shows a relationship between alpha and theta waves in EEG during relaxation and IQ test. Statistical techniques like linear regression and data segmentation were used to plot the power changes in the alpha band and theta band. Data segmentation focused on the interested events but not the whole signal.
[18] proposed a method to quantify the expertise of subjects using the k-means clustering method to group the data. All the sessions involved participants providing their responses to the programs which require the cognitive activity of the brain. Participants also answered a questionnaire that has several questions related to their programming experience. Different clustering mechanisms were used to find if there is any relation between the cognitive abilities and the self-reported data.
Section-III: Methodology
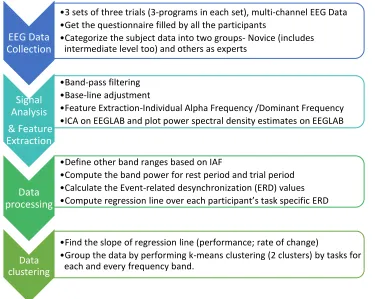
clustering the objective data and analyzing the results. Figure 3 shows the important steps involved in each stage of the methodology.
Figure 3: Four steps of methodology
a.
EEG Data Acquisition
As the project required human EEG data collection, we got the Institutional Review Board (IRB) approval (17-503) before the actual data collection began. All the twenty three participants are above 18 and signed the informed consent document that has the information about the purpose of the study, description of the procedures, risks and discomforts. All the participants are undergraduate students and graduate students at the university and all of them had taken at least one programming related course and have at least some basic knowledge of the programming language constructs.
Experimental sessions were conducted in the lab. Each full session of the experiment involving each participant took 45-50 minutes out of which the device setup took around fifteen minutes. All the participants were instructed to minimize any
EEG Data Collection
•3 sets of three trials (3-programs in each set), multi-channel EEG Data •Get the questionnaire filled by all the participants
•Categorize the subject data into two groups- Novice (includes intermediate level too) and others as experts
Signal Analysis & Feature Extraction
•Band-pass filtering •Base-line adjustment
•Feature Extraction-Individual Alpha Frequency /Dominant Frequency •ICA on EEGLAB and plot power spectral density estimates on EEGLAB
Data processing
•Define other band ranges based on IAF
•Compute the band power for rest period and trial period •Calculate the Event-related desynchronization (ERD) values •Compute regression line over each participant’s task specific ERD
Data clustering
•Find the slope of regression line (performance; rate of change)
unnecessary muscle movement as it introduces unwanted noise in the signal. Connectivity of the sensors and also sampling rate read from the Emotiv Epoc were verified first. There were few instances where the connectivity of one or two channels was weak because of the shape of the subject’s skull. Any session where there was no connectivity of at least one sensor or poor connectivity of more than two sensors was terminated and EEG data were not collected.
The programs for which participants were asked to provide the output were - reversing the given string, finding the median of given array, printing the fizz-buzz series up to given number. As these programs do not have any complex logic and involves simple branching and looping statements, we chose these programs. Programs are given in the appendix section of this report. On the whole, there were three sets of three trials which means each question was presented to the user three times. In each trial, a program with an input is presented to the user and the user is supposed to type the output in the textbox present there. Between every two trials, there is a page that displays nothing except the word relax. There was at least thirty seconds gap between every two trials. All the questions were presented to the participants in a round-robin order. There was no limit on the task completion time because time-bound tasks might put the participants under stress too. Data were collected in parallel on TestBench in the form of European Data Format (EDF) files.
Once participants were done with all the tasks, they were asked to answer a survey that contains questions related to their programming experience like number of programming courses taken, how long they have been programming, other programming languages that they know apart from C and Java and also about their experience working on academic projects and real-time applications. The survey was designed similar to the one mentioned in [21]. Survey questions are also included in the appendix section of this document.
b.
Signal analysis and Feature extraction
MATLAB and EEGLAB were used for signal analysis. This stage involves basic EEG signal processing and feature extraction-extracting key signal characteristics and this reduces datasets without losing any information.
i. Plotting Power Spectral Density Estimates on EEGLAB
strength of the distribution of power in a signal as a function of frequency. It shows at which frequencies the variations are strong and at which frequencies the variations are weak. As these features are applicable to infinite length periodic signals and as the signal length here is finite, it is said that we can calculate only an estimate of PSD values but not the accurate PSD value. There are different ways to calculate the PSD estimates in Matlab-using FFT (Periodogram is used), Matlab’s pwelch method.
Figure 5: PSD estimates-Trial Period
EEGLAB is an interactive MATLAB toolbox for signal processing. EEGLAB methods can be used directly from MATLAB too. After loading the EDF file, appropriate locations file needs to be uploaded. The reference .loc file should be available in EEGLAB/sample_locs folder on the computer. We can check whether right .loc file is loaded by plotting the sensor locations in 2D or 3D. By default, there are thirty six columns of data out of which column-3 to column-16 contain sensor data. Channels are selected manually by providing channel numbers. Data not related to channels is omitted.
To plot the power spectral density estimates, the signal is pre-processed to remove noise, band-pass filtered between 2 and 40 Hz, baseline adjusted to limit the slew-rate. Median is removed from the total signal. Individual Component Analysis (ICA) is a good tool to separate the signals properly in case there are two or more sources of EEG data. There are different options for the automatic continuous rejection of the data and automatic continuous rejection of the channels in case we want to remove any identified artifacts related to muscle movement or eye-blinking. But we have not checked for the eye movement artifacts as that requires special expertise in this area.
Plotting channel spectra and maps show power spectral density estimates for each and every channel selected. Figure 4 shows the PSD estimates of the EEG data collected when the subject is resting (when he or she is not sleeping, not excited and in restful wakefulness) and figure 5 shows the PSD estimates of the EEG data collected (14 channels) when the subject is working on the given task. As we can see in the plots, there is a synchronization in the theta band power between 4 Hz and 7 Hz while working on a task whereas there is a slight desynchronization in the alpha between 8 Hz and 12 Hz. Each color in the PSD plots represents a channel.
ii. Feature Extraction
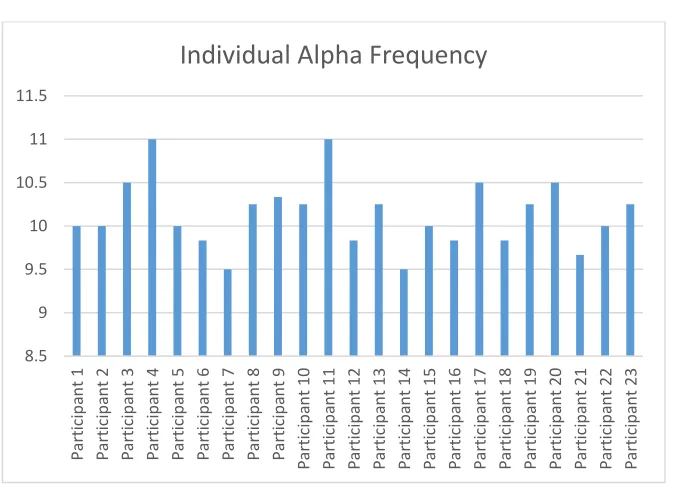
rounded to 10. Instead of using pre-defined band ranges, we use IAF to define the sub-band ranges of Theta, Lower Alpha1, Lower Alpha2, Upper Alpha [7], [8]. Figure 7 shows IAF values computed for all the participants. Minimum IAF observed is 9.5 whereas maximum is 11. [7], [19] show that IAF is usually associated with memory performance of the individual.
Figure 6: PSD estimates of a rest period signal with IAF 10
Figure 7: Calculated IAF for all participants
8.5 9 9.5 10 10.5 11 11.5 Pa rt ic ip an t 1 Pa rt ic ip an t 2 Part icip an t 3 Pa rt ic ip an t 4 Pa rt ic ip an t 5 Pa rt ic ip an t 6 Pa rt ic ip an t 7 Pa rt ic ip an t 8 Pa rt ic ip an t 9 Pa rt ic ip an t 10 Part icip an t 1 1 Pa rt ic ip an t 12 Pa rt ic ip an t 13 Pa rt ic ip an t 14 Pa rt ic ip an t 15 Pa rt ic ip an t 16 Pa rt ic ip an t 17 Pa rt ic ip an t 18 Part icip an t 1 9 Pa rt ic ip an t 20 Pa rt ic ip an t 21 Pa rt ic ip an t 22 Pa rt ic ip an t 23
[image:17.612.139.476.420.662.2]c.
Data processing
Sub-band ranges are defined as follows [7]. Lower Alpha1: IAF-4 to IAF-2, Lower Alpha2: IAF-2 to IAF, Upper Alpha: IAF to IAF+2, Theta: IAF-6 to IAF-4. Next, band power of Theta, Lower Alpha1, Lower Alpha2 and Upper Alpha are calculated. Event-Related Desynchronization (ERD) is defined as an increase or decrease in the EEG power from the resting period to task performance period [22]. It is calculated as percentage change in the band power of trial period EEG with reference to the band power of rest period EEG. Positive ERD values indicate event-related synchronization (ERS) whereas negative values indicate event-related desynchronization. Below is the classical method to computer ERD [22].
a. Pre-processing the EEG data: band-pass filtering, base-line adjustment
b. Defining the band ranges based on the IAF that was calculated earlier
c. Finding the power in each frequency band
d. For each segment of trial period data, finding the mean of band power
and then calculating ERD/ERS values.
Linear regression is used in the prediction of future data based on the available data. The slope of a regression line signifies the rate of change in the ERD values. Linear regression is performed on the ERD values for each and every task across all the three trials. Dependent variables are the ERD/ERS values of different frequency bands. Matlab’s polyfit method is used to perform polynomial curve fitting. To perform linear regression using the Polyfit method, we need to pass 1 as the degree of polynomial fit to the parameter-n. It outputs a structure with the values of slope, x, and y-intercepts. These slope values are used in the next step.
d.
Clustering the data
about actual and predicted classifications. It provides details like accuracy, true positive rate, true negative rate, precision and so on. Here, we consider only the accuracy which gives the percentage of accurate classification, the true positive rate which gives the percentage of experts predicted as expected and the true negative rate which gives the percentage of novice predicted as expected. An example of a simple 2*2 confusion matrix with formulae for calculating the output parameters described above are given below.
Predicted
Negative Positive
Actual Negative a B
Positive c D
Accuracy= (𝑎 + 𝑑)/(𝑎 + 𝑏 + 𝑐 + 𝑑)
True Positive rate= 𝑑/(𝑐 + 𝑑)
True Negative rate= 𝑎/(𝑎 + 𝑏)
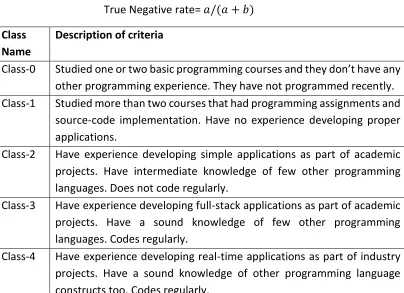
Class Name
Description of criteria
Class-0 Studied one or two basic programming courses and they don’t have any
other programming experience. They have not programmed recently.
Class-1 Studied more than two courses that had programming assignments and
source-code implementation. Have no experience developing proper applications.
Class-2 Have experience developing simple applications as part of academic
projects. Have intermediate knowledge of few other programming languages. Does not code regularly.
Class-3 Have experience developing full-stack applications as part of academic
projects. Have a sound knowledge of few other programming languages. Codes regularly.
Class-4 Have experience developing real-time applications as part of industry
[image:19.612.105.509.355.648.2]projects. Have a sound knowledge of other programming language constructs too. Codes regularly.
e.
Threats to Validity
Though there are several artifact removal methods available nowadays,
non-invasive EEG is prone to noise and poor signal resolution and it records muscle movement artifacts too. So it cannot be guaranteed that the headset records each and every electrical impulse and all the EEG data comprises of only electric potentials as a result of some neural activity.
It is not completely possible to control the emotions and silently flowing
thoughts of any person.
When we see the plots of power spectral density estimates on EEGLAB, we
see high band power in the frontal areas of the brain but it could be because of eye-blinks too instead of just actual electrical impulses produced in those parts of the brain. Though EEGLAB offers many options to discard EEG data related to eye-blinks, it does not guarantee eye-movement/muscle-movement free EEG data all the time.
Classification of subjective data into two groups could be subject to bias
sometimes.
As the number of participants in the study is small, it is difficult to generalize
these results to a large group.
f.
Difficulties
There are few small issues with the size of the device. For few participants,
some sensors did not come into contact with the skull. Some trials were discarded due to this.
Experiments should be designed carefully to prevent any excessive noise that
could be introduced in the signal due to the drying up of saline pads. Connectivity of the sensors had to be monitored continuously. Conducting a pilot study could be more helpful.
Section-IV: Results
novice predictions is also plotted and all the trials are clustered by each frequency band too. Classification accuracy was almost similar when we considered class-2 as part of the expert group too. But we believe the results may be improved by coming with a better design and data analysis techniques. Figure 8 and 9 show the plots for the same.
Figure 8: Plots showing percentage of correct predictions by each task
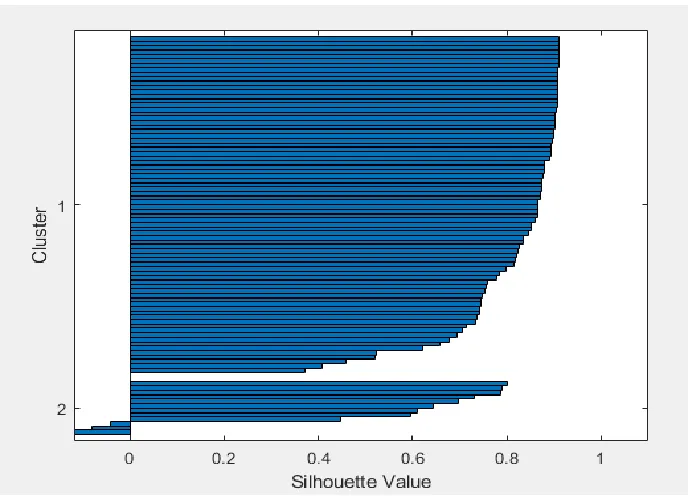
Based on the silhouette values of the results of k-means clustering, we see the distance between data points and the centroid in the novice cluster is very less compared to the distance between data points and the centroid in the experts' cluster. As per [23], silhouette values range from -1 to +1. A high silhouette value indicates that that data point is in the well-matched cluster and cannot fit in the other clusters. Clustering solution is more appropriate if many points in the cluster have high silhouette values. In our results, we see that 50-60% of our predictions are correct and around 70% points in novice cluster have silhouette values between 0.6 and 1 whereas the silhouette values of data points in experts cluster are more dispersed. This shows that data points in the novice cluster are closely related and more similar.
58.3
48.9 50 50
43.2 43.2
2.3 6.8
72.2
54.2
93.8
89.6
A L L T A S K S T A S K - 1 T A S K - 2 T A S K - 3
PERCENTAGE OF CORRECT PREDICTIONS
BY EACH TASK
% of correct predictions % of correct expert predictions
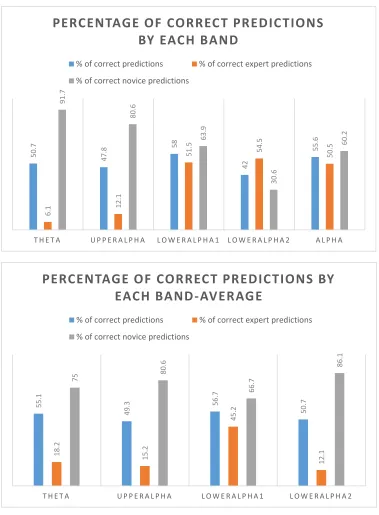
Figure 9: Plots showing percentage of correct predictions by each band
50.7 47.8
58
42
55.6
6.1 12.1
51.5 54.5 50.5
91.7
80.6
63.9
30.6
60.2
T H E T A U P P E R A L P H A L O W E R A L P H A 1 L O W E R A L P H A 2 A L P H A
PERCENTAGE OF CORRECT PREDICTIONS
BY EACH BAND
% of correct predictions % of correct expert predictions
% of correct novice predictions
55.1
49.3
56.7
50.7
18.2 15.2
45.2
12.1
75 80.6
66.7
86.1
T H E T A U P P E R A L P H A L O W E R A L P H A 1 L O W E R A L P H A 2
PERCENTAGE OF CORRECT PREDICTIONS BY
EACH BAND-AVERAGE
% of correct predictions % of correct expert predictions
Figure 10: A sample silhouette plot
Section-V: Conclusion
From the results of k-means clustering, it is clear that the data can be clustered into two different groups and hence the cognitive load experienced by the novice programmers and the expert programmers is not same. Observed differences between the PSD estimates of the signal collected during the rest period and during the trial period demonstrate the expected differences between rest period and trial period as shown by [7] so we believe that Emotiv Epoc can be used for conducting this kind of studies. Though there is no significant difference between the results of [19] and the results of this project in terms of total number of correct predictions, we see that data of the novice programmers got grouped more accurately in most of the places than data of the expert programmers. It should be noticed that the results depend on the distribution of the participants too.
more number of sensors and devices with high sampling rate might help to record more accurate data. Epoc+ is better than Epoc as its sampling rate is 256 Hz. We believe that giving more complex programming questions to the participants to answers can show a significant difference in the cognitive load.
Acknowledgements
I would like to thank Dr. Carl K. Chang and Dr. Simanta Mitra for their constant support throughout the project, IRB committee for their valuable review and suggestions to improve the experiment design and also all the participants who volunteered to participate in the experiment.
References
1. Rabie A. Ramadan, Athanasios V. Vasilakos, Brain computer interface: control
signals review, Neurocomputing, Volume 223, 2017, Pages 26-44, ISSN
0925-2312, https://doi.org/10.1016/j.neucom.2016.10.024.
2. Waldert S. Invasive vs. Non-Invasive Neuronal Signals for Brain-Machine
Interfaces: Will One Prevail? Frontiers in Neuroscience. 2016;10:295. doi:10.3389/fnins.2016.00295.
3. V. Gopejenko and I. Mihailovs, "Neurocomputer interface, the classification
of the brain waves and virtual reality control," 2015 9th International
Conference on Application of Information and Communication Technologies (AICT), Rostov on Don, 2015, pp. 433-436.
4. G. Buzsaki, Rhythms of the Brain, pp. 84-85, 2006, Oxford University Press, Inc.
5. John Sweller, Cognitive load theory, learning difficulty, and instructional
design, Learning and Instruction, Volume 4, Issue 4, 1994, Pages 295-312, ISSN 0959-4752, https://doi.org/10.1016/0959-4752(94)90003-5.
6. Anderson, Erik & Potter, Kristin & Matzen, Laura & Shepherd, Jason & A. Preston, G & Silva, Cláudio. (2011). A User Study of Visualization Effectiveness Using EEG and Cognitive Load. Computer Graphics Forum. 30. 791 - 800. 10.1111/j.1467-8659.2011.01928.x.
7. Wolfgang Klimesch, EEG alpha and theta oscillations reflect cognitive and
memory performance: a review and analysis, Brain Research Reviews, Volume 29, Issues 2–3, 1999, Pages 169-195.
8. Wolfgang Klimesch, Memory processes, brain oscillations and EEG
9. https://ipfs.io/ipfs/QmXoypizjW3WknFiJnKLwHCnL72vedxjQkDDP1mXWo6u co/wiki/Comparison_of_consumer_brain-computer_interface_devices.html
10.https://www.emotiv.com/product/emotiv-epoc-14-channel-mobile-eeg/
11.
https://www.trans-cranial.com/local/manuals/10_20_pos_man_v1_0_pdf.pdf
12.D. S. Benitez, S. Toscano and A. Silva, "On the use of the Emotiv EPOC neuroheadset as a low cost alternative for EEG signal acquisition," 2016 IEEE
Colombian Conference on Communications and Computing (COLCOM),
Cartagena, 2016, pp. 1-6.
13.R. Raju, C. Yang, C. Li and A. Cangelosi, "A video game design based on Emotiv
Neuroheadset," 2016 International Conference on Advanced Robotics and Mechatronics (ICARM), Macau, 2016, pp. 14-19.
14.S. Lee et al., "Comparing Programming Language Comprehension between
Novice and Expert Programmers Using EEG Analysis," 2016 IEEE 16th
International Conference on Bioinformatics and Bioengineering (BIBE),
Taichung, 2016, pp. 350-355.
15.Francesca Caso, Marco Cursi, Giuseppe Magnani, Giovanna Fanelli, Monica
Falautano, Giancarlo Comi, Letizia Leocani, Fabio Minicucci, Quantitative EEG and LORETA: valuable tools in discerning FTD from AD?, Neurobiology of Aging, Volume 33, Issue 10, 2012, Pages 2343-2356,
16.Telgarsky, Rastislav. (2013)
17.A. Goljahani, C. D'Avanzo, S. Schiff, P. Amodio, P. Bisiacchi, G. Sparacino, A
novel method for the determination of the EEG individual alpha frequency, NeuroImage, Volume 60, Issue 1, 2012, Pages 774-786, ISSN 1053-8119, https://doi.org/10.1016/j.neuroimage.2011.12.001.
18.Crk and T. Kluthe, "Toward using alpha and theta brain waves to quantify programmer expertise," 2014 36th Annual International Conference of the IEEE Engineering in Medicine and Biology Society, Chicago, IL, 2014, pp. 5373-5376.
19.I. Crk and T. Kluthe, "Assessing the contribution of the individual alpha frequency (IAF) in an EEG-based study of program comprehension," 2016 38th Annual International Conference of the IEEE Engineering in Medicine and Biology Society (EMBC), Orlando, FL, 2016, pp. 4601-4604.
20.S. A. M. Aris, S. Lias and M. N. Taib, "The relationship of alpha waves and theta waves in EEG during relaxation and IQ test," 2010 2nd International Congress
on Engineering Education, Kuala Lumpur, 2010, pp. 69-72.
22.Andreas Fink, Event-related desynchronization in the EEG during emotional and cognitive information processing: Differential effects of extraversion, Biological Psychology, Volume 70, Issue 3, 2005, Pages 152-160.
23.G. Pfurtscheller, F.H. Lopes da Silva, Event-related EEG/MEG synchronization
and desynchronization: basic principles, Clinical Neurophysiology, Volume 110, Issue 11, 1999, Pages 1842-1857, ISSN 1388-2457,
https://doi.org/10.1016/S1388-2457(99)00141-8.
24.Visa, Sofia; Ramsay, B.; Ralescu, A.; and VanDerKnaap, E., "Confusion
Matrix-Based Feature Selection" (2011). Proceedings of The 22nd Midwest Artificial Intelligence and Cognitive Science Conference 2011, 120-127.
25.https://www.mathworks.com/help/stats/silhouette.html
26.P. Chowdhury, S. S. Kibria Shakim, M. R. Karim and M. K. Rhaman, "Cognitive
efficiency in robot control by Emotiv EPOC," 2014 International Conference on
Informatics, Electronics & Vision (ICIEV), Dhaka, 2014, pp. 1-6.
27.valipour, samaneh & Shaligram, A & , G.R.Kulkarni. (2014). Detection of an
Alpha Rhythm of EEG Signal Based On EEGLAB. International Journal of Engineering Research and Applications. 4. 39-42.
28.Robert J. Barry, Adam R. Clarke, Stuart J. Johnstone, Christopher A. Magee,
Jacqueline A. Rushby, EEG differences between eyes-closed and eyes-open resting conditions, Clinical Neurophysiology, Volume 118, Issue 12, 2007, Pages 2765-2773.
29.F. Mulla, E. Eya, E. Ibrahim, A. Alhaddad, R. Qahwaji and R. Abd-Alhameed,
"Neurological assessment of music therapy on the brain using Emotiv Epoc," 2017 Internet Technologies and Applications (ITA), Wrexham, 2017, pp. 259-263.
30.O. A. P. Sosa, Y. Quijano, M. Doniz and J. E. C. Quero, "Development of an EEG
signal processing program based on EEGLAB," 2011 Pan American Health Care
Exchanges, Rio de Janeiro, 2011, pp. 199-202.
31.Steyrl, D. , Kobler, R. and Müller-Putz, G. (2016) On Similarities and
APPENDIX-I: Emotiv Epoc- Control Panel and TestBench
TestBench software is used to record the data and it has various displays that let the user view the raw EEG signal and FFT data. Figures 11 shows the screenshots of TestBench in use with EEG and FFT displays. Emotive Epoc Software Development Kit (SDK) has three suites. First one, Expressiv suite captures the expressions of the subject. The second one, Affectiv suite measures and displays a set of range of emotional responses and the third one, Cognitiv suite evaluates the real-time brain activity to recognize the intent. There are a set of open source development tools and SDK API available on GitHub with code samples explaining the usage of different API. SDK provides API for the users to run their programs and collect the data directly. A sample Java code that recognizes the connected Emotiv Epoc device and uses
getAverageBandPowers() to output the band power data is given below. More
examples can be found at https://github.com/Emotiv/community-sdk.
[image:27.612.122.512.500.674.2]
APPENDIX-II: Programs given to the participants
a. Reversing the given string
b. Finding the median of given array
Appendix-III: Questionnaire to assess programming expertise of
the individuals based on their experience
1. What do you think is the difficultly level of question-1?
2. What do you think is the difficultly level of question-2?
3. What do you think is the difficultly level of question-3?
4. For how long have you been programming?
5. Please rate your programming expertise on a scale of 1 to 10. 1 being the lowest and 10 being the highest.
6. For how many years have you been working / did you work on a real-time
7. Have you taken any classes in which you have to implement any source code?
8. How experienced are you with these programming languages- Java, C. 1 being
minimum experience and 5 being professional expertise.
9. How much time do you code per day, roughly?
10. How many additional languages do you know? Please don't mention any if