Optimization of lychee wine fermentation process using response
surface methodology to reduce acetic acid content
Wu Rina
1,
Zhu Ping
2,
Shang Yuhui
1,
Zhong Qiuping
1* (1. College of Food Science and Technology, Hainan University, Haikou 570228, China; 2. College of Horticulture and Landscape Architecture, Hainan University, Haikou 570228, China)Abstract: Acetic acid is the main component of the volatile acid in the wine. However, excessive amounts of acetic acid negatively affect wine quality. The study aimed to decrease acetic acid content produced by Saccharomyces cerevisiae
fermentation after adding metal ion at different temperatures. Response surface methodology (RSM) was used to predict the optimum conditions for acetic acid removal. A central composite design was employed for the experiments and results were analyzed to obtain the best possible combination of fermentation temperature (X1: 16°C-24°C) and concentrations of potassium
(X2: 0-12.0 mM), magnesium (X3: 0-8.0 mM), and calcium ions (X4: 0-0.2 mM) that would generate the minimum acetic acid in
lychee wine at an initial acetic acid concentration of 1.5 g/L. Experimental data were fitted to a second-order polynomial equation using multiple regression analysis and analyzed using analysis of variance (ANOVA). During fermentation under pre-established conditions, the correlation coefficients R2 and Adj-R2 of the models for acetic acid removal were 0.9487 and
0.9007, respectively. After testing, the optimum conditions for acetic acid removal were determined as follows: fermentation temperature of 20°C; potassium, magnesium, and calcium ion concentrations of 10.1mM, 6.1 mM, and 0.2 mM, respectively. The experimental acetic acid content of lychee wine under optimal conditions was found to be 0.309 g/L, which agreed well with the model-predicted value of 0.314 g/L.
Keywords: lychee wine, acetic acid, fermentation, Saccharomyces cerevisiae, metal ion, response surface methodology
DOI: 10.3965/j.ijabe.20160906.2270
Citation: Wu R N, Zhu P, Shang Y H, Zhong Q P. Optimization of lychee wine fermentation process using response surface methodology to reduce acetic acid content. Int J Agric & Biol Eng, 2016; 9(6): 223-230.
1 Introduction
Lychee (Litchi chinensis Sonn.) is a plant belonging
to the Sapindaceae family and native to Southern China. Lychee fruit has been gradually accepted by consumers for its rose-floral, citrus-like aroma, and palatable sweet
Received date: 2015-12-31 Accepted date: 2016-05-29
Biographies: Wu Rina, graduate student, research interests: agricultural product processing technology, Email: 951531103@ qq.com; Zhu Ping, undergraduate, research interests: horticultural product processing technology, Email: [email protected];
Shang Yuhui, graduate student, research interests: agricultural product processing technology, Email: [email protected].
*Corresponding author: Zhong Qiuping, PhD, Professor, research interests: agricultural product processing technology. College of Food Science and Technology, Hainan University, No.58, Renmin road, Haikou 570228, China. Tel/Fax: +86- 898-66193581, Email: [email protected].
taste (sugar content about 160 g/L)[1]. However,
overproduction of lychee fruit leads to significant post-harvest losses because the red discoloration of the pericarp becomes brown after harvest soon. This is because of poor handling and insufficient storage facilities[2]. Therefore, fruit lychee wine is an effective
way to prevent wastage caused by the short shelf life of
lychee and increase its economic value[3], and lychee
wine industry has been rapidly developed in China over the last decade.
Acetic acid is the main component of the volatile acid in wine. However, excessive amounts negatively affect wine quality. It can be generated by yeast or contaminant lactic acid and/or acetic acid bacteria at any time during fermentation of lychee wine and can also be produced prior to alcoholic fermentation through bacterial
infection. Similar to the phenomenon observed in grape, the rupture of the lychee pericarp caused by pathogenic infection or natural formation allows Acetobacter species to access the inner portions of the lychee fruit and use the ethanol produced by wild yeast as their preferred carbon
source[4]. Consequently, the acetic acid content in
lychee juice before fermentation can reach up to 1.0- 2.0 g/L. The acetic acid content in lychee wine is
approximately 1.2 g/L[5], which is the current national
limit. According to research of Ribéreau-Gayon et al.[6], when acetic acid concentration exceeds 0.9 g/L, it can produce a noticeable bitter or sour aftertaste in wine. Thus, the excessive amounts of acetic acid should be removed to control lychee wine quality.
Temperature and metal ions (e.g., potassium, magnesium, and calcium ions) play important roles in wine production because they affect yeast growth rate,
fermentation rate, and metabolism[7–11]. Ca2+ is a
prevalent and important cell messenger, with an essential
role in regulating Saccharomyces cerevisiae
proliferation[12]. An experiment of Lu and Means[13]
demonstrated that normal cell proliferation entails Ca2+ at concentrations of 1.0-1.2 mM outside the cell. Magnesium, known to be essential for yeast growth, metabolism, and fermentation, has been shown to protect against stress-inducing conditions, such as temperature
and ethanol toxicity[14]. Magnesium is a vital ion in
nucleic acid synthesis and is a cofactor for more than 300 enzymes, including those of acetic acid utilization (acetyl-CoA synthetase, isocitrate lyase, and malate synthase) and glycolytic enzymes (e.g., hexokinases, phosphofructokinase, phosphoglycerate kinase, pyruvate kinase, and enolase)[15]. Potassium is mainly involved in osmoregulation, charge-balancing, and regulation of divalent ions and phosphate uptake into the yeast cell. Low potassium and high sodium levels are toxic to yeast cells. Acetic acid absorbed into yeast cells is important for promoting the acid’s degradation. The absorption and utilization of acetic acid mainly depend on cellular membrane permeability and membrane permeases. Moreover, acetic acid utilization enzymes are highly temperature and metal-ion dependent. These enzymes acquire conformational changes in the membrane protein
structure with temperature variation and entail metal ions as cofactor[16,17].
The ability of S. cerevisiae to remove acetic acid is
exploited to eliminate excessive amounts of acetic acid as a practical approach during alcoholic fermentation[4]. In our previous studies, we found that acetic acid reduction was significantly influenced by temperature and metal ions. To increase acetic acid removal amount, further optimization of the fermentation conditions is required. Traditionally, optimization of any process requires altering the levels of one variable at a time to evaluate the process response. Therefore, large numbers of experimental trials are required. Unfortunately, this approach does not describe the interaction of the variables with the response and cannot assure the attainment of optimal conditions for the process. To overcome these limitations, response surface methodology (RSM) was applied. RSM is a collection of statistical techniques
originally described by Box and Wilson[18] used to
evaluate the interactions between multiple parameters and optimize processes[19].
The objective of the present work was to optimize the conditions for acetic acid removal during lychee wine fermentation with RSM. This study investigated the effects of fermentation temperature, potassium, magnesium, and calcium ion concentrations on the acetic acid content of lychee wine, and determined the optimum conditions for acetic acid removal during lychee wine fermentation.
2 Materials and methods
2.1 Materials
The strain used in this study was S. cerevisiae 2137,
obtained from Guangdong Microbiology Culture Center.
The yeast culture was stored at −80°C in yeast extract
(0.5% w/v) + glucose (1% w/v) medium supplemented
with glycerol (30% w/v). Lychee fruits (L. chinensis
November, 2016 Wu R N, et al. Optimization of lychee wine fermentation process to reduce acetic acid content Vol. 9 No.6 225
2.2 Methods
2.2.1 Preparation of lychee juice and fermentation Unhealthy lychee fruits were discarded, and the remaining fruits were washed with tap water. After being treated with 0.2% pectinase at 45°C for 2 h, the pulp was manually extracted from the fruits. To reduce the microbial load without affecting the activity of fermentative yeasts and preventing oxidation reactions,
240 mg/L of K2S2O5 was added to the extracted juice.
Then, 50% w/v food-grade tartaric acid was added to adjust the pH to 3.5. The extracted juice was subjected to centrifugation at 12 000 r/min (13 200×g; Cence Centrifuge, Xiangyi Instrument Ltd., China) for 15 min at ambient temperature. The resulting supernatant was collected and used as fermentation medium with the addition of acetic acid and metal ions. The juice was analyzed prior to acetic acid addition; its compositions were as follows: glucose, 58.2 g/L; sucrose, 121.3 g/L;
fructose, 2.3 g/L; total SO2, 120 mg/L; and free SO2,
14 mg/L at pH 3.5. After the media were pasteurized at 100°C for 15 min, acetic acid, at a final concentration of 1.5 g/L, and different concentrations of metal ions were added to the lychee juice before yeast inoculation. The concentration of acetic acid was based on our previous findings, in which during alcoholic fermentation the acetic acid levels was unsuccessful to reach an acceptable values set by local legislation when the initial acetic acid concentration added was 1.5-2.0 g/L. The media were inoculated at a concentration of 6 log CFU/mL with a culture previously grown for 24 h at 25°C in pasteurized lychee juice. Fermentation reactions were conducted under the conditions shown in Table 1 without shaking in 250 mL flasks filled to 90% of their volume and each covered with a polytetrafluoroethylene membrane. The fermentation reactions were considered being completed when the weight became constant.
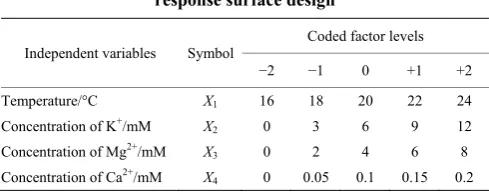
Table 1 Independent variables and their levels used in the response surface design
Independent variables Symbol
Coded factor levels
−2 −1 0 +1 +2
Temperature/°C X1 16 18 20 22 24
Concentration of K+/mM X
2 0 3 6 9 12
Concentration of Mg2+/mM X
3 0 2 4 6 8
Concentration of Ca2+/mM X
4 0 0.05 0.1 0.15 0.2
2.2.2 Determination of acetic acid concentration Acetic acid content was measured by an enzymatic method (R-biopharm AG, D-64297 Darmstadt, Germany) according to the manufacturer’s instructions.
2.3 Experimental design and statistical analysis
A central composite design (CCD) was employed to evaluate the optimal conditions for acetic acid removal. The examined variables selected on the basis of our preliminary experimental determination were fermentation temperature and concentrations of potassium, magnesium, and calcium ions. The levels of these variables in CCD are shown in Table 1. The experimental design consisted of 30 treatments (16 factorial points, 8 axial points, and 6 replicates of the central points). Six replicates at the center of the design were adopted to allow for estimation of a pure error sum of squares. The acetic acid content of the final product was designated as the response. The data from the CCD were explained by multiple regressions to fit the following second-order polynomial equation:
4 4 3 4
2 0
1 1 4 1
i i ii i ij i j
i i i j i
Y β βX β X β X X
= = = = +
= +
∑
+∑
+∑ ∑
(1)where, Y is the dependent variable (acetic acid content in the final product, g/L); β0 is a constant; βi, βii,and βijare
regression coefficients; and Xi and Xj are independent
variables.
A statistical analysis system from Design-Expert 8.0.5 Software (Trial version, Stat-Ease Inc., Minneapolis, MN, USA) was used for the statistical and graphical analyses
of the experimental data, p-values of less than 0.05 were
considered statistically significant. The quality of the predictive model was statistically evaluated using the coefficient of determination. All fermentation reactions were performed in triplicate, and the average values were reported.
3 Results and discussion
3.1 Model fitting
Thirty runs were conducted to optimize the four
process variables (X1, fermentation temperature; X2,
potassium ion concentration; X3, magnesium ion
concentration; and X4, calcium ion concentration) in the
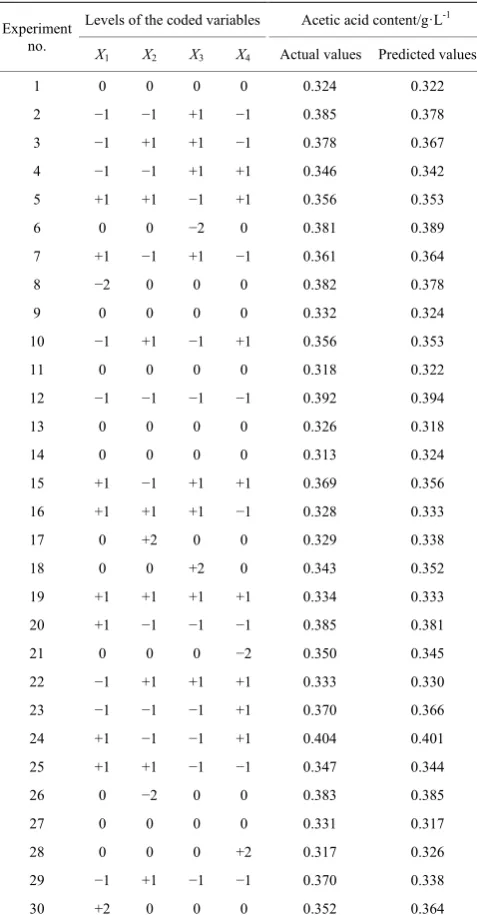
Table 2 Central composite design with the experimental and predicted values for acetic acid content after lychee wine
fermentation following addition 1.5 g/L of acetic acid
Experiment no.
Levels of the coded variables Acetic acid content/g·L-1
X1 X2 X3 X4 Actual values Predicted values
1 0 0 0 0 0.324 0.322
2 −1 −1 +1 −1 0.385 0.378
3 −1 +1 +1 −1 0.378 0.367
4 −1 −1 +1 +1 0.346 0.342
5 +1 +1 −1 +1 0.356 0.353
6 0 0 −2 0 0.381 0.389
7 +1 −1 +1 −1 0.361 0.364
8 −2 0 0 0 0.382 0.378
9 0 0 0 0 0.332 0.324
10 −1 +1 −1 +1 0.356 0.353
11 0 0 0 0 0.318 0.322
12 −1 −1 −1 −1 0.392 0.394
13 0 0 0 0 0.326 0.318
14 0 0 0 0 0.313 0.324
15 +1 −1 +1 +1 0.369 0.356
16 +1 +1 +1 −1 0.328 0.333
17 0 +2 0 0 0.329 0.338
18 0 0 +2 0 0.343 0.352
19 +1 +1 +1 +1 0.334 0.333
20 +1 −1 −1 −1 0.385 0.381
21 0 0 0 −2 0.350 0.345
22 −1 +1 +1 +1 0.333 0.330
23 −1 −1 −1 +1 0.370 0.366
24 +1 −1 −1 +1 0.404 0.401
25 +1 +1 −1 −1 0.347 0.344
26 0 −2 0 0 0.383 0.385
27 0 0 0 0 0.331 0.317
28 0 0 0 +2 0.317 0.326
29 −1 +1 −1 −1 0.370 0.338
30 +2 0 0 0 0.352 0.364
The experiment results indicated that the acetic acid content in the final lychee wine ranged from 0.313 g/L to 0.404 g/L. The minimum acetic acid content (0.313 g/L) was achieved at fermentation temperature of 20°C, potassium ion concentration of 6.0 mM, magnesium ion concentration of 4.0 mM, and calcium ion concentration of 0.10 mM, respectively. Multiple regression analysis on the experimental data indicated that the response variable and the test variables were related on the basis of the second-order polynomial Equation (2). The table shows that all of the remaining coefficients were statistically significant; the p-values were lower than α
(0.05). The identified statistical model defining acetic acid content is given below:
Y = 0.70479 – 0.031781X1 – 5.06944×10-4X2 –
3.13542×10-3X3 – 0.59792X4 – 2.55208×10-4X1X2 +
0.025313X1X4+7.63021×10-4X1X1+2.62731×10-4X2X2+
6.84896×10-4X3X3+0.38333X4X4 (2)
where, Y is the acetic acid content of the final lychee wine;
X1, X2, X3, and X4 are the coded variables for fermentation
temperature and the concentrations of potassium, magnesium, and calcium ions, respectively.
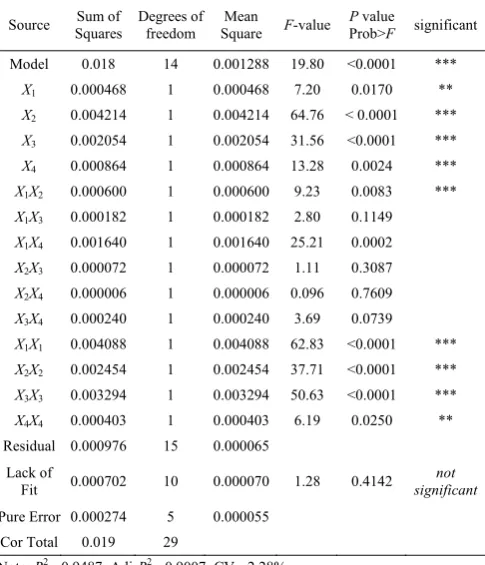
The fitted statistics of the acetic acid content (Y) for the selected quadratic predictive model are shown in
Table 3. According to ANOVA along with the R2
value of 0.9487 and the Adj R2 value of 0.9007, the
model was valid and exhibited a high correlation between the experimental and predicted values of the acetic acid content of lychee wine. The non-significance of the lack-of-fit (p>0.05) and the low values of CV (2.28%) indicated that the model was precise and reliable. Thus, the model was adequate for prediction in the range of the experimental variables.
Moreover, the model p-value (Prob>F) was very low
(<0.0001), indicating that the model terms were significant. Adequate precision measures of signal-to-noise ratio that are greater than four indicate
adequate model discrimination[20]. The experimental
ratio of 13.11 suggests an adequate signal. Thus, all these statistical parameters show the reliability of the model. The regression coefficient values of Equation (2) are shown in Table 3. For each term in the model,
a small p-value (p<0.05) and a large F-value would
imply a more significant effect on acetic acid content[21]. The linear coefficients (X1, X2, X3, and X4), quadratic
term coefficients (X1X1, X2X2, X3X3, and X4X4), and
interaction coefficients (X1X2 and X1X4) were significant
with very small p-values (p<0.05). Then, the other
term coefficients exerted no significant effect on acetic
acid content (p>0.05). Among the four independent
variables, potassium ion concentration (X2) exhibited the
greatest effect on acetic acid content (Y, g/L), followed
November, 2016 Wu R N, et al. Optimization of lychee wine fermentation process to reduce acetic acid content Vol. 9 No.6 227
Table 3 ANOVA for the response surface quadratic model
Source Squares Sum of Degrees of freedom Square Mean F-value Prob>P value F significant
Model 0.018 14 0.001288 19.80 <0.0001 ***
X1 0.000468 1 0.000468 7.20 0.0170 **
X2 0.004214 1 0.004214 64.76 < 0.0001 ***
X3 0.002054 1 0.002054 31.56 <0.0001 ***
X4 0.000864 1 0.000864 13.28 0.0024 ***
X1X2 0.000600 1 0.000600 9.23 0.0083 ***
X1X3 0.000182 1 0.000182 2.80 0.1149
X1X4 0.001640 1 0.001640 25.21 0.0002
X2X3 0.000072 1 0.000072 1.11 0.3087
X2X4 0.000006 1 0.000006 0.096 0.7609
X3X4 0.000240 1 0.000240 3.69 0.0739
X1X1 0.004088 1 0.004088 62.83 <0.0001 ***
X2X2 0.002454 1 0.002454 37.71 <0.0001 ***
X3X3 0.003294 1 0.003294 50.63 <0.0001 ***
X4X4 0.000403 1 0.000403 6.19 0.0250 **
Residual 0.000976 15 0.000065
Lack of
Fit 0.000702 10 0.000070 1.28 0.4142
not significant
Pure Error 0.000274 5 0.000055
Cor Total 0.019 29
Note: R2=0.9487; Adj-R2=0.9007; CV=2.28%.
3.2 Effect of fermentation parameters
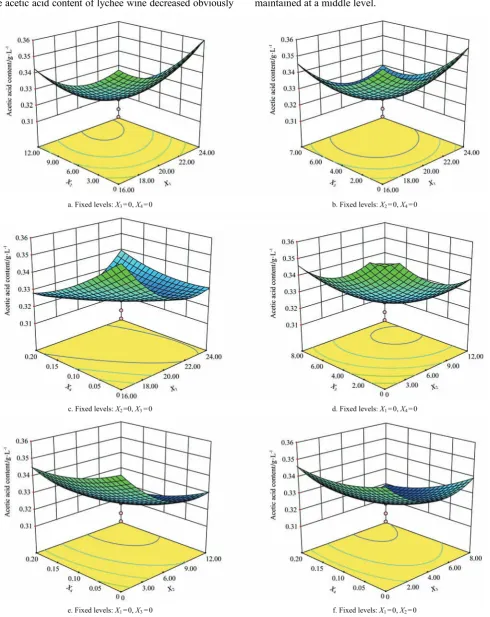
RSM was adopted to illustrate the effects of fermentation temperature and the different ion concentrations on the response. The effects of the four parameters on acetic acid content could be predicted by the regression model equation. These effects were illustrated in 3D response-surface plots and 2D contour plots of response surfaces. By considering all the possible combinations, we obtained six response surfaces. An elliptical contour plot indicates that the interactions between corresponding variables are negligible, whereas
a circular contour plot indicates otherwise[22]. The
interactive roles of fermentation temperature and the concentrations of potassium, magnesium, and calcium ions are illustrated in the 3D curves of the calculated response surface shown in Figure 1. Figure 1a indicates the effects of fermentation temperature and potassium ion concentration (X1X2) on the acetic acid content of lychee
wine. The tortuous surface and oval contour plot reveals a strong interaction between these two factors. A lower acetic acid content of lychee wine was obtained with a fermentation temperature between 18°C and 22°C and a potassium ion concentration between 9.0 mM and 12.0 mM. Acetic acid content increased with the increase in fermentation temperature (22°C-24°C) and
decrease in potassium ion concentration (0-9 mM). These results demonstrate that the effect of fermentation temperature (X1) and potassium ion concentration (X2) on
the acetic acid content of lychee wine was significant and highly consistent with the results in Table 3. The effect
of varying fermentation temperature (X1) and magnesium
ion concentration (X3) on acetic acid content is shown in
Figure 1b. A decrease in the acetic acid content of lychee wine was observed when the fermentation temperature and magnesium ion were maintained at 20°C and 6.0 mM (intermediate levels) and then increased with the increase in the fermentation temperature and magnesium ion concentration. The effects of
fermentation temperature (X1) and calcium ion
concentration (X4) on acetic acid content are shown in
Figure 1c. The ellipse in the contour plot denotes the existence of a perfect interaction between the independent
variables[22]. As shown, the acetic acid content
decreased readily when the calcium ion concentration and fermentation temperature were increased. However, with the further increase in fermentation temperature, the acetic acid content slightly increased.
The effects of potassium (X2) and magnesium ion
concentrations (X3) on acetic acid content (Y) are shown
in Figure 1d. As displayed, the acetic acid content decreased gradually with the increase of potassium ion concentration from 2.0 mM to 10.0 mM. However, beyond 10.0 mM, the acetic acid content increased as the potassium ion concentration rose. Acetic acid content decreased with the increase of magnesium ion concentration from 2.0mM to 6.0 mM. Further increase in magnesium ion concentration, a slowly rise in acetic acid content was observed. Figure 1e shows the
relationship between potassium (X2) and calcium ion
concentrations (X4) on acetic acid content, with the other
varying magnesium (X3) and calcium ion concentrations
(X4) at a fixed fermentation temperature (20°C) and
potassium ion concentration (6.0 mM). The results showed that at a high level of calcium ion concentration, the acetic acid content of lychee wine decreased obviously
with elevated levels of magnesium ion concentration. Meanwhile, the minimum acetic acid content could be obtained when the calcium ion concentration was fixed at a high level and the magnesium ion concentration was maintained at a middle level.
a. Fixed levels: X3=0, X4=0 b. Fixed levels: X2=0, X4=0
c. Fixed levels: X2=0, X3 =0 d. Fixed levels: X1=0, X4=0
e. Fixed levels: X1=0, X3 =0 f. Fixed levels: X1=0, X2=0
Note: X1: fermentation temperature; X2–X4: potassium, magnesium, and calcium ion concentrations, respectively.
Figure 1 Response surface (3D) showing the interaction effects of (a) X1 and X2, (b) X1 and X3, (c) X1 and X4, (d) X2 and X3,
November, 2016 Wu R N, et al. Optimization of lychee wine fermentation process to reduce acetic acid content Vol. 9 No.6 229 Fermentation temperature, potassium, magnesium,
and calcium ions played important roles in acetic acid removal during lychee wine making. The present study found that the maximum removal of acetic acid appeared when temperature was at 20°C. This was in agreement with a study conducted by Shang et al.[23] who found that the ability of yeast cells to remove acetic acid was strongest at 20°C. This result could be attributed to the
higher expression of ACS1, which contributed to the
reduced acetate levels during fermentation at 20°C[24].
Glyoxylate cycle is a specialized pathway that has been
extensively studied in connection with yeast growth on C2
compounds (e.g. acetic acid), and isocitrate lyase (ICL) and malate synthase (MS) are the signature enzymes of
the pathway[25]. ICL is a homotetramer requiring Mg2+
and thiol for activity. During catalysis, isocitrate is deprotonated, forming succinate and glyoxylate. This catalysis requires magnesium at optimal concentrations
between 3.0 mM and 8.0 mM[26]. The second enzyme of
the glyoxylate cycle is MS, which condenses glyoxylate with an acetyl group from acetyl-CoA to produce malate. MS also requires Mg2+ for activity[26]. More acetic acid removal and more malic acid produced (data not shown) fermentation at 20°C following addition of 6.0 mM magnesium ion, could result from a higher express level of the magnesium ion dependent ICL and MS. The enhanced ability of yeast for acetic acid removal following addition of calcium and potassium ions could be related to higher yeast viability and improved cell membrane permeability.
3.3 Model validation
By employing the software Design-Expert, the optimized conditions were as follows: fermentation temperature (X1) of 20.04°C, potassium ion concentration
(X2) of 10.07 mM, magnesium ion concentration (X3) of
6.14 mM, and calcium ion concentration (X4) of 0.20 mM.
To facilitate experimentation, the optimum conditions were adjusted to a fermentation temperature of 20°C and potassium, magnesium, and calcium ion concentrations of 10.1 mM, 6.1 mM, and 0.2 mM, respectively. Under the optimal conditions, the model-predicted acetic acid content was 0.314 g/L. The result of the analysis indicates that the experimental value (0.309 g/L) was in
good agreement with the predicted quantity and further confirms the adequacy of the RSM-predicted models.
4 Conclusions
RSM was used to determine the optimum fermentation parameters that removing the maximum
amount of acetic acid by S. cerevisiae. ANOVA
showed that all four parameters fermentation temperature, potassium, magnesium, and calcium ions concentration, were significant and quadratic models were obtained for predicting the responses. In the present study, the acetic acid content of the 30 experimented samples varied from 0.313 g/L to 0.404 g/L. The fermentation temperature of 20°C and potassium, magnesium, and calcium ion concentrations of 10.1 mM, 6.1 mM, and 0.2 mM were found to be optimal conditions for acetic acid removal by
S. cerevisiae during lychee wine fermentation. Under
these conditions, the minimum acetic acid content was achieved. Further studies on changes for sensorial characterization of the aroma and taste of lychee wine after deacidification following metal ions addition are needed.
Acknowledgments
This work was supported by the National Natural Science Foundation of China (Grant No. 31260398) and the Hainan Province Natural Science Foundation, P.R. China (Grant No. 313044).
[References]
[1] Ong P K C, Acree T E. Similarities in the aroma chemistry of Gewürztraminer variety wines and lychee (Litchi chinesis
Sonn.) fruit. Journal of Agricultural and Food Chemistry, 1999; 47(2): 665–670.
[2] Mahattanatawee K, Perez-Cacho P R, Davenport T, Rouseff R. Comparison of three lychee cultivar odour profiles using gas chromatography-olfactometry and gas chromatography- sulfur detection. Journal of Agricultural and Food Chemistry, 2007; 55(5): 1939–1944.
[3] Chen D, Chia J Y, Liu S Q. Impact of addition of aromatic amino acids on non-volatile and volatile compounds in lychee wine fermented with Saccharomyces cerevisiae
MERIT. ferm. International Journal of Food Microbiology, 2014; 170(17): 12–20.
Saccharomyces cerevisiae during fermentation in oenological conditions. Metabolic consequences. Food Chemistry, 2010; 119(3): 1220–1223.
[5] Alves J A, Lc D O L, Nunes C A, Dias D R, Schwan R F. Chemical, physical–chemical, and sensory characteristics of lychee (Litchi chinensis Sonn) wines. Journal of Food Science, 2011; 76(5): S330–S336.
[6] Ribéreau-Gayon P, Glories Y, Maujean A, Dubourdieu D. Alcohols and other volatile compounds. The chemistry of wine stabilization and treatments. Handbook of enology, vol. 2, 2nd edn. Wiley, Chichester, 2006; pp 51–64.
[7] Torija M J, Rozès N, Poblet M, Guillamón J M, Mas A. Effects of fermentation temperature on the strain population of Saccharomyces cerevisiae. International Journal of Food Microbiology, 2003; 80(1): 47–53.
[8] Jones R P, Greenfield P F. A review of yeast ionic nutrition: growth and fermentation requirements. Process Biochemistry, 1984; 19(2): 48–60.
[9] Walker G, Birch R. Magnesium, calcium and fermentative metabolism in industrial yeasts. Journal of the American Chemical Society, 1996; 54(1): 13–18.
[10] Walker G M. The role of magnesium in biotechnology. Critical reviews in biotechnology, 1994; 14(4): 311–354. [11] Rees M, Steward G. The effects of increased magnesium
and calcium concentration on yeast fermentation performance in high gravity worts. Journal of the Institute of Brewing, 1997; 103(5): 287–291.
[12] Wang B C, Shi L C, Zhou J, Yu Y Y, Yang Y H. The influence of Ca2+ on the proliferation of S. cerevisiae and low ultrasonic on the concentration of Ca2+ in the S.cerevisiae
cells. Colloids and Surfaces B: Biointerfaces, 2003; 32(1): 35–42.
[13] Lu K P, Means A R. Regulation of the cell cycle by calcium and calmodulin. Endocrine Reviews, 1993; 14(1): 40–58.
[14] Box G, Hunter Wand Hunter J. Statistics for Experiments. Wiley, New York. 1997.
[15] Özkan G, Ürkmez G, Özkan G. Application of Box–Wilson optimization technique to the partially oriented yarn properties. Polymer-Plastics Technology and Engineering, 2003; 42(3): 459–470.
[16] Entian K D, Barnett J. Regulation of sugar utilization by
Saccharomyces cerevisiae. Trends in Biochemical Sciences, 1992; 17(12): 506–510.
[17] Giachetti E, Vanni P. Effect of Mg2+ and Mn2+ on isocitrate lyase, a non-essentially metal-ion-activated enzyme. Journal of Biochemistry; 1991; 276(1): 223–230.
[18] Box G E P, Wilson K B. On the experimental attainment of optimum conditions. J R Stat Soc. 1951; 13(1): 1–45. [19] Zou T B, Jia Q, Li H W, Wang C X, Wu H F. Response
surface methodology for ultrasound-assisted extraction of astaxanthin from haematococcus pluviali. Marine Drugs, 2013; 11(5): 1644–1655.
[20] Myers R, Montgomery R C, Anderson-Cook C M. Response surface methodology, process and product optimization using design experiments (3th ed.). New York: Wiley. 2009.
[21] Li Q H, Fu C L. Application of response surface methodology for extraction optimization of germinant pumpkin seeds protein. Food Chemistry, 2005; 92(4): 701–706.
[22] Muralidhar R V, Chirumamil R R, Marchant R, Nigam P. A response surface approach for the comparison of lipase production by Candida cylindracea using two different carbon sources. Biochemical Engineering Journal, 2001; 9(1): 17–23.
[23] Shang Y H, Zeng Y J, Zhu P, Zhong Q P. Acetate metabolism of Saccharomyces cerevisiae at different temperatures during lychee wine fermentation. Biotechnology & Biotechnological Equipment, 2016; 30(3): 512–520.
[24] Remize F, Andriru E, Dequin S. Engineering of the pyruvate dehydrogenase by pass in Saccharomyces cerevisiae: role of the cytosolic Mg2+ and mitochondrial K+ acetaldehyde
dehydrogenases Ald6p and Ald4p in acetate formation during alcoholic fermentation. Appl Environ Microbiol. 2000; 66(8): 3151–3159.
[25] Dunn M F, Ramíırez-Trujillo J A, Hernáandez-Lucas I. Major roles of isocitrate lyase and malate synthase in bacterial and fungal pathogenesis. Microbiology, 2009; 155(10): 3166–3175.