M E T H O D O L O G Y
Open Access
A benchmark of transposon insertion
detection tools using real data
Pol Vendrell-Mir
1, Fabio Barteri
1, Miriam Merenciano
2, Josefa González
2, Josep M. Casacuberta
1*and
Raúl Castanera
1*Abstract
Background:Transposable elements (TEs) are an important source of genomic variability in eukaryotic genomes. Their activity impacts genome architecture and gene expression and can lead to drastic phenotypic changes. Therefore, identifying TE polymorphisms is key to better understand the link between genotype and phenotype. However, most genotype-to-phenotype analyses have concentrated on single nucleotide polymorphisms as they are easier to reliable detect using short-read data. Many bioinformatic tools have been developed to identify transposon insertions from resequencing data using short reads. Nevertheless, the performance of most of these tools has been tested using simulated insertions, which do not accurately reproduce the complexity of natural insertions.
Results:We have overcome this limitation by building a dataset of insertions from the comparison of two high-quality rice genomes, followed by extensive manual curation. This dataset contains validated insertions of two very different types of TEs, LTR-retrotransposons and MITEs. Using this dataset, we have benchmarked the sensitivity and precision of 12 commonly used tools, and our results suggest that in general their sensitivity was previously overestimated when using simulated data. Our results also show that, increasing coverage leads to a better sensitivity but with a cost in precision. Moreover, we found important differences in tool performance, with some tools performing better on a specific type of TEs. We have also used two sets of experimentally validated insertions inDrosophilaand humans and show that this trend is maintained in genomes of different size and complexity. Conclusions:We discuss the possible choice of tools depending on the goals of the study and show that the appropriate combination of tools could be an option for most approaches, increasing the sensitivity while maintaining a good precision.
Keywords:Benchmark, Transposable elements, Polymorphism, Transposon insertion, Resequencing
Background
Transposable elements (TEs) constitute a very important fraction of eukaryotic genomes, and their ability to trans-pose, excise and produce complex genomic rearrangements make them a key source of genomic diversity. Previous work done over the last decades has uncovered their enor-mous potential as gene regulators, a role that TEs play through a variety of genetic and epigenetic mechanisms [12,43]. Certain TEs, such as Long Terminal repeat (LTR)-retrotransposon carry their own promoters, and their
insertion close to genes can generate new gene expression patterns. In addition, TEs, and in particular LTR-retrotransposons and MITEs (Miniature Inverted Trans-posable Elements), have been shown to contain transcrip-tion factor binding sites, which can be mobilized by transposition rewiring new genes into pre-existing tran-scriptional networks [5, 12, 20]. As a consequence, TEs have the potentiality to generate important genomic and transcriptional variability, and the interest in these elements has drastically increased in the last years.
Due to their repetitive nature and their sequence diversity, the annotation of TEs is more complex than that of protein coding genes. Nevertheless, thanks to the
development of tools such as Repeatmasker (http://
www.repeatmasker.org) and sophisticated pipelines such
© The Author(s). 2019Open AccessThis article is distributed under the terms of the Creative Commons Attribution 4.0 International License (http://creativecommons.org/licenses/by/4.0/), which permits unrestricted use, distribution, and reproduction in any medium, provided you give appropriate credit to the original author(s) and the source, provide a link to the Creative Commons license, and indicate if changes were made. The Creative Commons Public Domain Dedication waiver (http://creativecommons.org/publicdomain/zero/1.0/) applies to the data made available in this article, unless otherwise stated. * Correspondence:[email protected];
1Centre for Research in Agricultural Genomics CSIC-IRTA-UAB-UB, Campus
UAB, Edifici CRAG, Bellaterra, 08193 Barcelona, Spain
as REPET [16], methodologies of TE detection and an-notation in assembled genomes are today robust. The availability of high-quality reference genomes coupled with the exponential increment of resequencing data has boosted our capacity to evaluate intraspecific variability. By obtaining accurate maps of genetic variation, charac-terizing the genetic basis of phenotypic variance is now possible at a genome-wide scale thanks to association studies (GWAS). Until now, most of the efforts have been focused on analyzing the variability at the nucleotide level (SNPs, single nucleotide polymorphisms), as there are ro-bust algorithms to perform variant calling. However, TEs generate an important part of the genetic variability present in a particular species. Moreover, the timing of oc-currence of TE and SNP mutations is different, as the former can amplify in bursts generating a great amount of diversity in short periods of time, whereas SNP mutation rates are more constant in time. Therefore, the identifica-tion of Transposon Inseridentifica-tion Polymorphisms (TIPs) is of high interest. Nevertheless, our capacity to accurately identify TIPs using re-sequencing data is hampered by the structural complexity of TEs.
In the last few years, many laboratories have developed bioinformatic tools to look for TIPs and have started to analyze their impact in intra-species variability, including crop plants [7, 10, 42]. There are two main approaches that can be used to detect TIPs in whole-genome se-quence data: i) inference from discordant read-pair map-pings, and ii) clustering of ‘split’reads sharing common alignment junctions [2, 15]. Most of the recently devel-oped tools incorporate both methodologies, and in some
cases TIPs have been experimentally validated [27].
Moreover, in some cases the authors have evaluated their sensitivity and precision (also known as positive predictive value) [11, 24]. However, in most cases these evaluations were performed by generating simulated in-sertions that are randomly placed in the genome, and then used to compare with tool predictions. Simulated insertions are far from representing the complexity of
“natural” TIPs, as many of their features are difficult or impossible to mimic accurately (i.e.: element degener-ation, nested insertions, insertion preferences, etc.). As a consequence, the benchmarks done with simulated data tend to overestimate performance of the tools analyzed
[21]. An example of such benchmarks is the one
re-ported by the developers of McClintock, a pipeline that integrates six tools [36] (Table1). In their study, the au-thors provided a detailed comparison of their compo-nent’s performance in sensitivity and positional accuracy based on simulated LTR-retrotransposon insertions, which also includes some real resequencing data, in the yeastSaccharomyces cerevisiae. In spite of the interest of such comparative analysis, the direct translation of these results to other eukaryotic models with bigger and more
repetitive genomes is uncertain. This is especially
rele-vant as S. cerevisiae contains only 51 full
LTR-retrotransposons in the whole genome [8], whereas in
most plant and animal genomes the
LTR-retrotransposon load is several orders of magnitude higher. Also, a recent study focused on simulated but also real human AluY, L1 and SVA families revealed huge differences in the ability of seven tools to detect TIPs [41]. In spite of the importance of these families for human research, they do not represent the diversity of the TE landscape of other animals and plants, which is far more complex, with many families from different orders being potentially active, and where the amount of truncated non-autonomous elements greatly outnum-bers the active copies.
In plants, TEs are at the origin of important agronomic traits, such as apical dominance in maize [45], the skin and flesh colors in grape [28] and blood oranges [4]. Dif-ferent efforts have been made recently to identify TIPs that could be responsible for important variability in plants. Carpentier et. al[7] screened the presence of 32 rice LTR-retrotransposon families in the 3000-rice gen-ome dataset and uncovered more than 50,000 TIPs, most of them occurring at a very low frequency, which is indi-cative of recent activity. Besides LTR-retrotransposons, MITEs are probably the most prevalent group of transpo-sons in plants, including rice, where they have experienced recent massive amplification bursts [10, 35]. MITEs are structurally very different from LTR-retrotransposons, as they are non-autonomous, usually non-coding, and rela-tively small. They are of particular interest because they tend to integrate close to genes and may carry regulatory domains [20], having the potential to create or rewire regulatory networks [12]. In the present study, we have taken advantage of the existence of several high-quality as-sembled genomes of different rice varieties to create a vali-dated dataset of natural LTR-retrotransposon and MITE insertions obtained by direct comparison between the as-sembled genomes (Nipponbare and MH63), that we have used to benchmark the performance of 12 TIP calling tools. Moreover, we have also analyzed the sensitivity of the best performing tools to detect experimentally
vali-dated TIPs in Drosophila and humans. Our results
evi-dence that tool performance is in general lower than estimated by previous simulations, and highly variable de-pending on sequencing coverage and TE type. Also, we show that an appropriate combination of tools can in-crease the sensitivity of predictions while maintaining high precision levels.
Results
Tools selected for benchmarking
We selected 12 of the most widely used tools for the
specifically designed to detect non-reference insertions (not present in the reference genome) (RelocaTE2 [11], Jitterbug [21], Retroseq [27] and ITIS [24]), and eight were able to detect reference (present in the reference
genome) and non-reference insertions (MELT [18],
Popoolation TE2 [29], Teflon [1], Trackposon [7], TEMP [48], TE-locate [37], Popoolation TE [30], and ngs_te_ mapper [32]. Tools specifically designed to detect pres-ence/absence of reference TE insertions in re-sequenced genomes (i.e.: T-lex 3) [3] were not benchmarked here.
In addition to their different targets, some of the tools were family-specific (meaning that they run with one TE family at a time only), whereas most of them are able to detect insertions from all the families in the same run (broad-spectrum). Five out of the 12 tested tools were run as components of McClintock, a pipeline that com-bines the use of several TIP detection tools and stan-dardizes their outputs into the commonly used BED format (Table1).
The first difficulty that the user has to face is properly installing and making the tools run, often in a computer
cluster. This can be sometimes complex due to the num-ber of different dependencies, and especially due to the specificity of the input file preparation. In this regard, we found that RelocaTE2, PopoolationTE2 and Trackpo-son were the less problematic tools (Table1). One possi-bility that would make the installation of these tools much easier would be to have them integrated in an en-vironment such as Conda. This is a possibility that fu-ture developers should take into account.
LTR-retrotransposon and MITE landscape in Nipponbare and MH63 genomes
In order to perform a benchmarking exercise that could be representative of as much as possible TIP detection in eukaryotes, we decided to use rice as a model as it has a genome of 430 Mb, which is relatively large and complex in terms of TE landscape, and that has already been considered as being as close as possible to a
repre-sentative genome for angiosperms [7]. Moreover, there
are several good-quality assemblies and short-read data-sets of rice varieties available [23, 47]. In terms of the
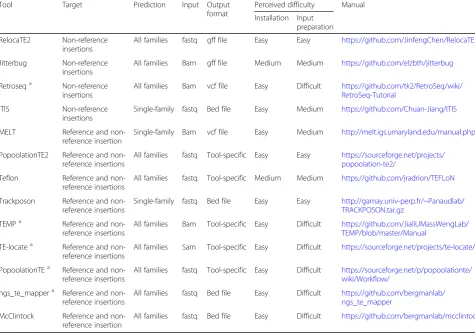
Table 1Tools selected for the benchmark of TE insertions
Tool Target Prediction Input Output format
Perceived difficulty Manual
Installation Input preparation
RelocaTE2 Non-reference insertions
All families fastq gff file Easy Easy https://github.com/JinfengChen/RelocaTE2
Jitterbug Non-reference insertions
All families Bam gff file Medium Medium https://github.com/elzbth/jitterbug
Retroseqa Non-reference insertions
All families Bam vcf file Easy Difficult https://github.com/tk2/RetroSeq/wiki/ RetroSeq-Tutorial
ITIS Non-reference insertions
Single-family fastq Bed file Easy Medium https://github.com/Chuan-Jiang/ITIS
MELT Reference and non-reference insertion
Single-family Bam vcf file Easy Medium http://melt.igs.umaryland.edu/manual.php
PopoolationTE2 Reference and non-reference insertions
All families fastq Tool-specific Easy Easy https://sourceforge.net/projects/ popoolation-te2/
Teflon Reference and non-reference insertions
All families fastq Tool-specific Medium Medium https://github.com/jradrion/TEFLoN
Trackposon Reference and non-reference insertions
Single-family fastq Bed file Easy Easy http://gamay.univ-perp.fr/~Panaudlab/ TRACKPOSON.tar.gz
TEMPa Reference and non-reference insertions
All families Bam Tool-specific Easy Difficult https://github.com/JialiUMassWengLab/ TEMP/blob/master/Manual
TE-locatea Reference and
non-reference insertions
All families Sam Tool-specific Easy Difficult https://sourceforge.net/projects/te-locate/
PopoolationTEa Reference and non-reference insertions
All families fastq Tool-specific Easy Difficult https://sourceforge.net/p/popoolationte/ wiki/Workflow/
ngs_te_mappera Reference and
non-reference insertions
All families fastq Bed file Easy Difficult https://github.com/bergmanlab/ ngs_te_mapper
McClintock Reference and non-reference insertion
All families fastq Bed file Easy Difficult https://github.com/bergmanlab/mcclintock
a
These tools were run as part of the McClintock pipeline. Perceived difficulty refers to McClintock and not the original methods
TEs to be detected, we concentrated on LTR-retrotransposons and MITEs as, in addition to be the most prevalent TE types in plant genomes, they are functionally and structurally very different. Indeed, whereas LTR-retrotransposons are relatively long ele-ments (typically several Kb-long) and contain many structural features relatively easy to detect (e.g.: long LTRs at their extremities, coding capacity for several well conserved enzymatic activities), MITEs are short (typically 100–800 nt), are non-coding and do not con-tain structural features (except for short inverted-repeats in most cases) allowing for structural detection.
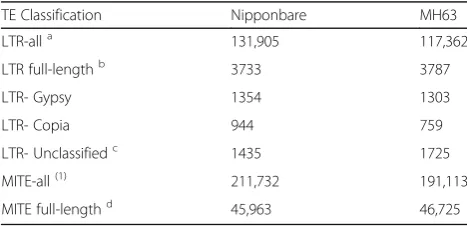
We used a combination of structural and
homology-based approaches to annotate a
high-quality dataset of 3733 and 3787 full-length LTR-retrotransposons in Nipponbare and MH63 (Minghui
63) assemblies, respectively (Table 2). These elements
contain intact Target Site Duplications (TSDs), Long Terminal Repeats as well as coding domains. All of them were clustered at 80% similarity over 80% length to obtain families and we derived a consensus for each family. RepeatMasker was then run with
such consensuses to identify all the
LTR-retrotransposon copies of the genome (including frag-ments and non-autonomous elefrag-ments) related to the characterized families. A similar strategy was used to identify ~ 46,000 full-length MITEs, as well as ~ 200, 000 partial MITE copies (see methods section). Whereas full-length LTR-retrotransposons represent a very small proportion of the total number of
LTR-retrotransposon copies detected, (3%, Table 2),
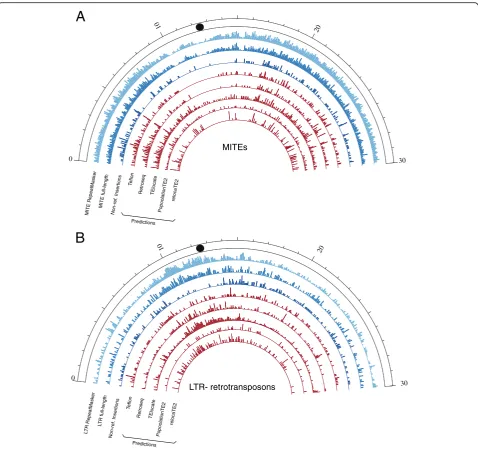
full-length MITEs represent an important fraction (23%). The distribution along the chromosomes of the two
transposon groups is also different, with
LTR-retrotransposons being more abundant in the
centro-meric and pericentromeric regions and MITEs
populating evenly the rest of the chromosome
(Fig. 1).
Annotation of standard transposon insertion datasets for tool benchmarking
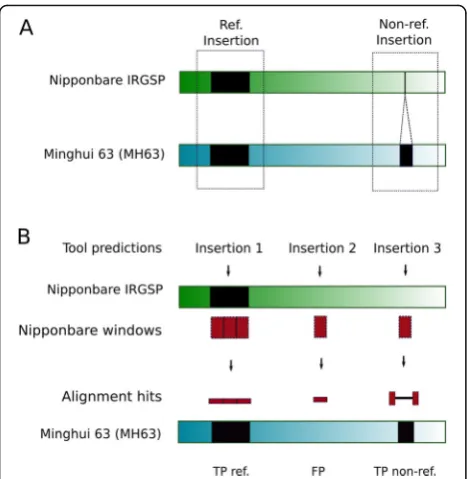
The most straightforward way of identifying an insertion
polymorphism “in silico” when two high quality
assem-bled genomes are available (as it is here the case), is by aligning orthologous loci. To identify the Nipponbare orthologous loci to those that in MH63 contain a TE in-sertion, we mapped the flanking regions of each MH63 full-length LTR-retrotransposon and MITE insertion against the Nipponbare genome. As sequence diversity and structural differences between the two genomes may complicate this analysis, we tested different flanking se-quence lengths and found that 500 nt was the one that allow to identify more reference and non-reference in-sertions (Additional file 6: Figure S1). By inspecting the distance between the two mapped flanks, we could as-sign the orthology status to the locus (ie, empty site or full site). Using this approach, we were able to assign an orthology status to 86% of the MITE loci, but only to 41% of the LTR-retrotransposons loci. This was probably due to the difficulty to identify the orthologous loci of insertions siting in repetitive sequences, which is much more frequent for LTR-retrotransposons than for MITEs. Therefore, although this strategy seems the more straightforward, it has clear limitations. Moreover, as defining the precise TE-genome junctions for non-full length elements (ie, degenerated or partial elements, which are the vast majority of LTR-retrotransposons, Table1) is challenging, we could not use this strategy to analyze the possible polymorphisms arising from non-full-length LTR-retrotransposons. To overcome those limitations and increase the dataset of curated insertions, we developed a strategy aimed at complementing the TIPs dataset with TIPs predicted with the 12 tools ana-lyzed here (Table 2), which were individually validated. To this end we ran the different TIP-prediction tools using MH63 paired-end reads mapped to the Nippon-bare reference genome. We divided the NipponNippon-bare genome in 500 nt windows and mapped the windows containing predicted insertions (red boxes, Fig.2) to the MH63 genome. An inspection of the aligned sections allowed determining whether the predicted insertion corresponded to a reference (shared) or non-reference (MH63 specific) insertion or if it should be considered a
false positive (Fig. 2b). Indeed, in case of reference
(shared) insertions, the Nipponbare and the correspond-ing MH63 sequences would perfectly align, showcorrespond-ing that the sequence, which contains a TE insertion is conserved in both genomes (Fig. 2b, left); in case of a non-reference (MH63 specific) insertion, the alignment will be split by an insertion in the MH63 sequence
cor-responding to an annotated TE (Fig. 2b, right); and in
case where the two sequences show a continuous align-ment in the absence of an annotated TE insertion in
Table 2Annotation of LTR-retrotransposons and MITEs in rice assemblies
TE Classification Nipponbare MH63
LTR-alla 131,905 117,362
LTR full-lengthb 3733 3787
LTR- Gypsy 1354 1303
LTR- Copia 944 759
LTR- Unclassifiedc 1435 1725
MITE-all(1) 211,732 191,113
MITE full-lengthd 45,963 46,725 a
Repeatmasker fragments. Includes both intact and truncated elements
b
High confidence elements containing intact LTRs, TSDs and coding domains
c
Intact elements whose poor coding domain conservation doesn’t allow proper classification
d
Nipponbare, this will indicate that the TE prediction is a false positive (Fig. 2b, middle). After running all tools, adjacent windows corresponding to TIP predictions of the same category were merged to produce a final dataset. LTR-retrotransposon insertions are frequently more complex than MITEs (i.e.: length, tendency to form nested insertions and extremely high amount of
truncated and degenerated elements, Table 2). Because
of this, it was difficult in many cases to automatically validate the insertions. Therefore, manual inspection of the alignments of LTR-retrotransposons TIPs was
performed, and we decided to restrict the dataset of LTR-retrotransposons to a single chromosome (chr5).
This strategy combined the power of detection of read-based methods (useful for uncovering polymor-phisms derived from both full and degenerated ele-ments), with the reliability of the validation based on alignments between high-quality assembled genomes. By using this combined approach, we increased the number of validated non-reference MITE insertions from 1898 to 3117 whereas for LTR-retrotransposons (chr5) the amount of non-reference insertions in our validated
20
0
10
10
30
0
20
30
MITEs
LTR- retrotransposons
MITE full-length MITE RepeatMasker
Teflon Retroseq TElocate
PopoolationTE2 relocaTE2
Non-ref. Insertions
LT R full-length
LTR RepeatMasker
Teflon
Retroseq TElocate
PopoolationTE2 relocaTE2
Non-ref. Insertions
Predictions
Predictions
A
B
dataset increased from 22 to 239 (Additional file2: Table S1). The result was a high-quality dataset of True Positive (TP) and False Positive (FP) reference and
non-reference insertions (Additional file 2: Table S1). In
addition, there were predicted insertions that did not match neither with TP nor FP (i.e.: cases that did not fit in the scenarios described in Fig. 2b). We analyzed the specific cases of unclassified non-reference insertions and found that 86% of these LTR-retrotransposon pre-dicted TIPs and 92% of such MITE TIPs overlapped with other transposons annotated in the reference. These cases were not used for downstream analyses, as most tools specifically indicate in their manuals that they cannot properly detect nested insertions. In order to evaluate the performance of each tool, we intersected the windows corresponding to the TE insertions pre-dicted by the tool (both reference and non-reference TE insertions) with those of the curated dataset to identify
TP and FP (Fig. 2b). Insertions present in the curated
dataset of TE insertions that were not detected by the evaluated tool were counted as False Negatives (FN).
Most of the tools analyzed here are able to detect insertions from all the families in the same run (broad-spectrum). Some of these tools are able to detect refer-ence and non-referrefer-ence insertions, whereas others only detect non-reference insertions. The programs use dif-ferent strategies to identify these two types of insertions,
and consequently we analyzed their performance
separately.
Detection of reference insertions by broad-spectrum tools We observed that whereas the precision detecting MITE and LTR-retrotransposon reference insertions was very high for both types of elements, the sensitivity levels of
most of the tools were much higher for MITEs (Fig. 3).
For MITEs, the sensitivity of most tools increased with coverage and tended to stabilize at 20-40X coverage (Fig. 3a). Teflon had consistently the best sensitivity and overall performance (F1-score) in the detection of refer-ence MITE insertions even at low coverage, reaching a sensitivity of 74% at 10X with an almost 100% precision (Fig. 3a). All tools showed precision levels higher than 99% at all coverages, and all tools except ngs_te_mapper
yielded a sensitivity higher than 60% at 40X (Fig. 3a,
Additional file3: Table S2). By contrast, the sensitivity at 5X was low in general, with Teflon being the only tool reaching more than 50% (Fig.3a).
Regarding the detection of reference
LTR-retrotransposons, the general tool performance was
much lower than for MITEs (Fig. 3b). In this case,
TE-locate reached the maximum sensitivity followed by Teflon and was only slightly higher than 50% (Fig. 3b), and the other tools remained below 40% sensitivity. The sensitivity of TE-locate was higher than 50% in all the coverages, whereas in Teflon, PopoolationTE2 and
Popoo-lationTE it increased with coverage (Fig. 3b). When we
focused only on the detection of full-length LTR-retrotransposons, the performance of all tools increased considerably, reaching a maximum sensitivity of 85.4% (Fig.3c). TE-locate was again the best performer showing a sensitivity over 80% for all the coverages. We excluded the predictions of TEMP for reference insertions, as this tool is based on the detection of absences assuming the presence as default, which leads to an overestimation of the number of insertions, especially at a very low coverage.
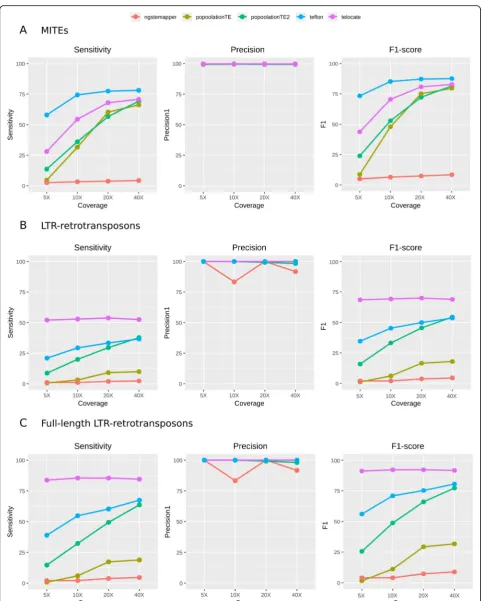
Detection of non-reference insertions by broad-spectrum tools
All the benchmarked tools are able to detect non-reference insertions, a task that is more challenging than detecting reference insertions, as the former are not present in the reference genome to which the reads are
mapped. In this case sensitivity was strongly dependent
on coverage (Fig. 4). Precision was very different for
MITE and LTR-retrotransposon predictions, showing a tendency to decrease at high coverage (Fig.4). Regarding MITEs, Teflon was the best performer followed by
PoPoolationTE2 and Retroseq (Fig. 4a). These tools
reached a sensitivity close to 75% (up to 75.6% in 40X coverage for Teflon), whereas the rest of the tools had a much lower sensitivity (Fig.4a). The precision was very high (> 95%) for most tools with the exception of TE-locate, which dropped from 92.5% in 5X to 75.6% in 40X. All the tools improved their performance when the coverage increased (except Jitterbug, which performed the best at 20X), with PopoolationTE2 and Retroseq showing the steepest increase, especially between 5X and 20X (Fig.4a).
Regarding LTR-retrotransposons, PopoolationTE2
achieved the highest sensitivity, reaching a maximum of 88.5% at 40X (Fig.4b). Nevertheless, these tools yielded
a high number of false positives, which translates into low precision levels (Fig. 4b). In general, the precision detecting LTR-retrotransposons with respect to MITEs was much lower for all tools. Jitterbug was the only pro-gram with a moderate precision (> 75%) across all cover-age levels, although its sensitivity was low (maximum of
32.7% at 40X) (Fig. 4b). According to the F1-score,
PopoolationTE2 and Teflon were the best performers at low coverages (5X-10X), whereas at higher coverages PopoolationTE2 and Jitterbug showed the best balance between sensitivity and precision (Fig.4b). Differently to what we previously did for reference insertions, we did not compute the performance of the tools using only full-length LTR-retrotransposons because they represent only a small fraction of the non-reference annotated insertions.
The output of most tools contains information that can be used for filtering the putative insertions to achieve more precise detection levels. We checked
different filters for each program looking for gains in precision with a low cost in sensitivity. In some cases, such as Jitterbug, the precision was already very high, and the filtering was not needed. In others, the cost in sensitivity was too high and the filtering was not consid-ered useful. For the two best-performing tools, Popoola-tionTE2 and Teflon, filtering did result in significative gains in precision without an excessive cost in sensitiv-ity. For PopoolationTE2 we applied a zygosity filter of 0.7 (based on the fraction of reads supporting the inser-tion) which led to a drop of sensitivity for both MITEs (from 76 to 63%) and LTR-retrotransposons detection (from 88 to 65%, Additional file 7: Figure S2), but with an increase of precision, which was particularly striking for LTR-retrotransposons (from 28.9 to 91.9% at 40X). For Teflon, a zygosity filter of 1 resulted in a drop of sensitivity for MITEs (from 78 to 61.5%) and LTR-retrotransposons (from 57.7 to 44.2%) but with import-ant gain in precision for LTR-retrotransposons (from 15.2 to 70.8%), which was not significative for MITEs (98.4 to 98.5%) (not shown). In summary, based on the F1-score, filtering by zygosity greatly improved the over-all performance of PopoolationTE2 and Teflon for LTR-retrotransposon detection, whereas the effect of this fil-ter on MITEs detection was much less pronounced due to the already high precision of the unfiltered results.
Detection of non-reference insertions by family-specific tools
Some tools have been designed to look only for TIPs of a single TE family instead of all families at the same time (i.e., ITIS, MELT and Trackposon). In order to analyze the performance of such tools, we used the largest MITE and LTR-retrotransposon families, which contain 194 (whole genome) and 22 (chr5) MH63-specific insertions, respectively (Additional file7: Table S1). The analysis of MITE TIPs showed that ITIS and MELT did not per-form well and displayed low sensitivity and overall F1-score levels (Fig.5a). By contrast, Trackposon performed well, displaying up to 72.8% sensitivity with 93.1 preci-sion at 40X coverage. In line with the results found for broad-spectrum tools, sensitivity in the detection of LTR-retrotransposons was strongly dependent on the coverage. Trackposon and MELT showed moderate sen-sitivity levels at 40X (58.6 and 55.2%, respectively) whereas ITIS reached a maximum of sensitivity of 13.8%. Regarding precision, Trackposon was the best performer with values ranging between 76.9 and 100% (Fig.5b).
Overlap between TIP prediction tools
As there is no tool showing 100% sensitivity, we asked whether the predictions of the different tools were com-mon or specific for each tool. We evaluated the overlap
of the detected non-reference true and false positives for the five better performing tools for MITE or LTR-retrotransposon TIP predictions (40X), taking into ac-count their sensitivity and precision. In spite of the dif-ference in the amount of predictions between MITEs and LTR-retrotransposons, the results showed very similar trends: 54% of TP were detected only by one tool for both MITE and LTR-retrotransposon insertions (Fig. 6). As expected, the FP detected were tool-specific in the vast majority of the cases (90.2% were detected by
only one tool for MITEs and 98% for
LTR-retrotransposons). The number of insertions detected by all tools was very low (1.3% of all TIPs detected for MITEs and 1.4% for LTR-retrotransposons). These re-sults suggest that combining tools may increase the sen-sitivity of the TIP detection, although this may come with the cost of decreasing precision, as false positives are highly tool-specific.
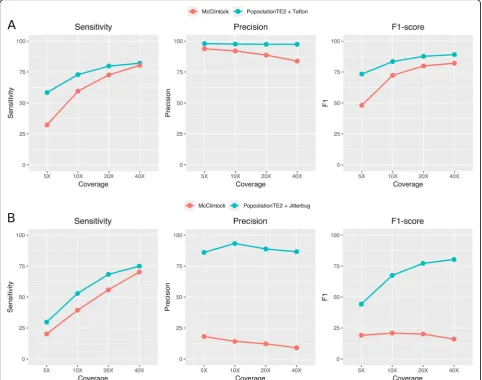
Combining tools to improve sensitivity
Our previous results suggest that a combination of tools could be useful to increase the sensitivity in identifying non-reference transposon insertions. To this end, we combined the predictions of PopoolationTE2 (the overall best performer) sequentially with up to four tools se-lected based on their sensitivity and/or precision levels. As a general trend, the combination of tools led to higher sensitivity levels, reaching more than 90% for both MITEs and LTR-retrotransposons at 40X coverage
when combining five different tools (Fig. 7). However,
the increase in sensitivity comes with a decrease in pre-cision, particularly clear for LTR-retrotransposons, that approaches 10% for 40X coverage when combining five different tools. The results presented suggest that the combination of two tools provided the best balance be-tween sensitivity and precision. Specifically, the combin-ation of zygosity-filtered Popoolcombin-ationTE2 and Teflon for MITEs reached 82.1% sensitivity and 97.4% precision at 40X. Regarding LTR-retrotransposons, the combination
of zygosity-filtered PopoolationTE2 and Jitterbug
reached 75% sensitivity and 86.7% precision at 40X. As already mentioned, McClintock is an available pipeline that combines several tools. Therefore, we com-pared the performance of the combination of tools here proposed with that of the McClintock pipeline, which combines the use of Retroseq, TEMP, TE-locate, Popoo-lationTE and ngs_te_mapper (we excluded RelocaTE from the pipeline due to excessive running time). The combination of tools here proposed (PopoolationTE2 and Jitterbug for LTR-retrotransposon insertions and PoPoolationTE2 and Teflon for MITEs) yielded consist-ently a better sensitivity and much better precision and F1-scores than McClintock at all coverages (especially in
important differences were found in precision at inter-mediate and high coverages. As an example, for MITEs at 40X PopoolationTE2-Teflon had 97.4% precision
whereas McClintock had 83.8% (Fig. 8a). Regarding
LTR-retrotransposons at 40X, PoPoolationTE2-Jitterbug precision was 86.7%, whereas that of McClintock dropped to 9% (Fig.8b).
Evaluation of best-performing tools usingDrosophilaand human datasets
In order to evaluate whether the benchmarking results using rice data could be extrapolated to data obtained from other species, we benchmarked the best performing tools (PoPoolationTE2, Teflon and Jitterbug) using
PCR-validated TIPs from Drosophila and humans. The
Dros-ophila dataset consisted of 81 TIPs from tenDrosophila lines sequenced at an average coverage of 42X [22]. This
dataset contained TIPs from 12 different transposon fam-ilies, including retrotransposons (LTR and LINE) and cut-and-paste DNA transposons (TIR) experimentally vali-dated by Lerat et al. [31] Merenciano et al. [33] and Ullas-tres et al. [46] (Additional file 4: Table S3). The human dataset consisted of 148 TIPs obtained from one human individual at a coverage of 20X [44]. This dataset consisted of TIPs related to ALU, SVA and LINE-1 retroelements. In the analysis of human insertions, we also included MELT, as it is the best-established tool for the detection of human TE polymorphisms. The detection levels of
PoPoolationTE2 and Teflon in Drosophila were
moder-ately high (69.1% of the insertions, Table3and Additional file 5: Table S4), and substantially higher than Jitterbug (44.4% of the insertions). Using the combination of the three tools, we were able to detect 81.5% of the insertions. These results are in high concordance with the sensitivity
levels found using rice data with LTR-retrotransposons and MITEs, where PoPoolationTE2 and Teflon showed superior detection levels to Jitterbug (Fig. 4). Regarding the human sample, MELT was the best tool identifying
homozygous insertions (97.8%, Table4), whereas
PoPoo-lationTE2 was the best detecting heterozygous insertions (88.2%). Taking into account both kind of insertions, PoPoolationTE2 outperformed MELT, displaying an aver-age detection level of 90.5%. The detection rate of these
two programs was higher on human data than in
Drosoph-ila or rice, where sensitivity levels rarely exceeded 70% using 20X coverage (Fig.4). The detection levels of Jitter-bug were similar to those found usingDrosophilaand rice, ranging from 47.8 to 51%. Teflon was unable to complete the task and the process was killed after five running days. Using the combination of tools, the detection rate in-creased only 3.4% for the human dataset, reaching up to 93.9% (Table4).
Running time
Computation time is a limiting factor when running TIP detection tools in large datasets. Therefore, it is an im-portant criterion to take into consideration for selecting the most appropriate tool for a specific experiment. We tested the time needed by the tools to finish the predic-tion with a 10X dataset and 432 MITE families as input. It is important to mention that three tools (Trackposon, ITIS and MELT) work on a per-family basis. In these cases, the reported time was that needed to finish the prediction for a single family. By contrast, the remaining tools work with all the annotated TE families at the same time. According to our results, Trackposon was the fastest tool, with only 1.7 CPU hours needed to
fin-ish (Fig. 9). Among the general tools, ngs_te_mapper,
TE-locate and PoPoolationTE2 were the fastest tools, with 8.6, 9.6 and 9.7 CPU hours needed to finish the prediction for the 432 families. RelocaTE2 took the
largest amount of time to finish the prediction (59.1 CPU hours) (Fig.9).
Discussion
The use of real data is essential for an accurate benchmarking of TE insertion detection tools
There are several tools available to detect TIPs from short-read resequencing data, and some efforts have been made to validate the performance of such tools [36,
41]. However, their benchmarking has been essentially
based on simulated TE insertions and simulated short reads. It is challenging to perfectly simulate sequencing errors, local coverage variations, biases due to GC con-tent or other genome specific biases that real short-read datasets contain. Similarly, the heterogeneity of real
transposon insertions, with polymorphic truncated or degenerated elements and elements inserted in highly repetitive regions, among other confounding effects, are also difficult to simulate. As a consequence, the bench-marking using simulated data may be overestimating the performance of the TIP prediction tools. Indeed, our re-sults show that, most of the tools here analyzed have a lower sensitivity than previously reported. For example, RelocaTE2 and TEMP were previously benchmarked on simulated rice data, and the sensitivity of both tools was
estimated to be higher than 99% at 10X [11]. On the
contrary, our results using a dataset of real insertions and real short-read data show that both programs per-form very different, with TEMP having a maximum
sen-sitivity of only 13.3% for MITE detection and
RelocateTE2 showing a 35.6% sensitivity. Similarly, we previously reported a sensitivity of close to 90% for Jit-terbug, a program developed in our laboratory, using real short reads on simulated TE insertions [21]. Our re-sults now show that for the dataset analyzed (real TIPs and real short reads) the maximal sensitivity is of 32.7% (Fig. 4, LTR-retrotransposons), although it does so with a relatively high precision. Therefore, our results suggest
that the sensitivity and precision previously reported for TIPs detection tools, determined using simulated data, are probably overestimated and that the real perform-ance of these tools is probably lower. We think that the performance levels of the different tools presented here are a much better estimation of their detection ability on real datasets. It is important to note, however, that de-pending on the genome to be analyzed, parameters used
Table 3Number of insertions detected by PoPoolationTE2, Jitterbug and Teflon using a validatedDrosophila melanogasterdataset
RAL-737 RAL-40 RAL-801 RAL-802 RAL-850 RAL-502 RAL-508 RAL-491 RAL-235 RAL-21 TOTAL %
Validated insertions 17 16 9 7 4 5 7 5 4 7 81
PoPoolationTE2 12 5 9 5 3 3 6 5 3 5 56 69,1
Jitterbug 11 2 3 5 2 2 4 2 3 2 36 44,4
Teflon 12 6 9 4 3 4 5 4 4 5 56 69,1
Combination 15 6 9 7 3 4 7 5 4 6 66 81,5
Total number of insertions detected by each tool on each line is provided in Additional file5: Table S4
and especially on the quality of the annotation of the ref-erence genome the performance of the programs may vary. All the programs benchmarked here are based on the detection of discordant paired-end reads and/or split-reads at the junction of TE insertions. Among the different confounding factors that can interfere with the detection process, the quality of the TE annotation of the reference genome and in particular of the proper definition of the TE-genome junctions, is an important one. Therefore, it is important to work on refining the annotation of the TEs (or at least the more interesting TE families for the purpose of the study) before search-ing for TIPs.
Tool performance varies depending on TE family
Eukaryote genomes contain a high diversity of TE ele-ments with very different copy numbers and functional and structural characteristics, which may impact on the ability of TIP detecting programs to reliably identify
their insertions. Because of that, we decided to bench-mark the different programs using two very different types of TEs that, in addition, are the most prevalent in plants: MITEs and LTR-retrotransposons. The results presented here show that, as expected, the analyzed tools do not detect different TE types with the same sensitivity and precision. MITEs and LTR-retrotransposons repre-sent extreme examples based on their length and com-plexity, and the performance of the tools when used with other TEs will probably be in the range of this case-study. The analysis of the sensitivity of the best per-forming tools in detecting TIPs produced by different
types of transposons (including LINEs,
LTR-retrotransposons and cut-and paste TIR transposons) in
Drosophila and humans suggests that this is indeed the case. Our results indicate that MITEs are detected with
better sensitivity and precision than
LTR-retrotransposons. The difference is especially relevant in the detection of non-reference insertions, where most
tools show low precision levels for
LTR-retrotransposons. In the present study, we ran all sam-ples in default mode or using the parameters described by the authors in the corresponding manuscripts or manuals (Additional file 1). Nevertheless, we show that precision can be increased by applying specific filters to the results. For example, we show that, for some pro-grams, LTR-retrotransposon detection can be drastically improved by applying a zygosity filtering. Applying such filtering may be a good strategy when not intending to study somatic insertions which should in most cases be
heterozygous. The difficulties of detecting
LTR-retrotransposons come from the complexity of the
Fig. 9Running time of each tool to perform the detection of MITEs in a 10X dataset. Family-specific tools are marked with an asterisk. All tools were run using 8 CPUs and 64GB of RAM
Table 4Number of insertions detected by Jitterbug, MELT and PoPoolationTE2 using a validated human dataset
Tool Homozygous Heterozygous Total
Validated insertions 46 102 148
PoPoolationTE2 44 (95,7%) 90 (88,2) 134 (90,5%)
Jitterbug 22 (47,8%) 52 (51,0%) 74 (50,0%)
Teflona – – –
MELT 45 (97,8%) 84 (82,4%) 129 (87,2%)
Combination 45 (97,8%) 94 (92,2%) 139 (93,9%)
a
elements and from the local regions where they insert. It is known that LTR-retrotransposons (especially those of the Gypsy superfamily) tend to integrate in heterochro-matic regions enriched in other TEs. These repetitive re-gions are likely a source of false positives that affects all the programs tested. These repetitive regions are, in fact, difficult to annotate and polymorphisms within these re-gions may be challenging to detect even using long-read data or when aligning good-quality assemblies. By con-trast, MITEs tend to integrate close to genes [25] and their flanking regions are more likely to be unique in the genome. The presence of non-repetitive TE flanks greatly simplifies the detection of TIPs, as the probability of finding multimapping reads in these regions is minimal.
Another important consideration related to the differ-ent TE families is the quality of the annotation. MITEs are easy to annotate and usually have well defined boundaries. By contrast, LTR-retrotransposons form nested insertions and are often degenerated. This makes very difficult to accurately define their boundaries, and as a consequence many chimeric elements are usually annotated. As already mentioned, an accurate TE anno-tation is essential to increase the capacity of the tools to identify TE insertions based on short-read data. In this context, it could be a good strategy to identify and re-move chimeric transposons from the annotation prior to using any of these tools (ie, when working with consen-suses or with the actual annotation). A chimeric or nested transposon, for example an LTR-retrotransposon with a MITE inserted inside, will be targeted by reads arising from the two elements, and other MITE inser-tions of the same family present elsewhere in the
gen-ome could be wrongly identified as
LTR-retrotransposons insertions by the TIP detection tools.
Influence of the type of genome on the performance of the tools
The ability of any of the tools to detect TIPs depend on the nature of the transposon insertion itself and its flanking genome sequence, and none of them can detect new transposon insertions in repetitive regions. There-fore, in addition to the type of transposon generating the TIP, as already discussed, the performance of the tools may depend on the genome under study. For this reason, we have analyzed the sensitivity of the tools that
per-formed the best using rice data on Drosophila and
hu-man data and compared their perforhu-mance on the different datasets. The sensitivity of the different
pro-grams analyzed in Drosophila was very similar to the
one obtained in rice. As the genomes of rice and
Dros-ophila are relatively different, the former being much bigger (430 Mb vs 175 Mb) and with a higher content of repetitive sequences (37% vs 20%), this suggests that the
performance of the tools is relatively independent of the genome used, and that the benchmarking here presented could be of use for TIP analysis in many different systems.
This analysis also showed that the tools that per-formed best on rice had an even better sensitivity on hu-man data. The difference of sensitivity was particularly clear for PoPoolationTE2 and MELT. Although this could indicate a difference of the performance of these tools in the two genomes, it could also be due to the particular nature of the human dataset. Indeed, the data-set of validated TIPs in humans contains insertions from TE families (LINE-1, ALU, SVA) that were detected in the first place using only one method, based on
split-read and split-read-pair information [44] and therefore the
sensitivity of the programs on this dataset could be over-estimated. It is worth mentioning that the PCR-validated Drosophila and human insertions have been predicted using a small number of tools in the original publica-tions, and therefore it includes only a subset of all the insertions present in these genomes. Moreover, the hu-man and Drosophila datasets were validated by PCR, which could have introduced a bias in the TEs that were included in these datasets. However, note that the num-ber of families included in the human and Drosophila validation datasets are similar or bigger than the ones in-cluded in the rice dataset and contain both full-length and truncated TEs.
Sequencing coverage critically impacts TIP detection Independently of the different performance found be-tween TE families, we found that coverage has a major impact on tool performance for all the TE families tested. In general sensitivity increases with increasing coverage. Therefore, homogenization of sample coverage is essential when using TIPs prediction tools to quantita-tively compare the transposition rates between organ-isms or populations. Some tools like PopoolationTE2 have internal steps to carry out this task. Nevertheless, for qualitative studies coverage homogenization is dis-couraged as down-sampling high-coverage datasets leads to a smaller number of detected insertions. It is import-ant to note that the increase of sensitivity with increas-ing coverage comes, in most cases, with a decrease in precision. Therefore, depending on the goals of the study a different level of coverage may be suitable. From the data presented here it seems that a coverage below 20X is probably not suited for most analyses, as the probabil-ity of missing true insertions is very high.
Strategies to increase tool performance
quality of the results [36]. However, simply increasing the number of tools does not necessarily increase the quality of predictions, due to the accumulation of tool-specific false positives (ie, the combination of five tools yielded 95% of sensitivity but only 11.8% precision in non-ref LTR-retrotransposon detection, Fig. 7). This is due to the fact that whereas many true insertions are de-tected by several tools, most false positives are
tool-specific (Fig. 6). Combining a limited number of
well-performing tools may be the best approach. Indeed, our results show that with the dataset used, the combination of PoPoolationTE2 and Jitterbug to detect LTR-retrotransposon insertions, or PoPoolationTE2 and Tef-lon to detect MITEs yielded superior TIP annotations (better F1-score) than the tools alone. Also, the perform-ance of these tool combinations was better than that of the McClintock pipeline, especially regarding LTR-retrotransposons. In this sense, we recommend combin-ing tools based on their high precision and not only on their high sensitivity (ie, PoPoolationTE2 and Jitterbug). Nevertheless, there can be situations in which sensitivity has a priority over precision (ie, re-sequencing of a sin-gle individual, or interest only on a few families). In such cases, running more tools can be an alternative and manual curation should be considered.
Selecting the appropriate tools for detecting TE insertions in resequencing data
Depending on the objective of the analysis, a family-specific tool could be more interesting than a broad-spectrum tool. For example, when tracking the effect of certain treatment in a concrete set of elements. Another important consideration is that the amount of storage needed is smaller in comparison to broad-spectrum tools, due to the smaller size of the alignment files. For such cases, a tool such as Trackposon could be a good option due to its fast speed, moderate sensitivity and high precision. Nevertheless, as a drawback, Trackposon does not report the exact insertion point and, which could be a limitation for some studies. In those cases, MELT can be an interesting alternative, although it re-quires adjusting family-specific parameters to produce high-quality results. This might be indeed the cause why MELT did not perform well on the detection of rice MITEs. In general, it is possible that the tools analyzed here, which were not specifically designed for MITEs and LTR-retrotransposons, may work better for other types of TEs or with modifications in the parameters used. Based on our results, if the objective of the study is to analyze insertions of more than one family, and the storage space is not a major limitation, using some of the top broad-spectrum tools such as PoPoolationTE2 is probably a better option as those programs can also be
relatively fast and show high sensitivity and precision in-dependently of the species and TE type analyzed.
Conclusions
Besides the important efforts of tool developers, our re-sults suggest that the identification of TIPs is still chal-lenging. We propose here a number of approaches, such as combining tools, which can be followed depending on the purpose of the study and the TE families to be ana-lyzed, that can provide good results. However, it is im-portant to note that in the best scenario (combining optimal tools at best coverage, Fig.7) and having a good TE annotation of the reference genome, the sensitivity
could be around 70% with a precision of 80–90% for
non-reference insertions. These numbers may be enough for most studies, but it is important to keep in mind that some insertions will be missed, especially when estimat-ing insertion frequencies or when usestimat-ing TIPs for GWAS, for example. There are major limitations like the length of the reads that can be resolved with current technolo-gies (ie long-read sequencing) and will certainly improve in the following years. But there is still the need to de-velop new algorithms specifically designed to identify TIPs from long reads, to generate highly curated TE an-notations of reference genomes and also more
independ-ent benchmarks on real data to evaluate the
performance of tools under different conditions.
Methods
Sequence data used
We used the available data for the japonica Nipponbare (GCA_000005425.2) and the indica MH63 (GCA_ 001623365.1) assemblies, and the short-read resequen-cing of MH63 (SRX1639978), which were used to gener-ate the original assembly.
MITE annotation
MITE-hunter [19] was run on Nipponbare and MH63
assemblies to detect MITEs families, which were then combined with the high-quality predictions available in PMITE database [9] (only families carrying TSD). Clus-tering at 90% was performed to remove redundancy using cd-hit [17] and produce a final library. RepeatMas-ker (http://www.repeatmasker.org/) was run to annotate all regions having significant homology with any of the MITE families. The annotations were further screened to discriminate full-length elements (consensus length ± 20%) from truncated hits.
LTR-retrotransposon annotation
LTR-retrotransposons were identified by running
LTRharvest [14] on IRGSP and MH63 assemblies with
default parameters. The internal conserved domains of
and only coding elements were retained for further ana-lyses. The identified elements were clustered with Silix [34] according to the 80–80 rule. All the elements in
each family were aligned with Mafft [26] and trimmed
with Trimal [6]. Consensus sequences were built from
the alignments using the EMBOSS package [40].
Determination of benchmarking standards
We took advantage of the availability of two high quality rice genome assemblies (IRGSP and MH63, the former used as reference) in order to obtain a curated dataset of real “reference” (orthologous) and “non-reference” (spe-cific to MH63) insertions as explained in Fig.2. Mapping of reference and non-reference windows to MH63
gen-ome was performed using BBmap (https://sourceforge.
net/projects/bbmap/). Intersections between annotations
were done with BEDtools [38].
Drosophilaand human benchmarking datasets
The Drosophila dataset consisted of 81 TIPs from ten
Drosophila lines sequenced at an average coverage of 42X [22], and validated by PCR by Lerat et al. [31], Mer-enciano et al. [33] and Ullastres et al. [46] (Additional file4: Table S3). In Lerat et al. [31], TIPs were predicted
using TIDAL [39] and PoPoolationTE2 [29] using 14
European D. melanogaster pooled populations (average
coverage of 90X). Briefly, validated TIPs were present in the DGRP population and at least in one European population at > 10% frequency, not present in the Y chromosome, and with a predicted length of < 6 kb to avoid problems with PCR amplification. In Ullastres
et al. [46], TIPs were predicted by TIDAL in the DGRP
population [39]. Validated TIPs were inserted in regions with recombination rates > 0, and present in at least 15
DGRP strains. Finally, in Merenciano et al. [33] TIPs
were also predicted by TIDAL in the DGRP population [39] and all belonged to theroo family. Both full-length and truncated copies were validated, as no TE length fil-ter was applied.
The human dataset consisted of 148 TIPs obtained from a human individual (NA12891, SRA accession
SRX207113) [44]. Original sequencing coverage of the
human genome was down sampled to 20X.
TIP prediction
Predictions of transposon insertions were done using the
12 tools shown in Table 2 using the default parameters
and / or following the recommendations of the authors. The scripts used for running each of the tools are shown in Additional file1.
Evaluation parameters
We used the following parameters for evaluating the ability of each tool to detect MITEs and
LTR-retrotransposons: True positives (TP): Insertions de-tected by any tool matching with our curated dataset of TPs. False positives (FP): Insertions detected by any tool matching with our curated dataset of FPs. False nega-tives (FN): Insertions present in our curated dataset of TPs, not detected by the evaluated tool. These primary parameters were used for calculating the final bench-marking ratios that have been previously used for asses-sing the performance of similar tools [41].
Sensitivity = TP/ (TP+ FN). Precision = TP/ (TP + FP)
F1-score = 2 x [(Precision x Sensitivity) / (Precision + Sensitivity)]
Supplementary information
Supplementary informationaccompanies this paper athttps://doi.org/10. 1186/s13100-019-0197-9.
Additional file 1.Scripts used to run all TIP detection tools. (.sh) (SH 13 kb)
Additional file 2 : Table S1.Insertion dataset used for benchmarking. Contains all the TP reference and non-reference windows, as well as all FP windows. (.xlsx)
Additional file 3 : Table S2.Numerical benchmark results. (.xlsx)
Additional file 4 : Table S3.Drosophila melanogasterTE insertions validated by PCR. TE names are provided in the table when authors gave names to the non-reference insertions. All insertions were validated based on PCR band sizes. Validated insertion sites are provided when au-thors sequenced PCR bands evidencing the presence of a particular inser-tion. ND: not determined. (xlsx)
Additional file 5 : Table S4.Total number of insertions detected by PoPoolationTE2, Jitterbug and Teflon in ten Drosophila lines. (xlsx)
Additional file 6 : Figure S1.Number of MH63 reference and non-reference insertions detected by direct comparison of 1000 LTR-retrotransposon flanking sites of different sizes from MH63 and Nippon-bare genomes. (.pdf)
Additional file 7 : Figure S2.Application of zygosity filtering to PoPoolationTE2. PoPoolationTE2-F means that it was run and filtered at zygosity 0.7. PopoolationTE2-R corresponds to the raw results. (.png)
Acknowledgements
Not applicable.
Authors’contributions
FB ran Jitterbug, MELT and produced the LTR-retrotransposon annotation. PV ran all TIP detection tools and analyzed the data. RC produced the MITE an-notation and the final dataset of TE insertions and analyzed the data to-gether with PV. MM and JG participated in the benchmarking using
Drosophilaand human datasets. JMC and RC conceived the study and wrote
the manuscript. All the authors reviewed the final manuscript. All authors read and approved the final manuscript.
Funding
Availability of data and materials
The datasets analyzed during the current study are available in the NCBI repository:
- Nipponbare Assembly: GCA_000005425.2 - MH63 assembly: GCA_001623365.1
- Short-read resequencing data of MH63: SRX1639978 - Human resequencing reads: SRX207113
-Drosophilaresequencing reads: PRJNA36679
Ethics approval and consent to participate
Not applicable.
Consent for publication
Not applicable.
Competing interests
The authors declare that they have no competing interests.
Author details
1Centre for Research in Agricultural Genomics CSIC-IRTA-UAB-UB, Campus
UAB, Edifici CRAG, Bellaterra, 08193 Barcelona, Spain.2Institute of
Evolutionary Biology (CSIC-Universitat Pompeu Fabra), Passeig Maritim Barceloneta 37-49, 08003 Barcelona, Spain.
Received: 28 June 2019 Accepted: 17 December 2019
References
1. Adrion JR, Song MJ, Schrider DR, Hahn MW, Schaack S. Genome-wide estimates of transposable element insertion and deletion rates in Drosophila melanogaster. Genome Biol Evol. 2017;9(5):1329–40. 2. Alkan C, Coe BP, Eichler EE. Genome structural variation discovery and
genotyping. Nat Rev Genet. 2011;12(5):363–76.
3. Bogaerts-Márquez M, Barrón MG, Fiston-Lavier A-S, et al. T-lex3: an accurate tool to genotype and estimate population frequencies of transposable elements using the latest short-read whole genome sequencing data. Bioinformatics. 2019, btz727.
4. Butelli E, Licciardello C, Zhang Y, et al. Retrotransposons control fruit-specific, cold-dependent accumulation of anthocyanins in blood oranges. Plant Cell. 2012;24(3):1242–55.
5. Cao Y, Chen G, Wu G, et al. Widespread roles of enhancer-like transposable elements in cell identity and long-range genomic interactions. Genome Res. 2019;29(1):40–52.
6. Capella-Gutiérrez S, Silla-Martínez JM, Gabaldón T. trimAl: a tool for automated alignment trimming in large-scale phylogenetic analyses. Bioinformatics. 2009;25(15):1972–3.
7. Carpentier M-C, Manfroi E, Wei F-J, et al. Retrotranspositional landscape of Asian rice revealed by 3000 genomes4. Nat Commun. 2019;10(1):2. 8. Carr M, Bensasson D, Bergman CM. Evolutionary genomics of transposable
elements in Saccharomyces cerevisiae. Plos One. 2012;7(11):e50978. 9. Chen J, Hu Q, Zhang Y, Lu C, Kuang H. P-MITE: a database for plant
miniature inverted-repeat transposable elements. Nucleic Acids Res. 2014; 42(Database issue):D1176–81.
10. Chen J, Lu L, Benjamin J, et al. Tracking the origin of two genetic components associated with transposable element bursts in domesticated rice. Nat Commun. 2019;10(1):641.
11. Chen J, Wrightsman TR, Wessler SR, Stajich JE. RelocaTE2: a high resolution transposable element insertion site mapping tool for population resequencing. PeerJ. 2017;5:e2942.
12. Chuong EB, Elde NC, Feschotte C. Regulatory activities of transposable elements: from conflicts to benefits.Nature Reviews. Genetics. 2017;18(2): 71–86.
13. Eddy SR. Accelerated profile HMM searches. PLoS Comput Biol. 2011;7(10): e1002195.
14. Ellinghaus D, Kurtz S, Willhoeft U. LTRharvest, an efficient and flexible software for de novo detection of LTR retrotransposons. BMC Bioinformatics. 2008;9:18.
15. Ewing AD. Transposable element detection from whole genome sequence data. Mob DNA. 2015;6:24.
16. Flutre T, Duprat E, Feuillet C, Quesneville H. Considering transposable element diversification in de novo annotation approaches. Plos One. 2011; 6(1):e16526.
17. Fu L, Niu B, Zhu Z, Wu S, Li W. CD-HIT: accelerated for clustering the next-generation sequencing data. Bioinformatics. 2012;28(23):3150–2. 18. Gardner EJ, Lam VK, Harris DN, et al. The Mobile element locator tool
(MELT): population-scale mobile element discovery and biology. Genome Res. 2017;27(11):1916–29.
19. Han Y, Wessler SR. MITE-hunter: a program for discovering miniature inverted-repeat transposable elements from genomic sequences. Nucleic Acids Res. 2010;38(22):e199.
20. Hénaff E, Vives C, Desvoyes B, et al. Extensive amplification of the E2F transcription factor binding sites by transposons during evolution of Brassica species. Plant J. 2014;77(6):852–62.
21. Hénaff E, Zapata L, Casacuberta JM, Ossowski S. Jitterbug: somatic and germline transposon insertion detection at single-nucleotide resolution. BMC Genomics. 2015;16:768.
22. Huang W, Massouras A, Inoue Y, et al. Natural variation in genome architecture among 205 Drosophila melanogaster genetic reference panel lines. Genome Res. 2014;24(7):1193–208.
23. International Rice Genome Sequencing Project. The map-based sequence of the rice genome. Nature. 2005;436(7052):793–800.
24. Jiang C, Chen C, Huang Z, Liu R, Verdier J. ITIS, a bioinformatics tool for accurate identification of transposon insertion sites using next-generation sequencing data. BMC Bioinformatics. 2015;16(1):72.
25. Jiang N, Wessler SR. Insertion preference of maize and rice miniature inverted repeat transposable elements as revealed by the analysis of nested elements. Plant Cell. 2001;13(11):2553–64.
26. Katoh K, Standley DM. MAFFT multiple sequence alignment software version 7: improvements in performance and usability. Mol Biol Evol. 2013; 30(4):772–80.
27. Keane TM, Wong K, Adams DJ. RetroSeq: transposable element discovery from next-generation sequencing data. Bioinformatics. 2013;29(3):389–90. 28. Kobayashi S, Goto-Yamamoto N, Hirochika H. Retrotransposon-induced
mutations in grape skin color. Science. 2004;304(5673):982.
29. Kofler R, Gómez-Sánchez D, Schlötterer C. PoPoolationTE2: comparative population genomics of transposable elements using Pool-Seq. Mol Biol Evol. 2016;33(10):2759–64.
30. Kofler R, Orozco-terWengel P, De Maio N, et al. PoPoolation: a toolbox for population genetic analysis of next generation sequencing data from pooled individuals. Plos One. 2011;6(1):e15925.
31. Lerat E, Goubert C, Guirao-Rico S, et al. Population-specific dynamics and selection patterns of transposable element insertions in European natural populations. Mol Ecol. 2019;28(6):1506–22.
32. Linheiro RS, Bergman CM. Whole genome resequencing reveals natural target site preferences of transposable elements in Drosophila melanogaster. Plos One. 2012;7(2):e30008.
33. Merenciano M, Iacometti C, González J. A unique cluster of roo insertions in the promoter region of a stress response gene in Drosophila melanogaster. Mob DNA. 2019;10:10.
34. Miele V, Penel S, Duret L. Ultra-fast sequence clustering from similarity networks with SiLiX. BMC Bioinformatics. 2011;12:116.
35. Naito K, Zhang F, Tsukiyama T, et al. Unexpected consequences of a sudden and massive transposon amplification on rice gene expression. Nature. 2009;461(7267):1130–4.
36. Nelson MG, Linheiro RS, Bergman CM. McClintock: an integrated pipeline for detecting transposable element insertions in whole-genome shotgun sequencing data. G3. 2017;7(8):2763–78.
37. Platzer A, Nizhynska V, Long Q. TE-locate: a tool to locate and group transposable element occurrences using paired-end next-generation sequencing data. Biology. 2012;1(2):395–410.
38. Quinlan AR, Hall IM. BEDTools: a flexible suite of utilities for comparing genomic features. Bioinformatics. 2010;26(6):841–2.
39. Rahman R, Chirn G, Kanodia A, et al. Unique transposon landscapes are pervasive across Drosophila melanogaster genomes. Nucleic Acids Res. 2015;43(22):10655–72.
40. Rice P, Longden I, Bleasby A. EMBOSS: the european molecular biology open software suite. Trends Genet. 2000;16(6):276–7.
42. Sanseverino W, Hénaff E, Vives C, et al. Transposon insertions, structural variations, and snps contribute to the evolution of the melon genome. Mol Biol Evol. 2015;32(10):2760–74.
43. Slotkin RK, Martienssen R. Transposable elements and the epigenetic regulation of the genome. Nat Rev Genet. 2007;8(4):272–85.
44. Stewart C, Kural D, Strömberg MP, et al. A comprehensive map of mobile element insertion polymorphisms in humans. PLoS Genet. 2011;7(8): e1002236.
45. Studer A, Zhao Q, Ross-Ibarra J, Doebley J. Identification of a functional transposon insertion in the maize domestication gene tb1. Nat Genet. 2011; 43(11):1160–3.
46. Ullastres A, Merenciano M, González J. Natural transposable element insertions drive expression changes in genes underlying Drosophila immune response. BioRxiv. 2019, 655225.
47. Zhang J, Chen L-L, Sun S, et al. Building two indica rice reference genomes with PacBio long-read and Illumina paired-end sequencing data. Sci Data. 2016;3:160076.
48. Zhuang J, Wang J, Theurkauf W, Weng Z. TEMP: a computational method for analyzing transposable element polymorphism in populations. Nucleic Acids Res. 2014;42(11):6826–38.
Publisher’s Note