CURRICULUM AND EDUCATION ARTICLE
Educators of Prospective Teachers Hesitate to Embrace
Evolution Due to Deficient Understanding
of Science/Evolution and High Religiosity
Guillermo Paz-y-Miño-C&Avelina Espinosa
Published online: 6 March 2012
#Springer Science+Business Media, LLC 2012
Abstract Acceptance of evolution by educators of prospec-tive teachers remains superficially studied despite their role in having mentored schoolteachers whose weak support of evolution is known. Here, we contrast the views of New England educators of prospective teachers (n062; 87% Ph. D./doctorate holders in 32 specializations) with those of the general faculty (n0244; 93% Ph.D./doctorate holders in 40 disciplines), both members of 35 colleges and universities, and with college students (n0827; subsample of the 35 institutions) who were polled on: (1) the controversy evolu-tion vs. creaevolu-tionism vs. intelligent design (ID), (2) their understanding of how science/evolution works, and (3) their religiosity. The educators held intermediate positions in respect to the general faculty and the students: 94% of the general faculty, 75% of the educators, and 63% of the students said they accepted evolution openly; and 82% of the general faculty, 71% of the educators, and 58% of the students thought that evolution is definitely true. Only 3% of the general faculty in comparison to 19% of the educators and 24% of the students thought that evolution and crea-tionism are in harmony. Although 93% of the general fac-ulty, educators, and students knew that evolution relies on common ancestry, 26% of the general faculty, 45% of the
educators, and 35% of the students did not know that humans are apes. Remarkably, 15% of the general faculty, 32% of the educators, and 35% of the students believed, incorrectly, that the origin of the human mind cannot be explained by evolution; and 30% of the general faculty, 59% of the educators, and 75% of the students were Lamarckian (0believed in inheritance of acquired traits). For science education: 96% of the general faculty, 86% of the educators, and 71% of the students supported the exclusive teaching of evolution, while 4% of the general faculty, 14% of the educators, and 29% of the students favored equal time to evolution, creationism and ID; note that 92% of the general faculty, 82% of the educators, and 50% of the students perceived ID as either not scientific and proposed to counter evolution based on false claims or as religious doctrine consistent with creationism. The general faculty was the most knowledgeable about science/evolution and the least religious (science index, SI02.49; evolution index, EI0 2.49; and religiosity index, RI00.49); the educators reached lower science/evolution but higher religiosity indexes than the general faculty (SI01.96, EI01.96, and RI00.83); and the students were the least knowledgeable about science/ evolution and the most religious (SI01.80, EI01.60, and RI00.89). Understanding of science and evolution were inversely correlated with level of religiosity, and under-standing of evolution increased with increasing science literacy. Interestingly, ≈36% of the general faculty, edu-cators and students considered religion to be very impor-tant in their lives, and 17% of the general faculty, 34% of the educators, and 28% of the students said they prayed daily. Assessing the perception of evolution by educators of prospective teachers vs. the general faculty and the students of New England, one of the historically most progressive regions in the U.S., is crucial for de-termining the magnitude of the impact of creationism and Electronic supplementary material The online version of this article
(doi:10.1007/s12052-011-0383-9) contains supplementary material, which is available to authorized users.
G. Paz-y-Miño-C
Department of Biology, University of Massachusetts Dartmouth, 285 Old Westport Road,
North Dartmouth, MA 02747-2300, USA
A. Espinosa (*)
Department of Biology, Roger Williams University, One Old Ferry Road,
ID on attitudes toward science, reason, and education in science.
Keywords Antievolution wars . College education . Controversy science versus popular belief . Evolution literacy . Evolution polls
Introduction
Creationism and intelligent design (ID) split the public’s support of evolution in the U.S. (Padian2009; Padian and Matzke 2009; Forrest 2010; Matzke 2010; Paz-y-Miño-C and Espinosa2011a), where only 40% of adults accept the concept of evolution (Miller et al. 2006; The Gallup Poll 2009). The U.S. ranks 33rd among 34 other industrialized countries where acceptance of evolution has been polled, in contrast to Iceland, Denmark, Sweden, France, Japan, and the UK, top in the list, where≈75–85% of the general public accepts evolution (Miller et al.2006). In the intellectually progressive Northeastern U.S., favorable views toward evo-lution are the highest nationwide, only 59% (The Pew Research Center for the People & the Press2005).
The concept of evolution provides naturalistic explana-tions about the origin of life, its diversification and bioge-ography, and the synergistic phenomena resulting from the interaction between life and the environment (Paz-y-Miño-C and Espinosa 2011b); mutations, gene flow, genetic drift, and natural selection shape life’s biological processes in Earth’s ecosystems (Mayr 2001). Since the publication of
The Origin of Speciesby Charles Darwin, in 1859, Darwinian
evolution has been scrutinized experimentally; today the theo-ry of evolution is widely accepted by the scientific community (Coyne 2009; Dawkins 2009; Paz-y-Miño-C and Espinosa 2011a, b). In contrast, creationism, theistic evolution, creation science, or young Earth creationism (Petto and Godfrey 2007; Matzke 2010; Phy-Olsen 2010) rely on supernatural causation to explain the origin of the uni-verse and life. These views are not recognized by scien-tists as evidence-based explanations of empirical reality (Padian 2009; Scott 2009; Paz-y-Miño-C and Espinosa 2009a,b,2011a,b), or of cosmic processes which, accord-ing to modern understandaccord-ing of “cosmic evolution,” do encompass the formation of the universe, the emergence of the simplest elements that transformed into more complex elements and molecules, including prebiotic compounds in our planet and that ultimately led to the evolution of molecular diversity and complexity of today’s living organisms and ecosystems (see Zaikowski et al.2008; Krauss2010; Paz-y-Miño-C and Espinosa2011b).
The doctrine of ID, born in the 1980s, proposes that a designer is responsible, ultimately, for the assemblage of complexity in biological systems; according to ID, evolution
cannot explain holistically the origin of the natural world, nor the emergence of intricate molecular pathways essential to life, nor the immense phylogenetic differentiation of life; instead, ID proposes an intelligent agent as the ultimate cause of nature (Pennock 2001; Young and Edis 2004; Forrest and Gross 2007a,b; Miller 2007,2008; Petto and Godfrey2007; Phy-Olsen2010). In conceptually mistaken, type-I-error-based arguments to discredit evolution, ID has attributed randomness to molecular change, deleterious na-ture to single-gene mutations, insufficient geological time or population size for molecular improvements to occur, and invoked“design intervention”to account for complexity in molecular structures and biological processes (Paz-y-Miño-C and Espinosa2010; Paz-y-Miño-C et al.2011). In 2005, ID was exposed in court (Dover, Pennsylvania, Kitzmiller et al. versus Dover School District et al. 2005; Padian and Matzke 2009; Wexler 2010) for violating the rules of science by“invoking and permitting supernatural causation” in matters of evolution, and for “failing to gain acceptance in the scientific community.” Today, “design creationism” (as we refer to ID due to its designer/creator-based founda-tions; Pennock 2001; Paz-y-Miño-C and Espinosa 2010, 2011b; Paz-y-Miño-C et al. 2011) although defeated by science and in the courts, grows influential in the U.S., Europe, Australia and South America (Cornish-Bowden and Cárdenas 2007; Padian 2009; Branch et al. 2010; Forrest2010; Matzke2010; Wexler2010).
Acceptance of evolution among the general public, high school students and teachers, college students, university professors, and scientists has been documented (Bishop and Anderson1990; Downie and Barron 2000; Moore and Kraemer 2005; Miller et al. 2006; Donnelly and Boone 2007; Moore 2007; Berkman et al. 2008; Hokayem and BouJaoude 2008; Coalition of Scientific Societies 2008; The Gallup Poll 2008, 2009; Berkman and Plutzer 2011; Paz-y-Miño-C and Espinosa 2009a, b, 2011a), but the patterns of acceptance of evolution at the college level and its diverse subpopulations of students and faculty remain only partly known (but see Paz-y-Miño-C and Espinosa 2009a, b, 2011a). The latter applies particularly to the educators of future educators, that is college and university faculty specialized in training prospective teachers.
Moore2002; National Science Teachers Association 2005; National Science Foundation 2006; Berkman and Plutzer 2010,2011). And acceptance is sometimes even lower than among the general public (e.g., 30% general public versus 47% high school biology teachers think that God guided human evolution; Berkman et al.2008). Still, no connection has been proposed nor investigated between the views of these teachers about evolution and those of the scholars who trained them (i.e., educators of future educators). (2) Al-though attitudes toward evolution correlate positively with understanding of science/evolution and negatively with re-ligiosity (Bishop and Anderson1990; Downie and Barron 2000; Trani 2004; Paz-y-Miño-C and Espinosa 2011a), these parameters have not been quantified in subpopulations of educators of prospective teachers (Paz-y-Miño-C and Espinosa2011a). Note that a cultural assumption has been that highly educated faculty are consistently supportive of science and remain distant from belief-based perspectives about the natural world (but see Ecklund and Scheitle2007; Gross and Simmons2009). (3) Because in a recent study we reported surprisingly high (30%) religiosity among New Eng-land professors (Paz-y-Miño-C and Espinosa 2011a), we suspected differential religiosity between the educators of prospective teachers versus the general faculty and, there-fore, lower levels of acceptance of evolution by the educators in respect to the rest of the professors. This suspicion was also based on the predominantly theistic (i.e., God-guided) views about evolution held by current schoolteachers nation-wide (data above; Berkman and Plutzer2010,2011); and (4) because acceptance of evolution increases with level of education, from high school graduates (20%; Brumfiel 2005; The Gallup Poll2009) to university professors (94%; Paz-y-Miño-C and Espinosa2011a, this study), we consid-ered it relevant to quantify support to evolution by the Ph.D.-and doctorate-holder educators of prospective teachers in respect to the other populations (i.e., college students and professors outside the field of education).
Here we compare and contrast the views of a representa-tive sample of New England educators of prospecrepresenta-tive teach-ers (n062) with those of the general faculty (n0244) and college students (n0827) who were polled in three areas (similar to Paz-y-Miño-C and Espinosa 2011a): (1) the controversy over evolution versus creationism versus ID, (2) their understanding of how science and the evolutionary process work, and (3) their religiosity. The samples of both educators of prospective teachers and the general faculty came from 35 colleges and universities; the students’data came from four representative New England institutions: public secular (n0161), private secular (n0298), religious I (n0185), and religious II (n0183). Assessing the percep-tion of evolupercep-tion by educators of prospective teachers versus the general faculty and the students in one of the historically most progressive regions of the U.S. is crucial for determining
the magnitude of the impact of creationism and ID on attitudes toward science, reason, and education in science (Paz-y-Miño-C and Espinosa2011a). The New England states have among the highest evolution education standards in the U.S. (letter grade for coverage of evolution in state science standards: Connecticut D, MaineC, MassachusettsB, New HampshireA, Rhode IslandB, VermontB; Mead and Mates 2009), however only two out of three New Englanders accept evolution (above). By understanding opinions about evolution among subpopulations of higher education audiences, whose impact in the educational system and society is direct and/ or imminent (e.g., “highly trained”educators of prospective teachers and general faculty, and “in-the-process-of-acquiring-education”students/future graduates), we aim at improving the approach by which evolution and science are commu-nicated to the public at large, thus contributing to curricu-lar/pedagogical reform for their effective teaching in college and minimizing the negative effects of creationism and ID on the U.S. educational system (Paz-y-Miño-C and Espinosa2009a,b,2011a,b).
Methods
Because the statistical patterns of acceptance of evolution by educators of prospective teachers (the focus audience of this study) resulted in an intermediate position between the general faculty (highest scores) and the students (lowest scores), we describe and refer to these three subpopulations in the following order: first, the general faculty (Gen Fac); second, the educators of prospective teachers (Edu); and third, the students (Stu). We keep this approach in tables and figures to facilitate the presentation of the data, analysis, and discussion.
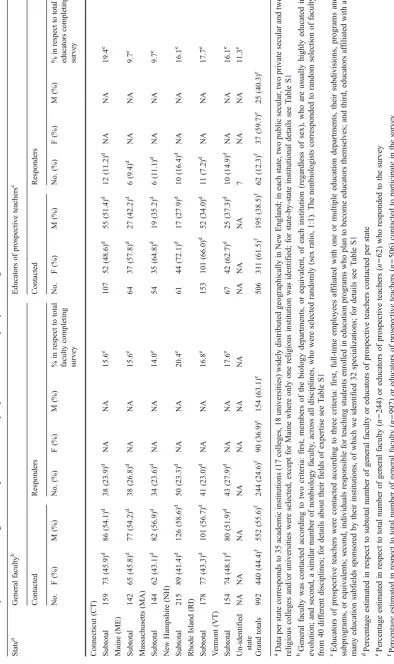
three criteria: first, full-time employees affiliated with one or multiple education departments, their subdivisions, programs and subprograms, or equivalents; second, individuals respon-sible for teaching students enrolled in education programs who, themselves, plan to become educators; and third, educa-tors affiliated with as many education subfields sponsored by their institutions, of which we identified 32 specializations (Tables1and2; for statistical details see Table S1). To compare the views of both the New England general faculty and the educators of prospective teachers with those of college students, we surveyed students from four representative New England institutions (email requests to all enrolled students; n017,621): public secular University of Massachusetts Dartmouth (UMassD Pub: 7,982 students contacted), private
secular Roger Williams University (RWU Priv: 3,806), religious I Providence College (PC Rel I: 3,910), and religious II Salve Regina University (SRU Rel II: 1,923) (Table2; for detailed profiles of students and their institutions, see Table S2). Because the student population from the public secular institution was particularly large (45.3% of all students), we included one private (Priv) and two religious institutions (Rel I and II) to improve the representation of both public versus private and secular versus religious student profiles in respect to the profiles of the Gen Fac and Edu, as follows: (1) Gen Fac and Edu contacted: 33.3% public versus 66.7% private; Stu contacted: 45.3% public versus 54.7% private; and (2) Gen Fac and Edu contacted: 66.7% secular versus 33.3% religious; Stu contacted: Table 2 Profile of the general faculty, educators of prospective teachers, and college students who participated in the study
General faculty Educators Students Grand Totals
No. (%) No. (%) No. (%) No. (%)
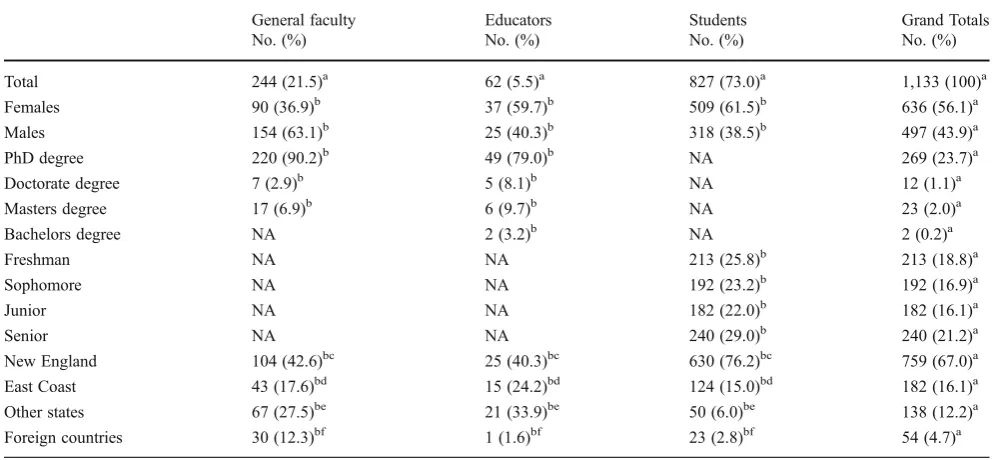
Total 244 (21.5)a 62 (5.5)a 827 (73.0)a 1,133 (100)a
Females 90 (36.9)b 37 (59.7)b 509 (61.5)b 636 (56.1)a
Males 154 (63.1)b 25 (40.3)b 318 (38.5)b 497 (43.9)a
PhD degree 220 (90.2)b 49 (79.0)b NA 269 (23.7)a
Doctorate degree 7 (2.9)b 5 (8.1)b NA 12 (1.1)a
Masters degree 17 (6.9)b 6 (9.7)b NA 23 (2.0)a
Bachelors degree NA 2 (3.2)b NA 2 (0.2)a
Freshman NA NA 213 (25.8)b 213 (18.8)a
Sophomore NA NA 192 (23.2)b 192 (16.9)a
Junior NA NA 182 (22.0)b 182 (16.1)a
Senior NA NA 240 (29.0)b 240 (21.2)a
New England 104 (42.6)bc 25 (40.3)bc 630 (76.2)bc 759 (67.0)a
East Coast 43 (17.6)bd 15 (24.2)bd 124 (15.0)bd 182 (16.1)a
Other states 67 (27.5)be 21 (33.9)be 50 (6.0)be 138 (12.2)a
Foreign countries 30 (12.3)bf 1 (1.6)bf 23 (2.8)bf 54 (4.7)a
a
Percentages in respect to grand total number of participants or“responders”to the survey (n01,133), which is a fraction of the number of general faculty (n0992) plus educators of prospective teachers (n0506) and students (n017,621; institutions: public07,982, private03,806, religious I0 3,910, religious II01,923) contacted via email and asked to take part in the study. For statistical details concerning profiles of those contacted, all responders, and their institutional affiliations and profiles see Tables S1and S2
b
Percentages in respect to total number of participants per group of general faculty (n0244), educators of prospective teachers (n062), and college students (n0827; institutions: public0161, private0298, religious I0185, religious II0183; see Table S2for statistical details concerning students and their institutions)
c
New England: general faculty natives corresponded to MA, 13.7%; CT, 6.8%; VT, 6.8%; ME, 5.9%; NH, 4.9%; and RI, 4.5%; educators of prospective teachers natives corresponded to MA, 16.2%; RI, 9.7%; NH, 4.8%; VT, 4.8%; CT, 3.2%; and ME, 1.6%; and student natives corresponded to MA, 43.6%; RI, 13.7%; CT, 12.3%; NH, 3.5%; VT, 1.6; and ME, 1.5%
d
East Coast: general faculty natives corresponded to NY, 9.6%; PA, 4.4%; NJ, 2.4%; MD and VA, 1.2%; educators of prospective teachers natives corresponded to NY, 12.9%; PA, 4.8%; MD, 3.3%; NJ, 1.6%; and VA, 1.6%; and students natives corresponded to NY, 7.3%; NJ, 3.8%; PA, 1.7%; MD, 1.2%; DE and VA, 1.0%
e
Other states: general faculty natives corresponded to CA, 7.3%; MI, 3.6%; CO and TX 2.5%; IL, 2.0%; OH, 1.6%; and 17 other states plus Puerto Rico, 10.5%; nativity of educators of prospective teachers corresponded to CA, 8.1%; FL, 3.2%; IL, 3.2%; WI, 3.2%; TX, 3.2%; MO, OK, OR plus Puerto Rico, 6.6%; and four unidentified states, 6.4%; and nativity of students corresponded to AZ, CA, CO, FL, GA, HI, IL, IN, KT, MI, MN, MO, NM, OH, OR, SC, TN, TX, WA, WI, plus Puerto Rico and four unidentified states, 6.0%
f
66.9% secular versus 33.1% religious (percentages generated from Tables S1and S2).
General faculty, educators of prospective teachers, and student profiles of those who responded to the survey were comparable in respect to residency and workplace location (New England states) but differed, as we expected, in re-spect to place of birth (general faculty usually belong to diverse cultural backgrounds: New England 42.6%, East Coast 17.6%, other states 27.5%, foreign countries 12.3%; educators of prospective teachers, as faculty themselves, also belonged to diverse cultural backgrounds: New England 40.3%, East Coast 24.2%, other states 33.9%, foreign countries 1.6%; and students mean Pub+Priv+Rel I+Rel II: New England 76.2%, East Coast 15.0%, other states 6.0%, foreign countries 2.8%; Table2). They also differed in respect to level of education (general faculty: Ph.D. holders, 90.2%; doctoral degree or equivalent, 2.9%; and masters degree, 6.9%; educators of prospective teachers: Ph.D. holders, 79.0%; doctoral degree or equivalent, 8.1%; masters degree, 9.7%; and bachelors degree, 3.2%; and students mean Pub+ Priv+Rel I+Rel II: freshman, 25.8%; sophomore, 23.2%; junior, 22.0%; and senior, 29.0%; Table2).
One thousand one hundred and thirty three general faculty (n0244, 21.5%), educators of prospective teachers (n062, 5.5%), and students (n0827, 73.0%) responded to a ten-question anonymous and voluntary online survey (pro-cedures similar to Paz-y-Miño-C and Espinosa 2009a, b, 2011a) to assess their views about evolution, creationism, and intelligent design (questions 1–7, below), as well as about their understanding of how the evolutionary process works (questions 8–9, below), and their religiosity (question 10, below). The level of understanding of science was assessed by asking three subquestions within the general online survey (as in Paz-y-Miño-C and Espinosa 2011a; for specifics seeIndexesbelow). All participants were free to withdraw from the survey at any time; no risks or discomfort were involved in the study. The Institutional Review Board of UMassD approved the general faculty (surveyed during the first week of April and third week of May 2010), the educators of prospective teachers (fourth week of March and first week of April 2011), the UMassD students’ study (second week of September 2009), the Human Subjects/Institutional Review Boards of RWU (third week of October 2009), PC (third week of April 2009), and SRU (fourth week of April 2011) approved the surveying of their own students. All participants answered questions 1–10 (but see exception in question 9, below) in order and were instructed to not skip or go back to previous questions to fix and/or compare answers. Questions 1–7 had five (a–e) choices per question; questions 8–9 and 10 were true/false and had five (a–e) or three (a–c) subcomponents (0each true/false), respectively. All choices per question, including the true/false options, were presented randomly, and only
one choice was possible per question–except for questions 8–10 that allowed responders to select true or false in each of the subcomponents (i.e., questions 8–9: true/false for a or b or c or d or e; question 10: true/false for a or b or c). For the purpose of reporting the data in this article and matching the description of each question with the figure legends (results, below), here we state the questions as follows (similar to Paz-y-Miño-C and Espinosa2009a,b,2011a):
Questions Addressing Views about Evolution, Creationism, and ID
Question 1: Evolution, creationism, and intelligent design in the science class. Which of the following explanations about the origin and development of life on Earth should be taught in science classes? a0evolution, b0equal time to evolution, creationism, intelligent design, c0creationism, d0intelligent design, e0do not know enough to say.
Question 2: Intelligent design (ID). Which of the follow-ing statements is consistent with ID? a0ID is not scientific but has been proposed to counter evolution based on false claims, b0ID is religious doctrine consistent with creation-ism, c0no opinion, d0ID is a scientific alternative to evo-lution and of equal scientific validity among scientists, e0ID is a scientific theory about the origin and evolution of life on Earth.
Question 3: Evolution and your reaction to it. Which of the following statements fits best your position concerning evolution? a0hearing about evolution makes me appreciate the factual explanation about the origin of life on Earth and its place in the universe, b0hearing about evolution makes no difference to me because evolution and creationism are in harmony, c0hearing about evolution makes me uncomfortable because it is in conflict with my faith, d0hearing about evolu-tion makes me realize how wrong scientists are concerning explanations about the origin of life on Earth and the universe, e0do not know enough to say.
Question 4: Your position about the teaching of human evolution. With which of the following statements do you agree? a0I prefer science courses where evolution is dis-cussed comprehensively and humans are part of it, b0I prefer science courses where plant and animal evolution is discussed but not human evolution, c0I prefer science courses where the topic evolution is never addressed, d0I avoid science courses with evolutionary content, e0do not know enough to say.
Question 5: Evolution in science exams. Which of the following statements fits best your position concerning science exams? a0general facultyandeducators of
prospec-tive teachers: instructors should have no problem giving
concerning evolution, c0general faculty and educators of
prospective teachers: students should prefer to not answer
questions concerning evolution, orstudents: I prefer to not answer questions concerning evolution, d0general faculty
andeducators of prospective teachers: students should never
answer questions concerning evolution, orstudents: I never answer questions concerning evolution, e0do not know enough to say.
Question 6: Your willingness to discuss evolution. Select the statement that describes you best: a0I accept evolution and express it openly regardless of other’s opinions, b0no opinion, c0I accept evolution but do not discuss it openly to avoid conflicts with friends and family, d0I believe in creationism and express it openly regardless of others’ opinions, e0I believe in creationism but do not discuss it openly to avoid conflicts with friends and family.
Question 7: Your overall opinion about evolution (question adapted from Miller et al.2006). Select the statement with which you agree most about“evolution is”: a0definitely true, b0probably true, c0definitely false, d0probably false, e0do not know enough to say.
Questions Addressing Views about the Evolutionary Process
Question 8: An acceptable definition of evolution. Indicate if each of the following definitions of evolution is either true or false: a0gradual process by which the universe changes, it includes the origin of life, its diversification and the synergistic phenomena resulting from the interaction be-tween life and the environment; b0directional process by which unicellular organisms, like bacteria, turn into multi-cellular organisms, like sponges, which later turn into fish, amphibians, reptiles, birds, mammals and ultimately humans, the pinnacle of evolution; c0gradual process by which monkeys, such as chimpanzees, turn into humans; d0random process by which life originates, changes, and ends accidentally in complex organisms such as humans; e0gradual process by which organisms acquire traits during their lifetimes, such as longer necks, larger brains, resistance to parasites, and then pass on these traits to their descendants. Question 9: Evidence about the evolutionary process. Indicate if each of the following statements about evolution is either true or false: a0all current living organisms are descendants of common ancestors, which have evolved for thousands, millions or billions of years; b0humans are apes, relatives of chimpanzees, bonobos, gorillas, and orangutans; c0the hominid (human lineage) fossil record is so poor that scientists cannot tell with confidence that modern humans evolved from ancestral forms; d0the origin of the human mind and consciousness cannot be explained by evolution, e0the universe, our solar system, and planet Earth are finely tuned to embrace human life.
Question Addressing Responders’Religiosity
Question 10: Your religiosity. Indicate if each of the following statements about religiosity is either true or false, select all that apply (question adapted from Pew Global Attitudes Project 2007): a0faith in God is necessary for morality, b0religion is very important in my life, c0I pray at least once a day.
Understanding of Science, Evolution, and Religiosity Indexes
The Pew Global Attitudes Project (2007) has used the three choices of Question 10 (above) to generate a religiosity index (RI), a powerful predictor of religious views worldwide (47 countries), which we applied to our New England general faculty, educators of prospective teachers, and student samples. RI ranges from 0 to 3 (least to most religious): +1 if responders believe that faith
in God is necessary for morality, +1 ifreligion is very
impor-tant in their lives, and +1 ifthey pray daily.
To account for the levels of understanding of science and the evolutionary process, we generated two descriptive in-dexes (science index (SI), evolution index (EI); similar to Paz-y-Miño-C and Espinosa 2011a), analogous to RI (above). Thus, we could compare levels of understanding of science (SI) and evolution (EI) with level of religiosity (RI). Note that scholars in the field of attitudes toward evolution have postulated (Bishop and Anderson 1990; Downie and Barron 2000; Trani 2004; Paz-y-Miño-C and Espinosa 2009a, b) and quantified (Paz-y-Miño-C and Espinosa 2011a) that these three factors are associated with an individ-ual’s acceptance of evolution. Our SI and EI range from 0 to 3 (lower to higher levels of understanding of science and evolution) and rely on three questions each, which were selected from a pool of five questions about science and ten about evolution (all part of the entire online surveys); the suitable questions for each index showed variability between the responses by the general faculty, the educators of pro-spective teachers, and the students, and were, therefore, in-formative for discriminating among the three groups: SI +1 if responders rejected the idea thatscientific theories are based
on opinions by scientists, +1 if they disagreed with the notion
thatscientific arguments are as valid and respectable as their
non-scientific counterparts, and +1 if they rejected the
state-ment thatcrime-scene and accident-scene investigators use a different type of scientific method to investigate a crime or an
accident; EI +1 if responders rejected the idea thatorganisms
acquire beneficial traits during their lifetimes and then pass
on these traits to their descendants, +1 if they disagreed with
the notion that during evolution monkeys such as
chimpan-zees can turn into humans, and +1 if they rejected the
statement thatthe origin of the human mind and
Statistical Analyses
For the five-choice questions (1–7), we compared the New England general faculty (Gen Fac) versus the educators of prospective teachers (Edu) versus the college students from four types of academic institutions (Stu: Pub + Priv + Rel I+Rel II) and analyzed separately the data generated in each of the questions (i.e., questions 1, 2, 3, 4, 5, 6, or 7; choices a–e). Data from each question were organized in 3×5 con-tingency tables, for example, Gen Fac, Edu, Stu×a–e (Chi-square tests, null hypotheses rejected atP≤0.05). Because questions 1, 3, 4, 5, 6, or 7 had none or very few responders (<5%; note that Chi-square analyses are inaccurate when over 20% of the expected values are less than 5; Siegel and Castellan 1988) in one, two, or three of the choices (e or de or cde), we eliminated such choices and created 3×2, 3×2, 3×2, 3×2, 3×3, and 3×2 contingency tables for the remaining groups in each question, respectively (Chi-square tests, null hypotheses rejected atP≤0.05). For the true/false questions 8–9 and 10, we organized the data corresponding to each subcomponent of the question (ques-tions 8–9: subcomponents a–e; question 10: subcomponents a–c) in separate 2×3 contingency tables per each of the five or three subcomponents per question, respectively. For example, questions 8–9, subcomponents a or b or c or d or e (each separately): true, false × Gen Fac, Edu, Stu, and question 10, subcomponents a or b or c (each separately): true, false×Gen Fac, Edu, Stu (Chi-square tests, null hy-potheses rejected atP≤0.05). Note that for question 9, we could only sample students from the religious II institution (SRU Rel II), thus we compared general faculty versus educators of prospective teachers versus the compiled data of students from three institutions: Pub+Priv +Rel II. Pair-wise comparisons between relevant groups in all questions were analyzed with sign test two-tail, null hypotheses rejected atP≤0.05. Although we instructed participants to not skip questions, they could do it freely (see Human Subjects/Institutional Review Boards’ policies, above); therefore, the total number of general faculty, educators of prospective teachers, or student responders per question varied, as reported in the figure captions (below): Gen Fac mean0230,r0216–244; Edu mean055,r048–62; and Stu mean0681, r0576–791 (note that 827 students responded as a whole to the 10 questions in the survey, but a maximum of 791 students completed the question with the most responses, i.e., question 2; see caption in Fig. 2 below). The SI, EI, and RI indexes (above) did range from 0 to 3 each; we generated them for the general faculty, the educa-tors of prospective teachers, and the students, and analyzed the raw data of each index separately as function of subpop-ulation (i.e., SI, Gen Fac versus Edu versus Stu; EI, Gen Fac versus Edu versus Stu; and RI, Gen Fac versus Edu versus Stu) with Kruskal–Wallis one-way analysis of variance
(ANOVA) on ranks (null hypotheses rejected at P≤0.05). Pair-wise comparisons between relevant groups in each index were analyzed with a two-tailed Dunn test (appro-priate for unequal group size comparisons in rank-based ANOVA; Siegel and Castellan 1988), null hypotheses rejected at P≤0.05. Linear regression was used to ana-lyze the association between the 0–3 levels of: SI (de-pendent variable) versus RI (inde(de-pendent variable), or EI (dependent variable) versus RI (independent variable), or EI (dependent variable) versus SI (independent variable) within each of the subpopulations (i.e., Gen Fac: SI versus RI, EI versus RI, and EI versus SI; Edu: SI versus RI, EI versus RI, and EI versus SI; and Stu: SI versus RI, EI versus RI, and EI versus SI). Because we hypoth-esized directionality in the inverse association between level of understanding of science/evolution (dependent var-iables) and level of religiosity (independent variable), as well as a positive association between level of understanding of evolution (dependent variable) and level of understanding of science (independent variable), we used one-tail tests to reject null hypothesis atP≤0.05.
Results
Survey Response Rates and Representativeness of the Samples
General Faculty Two hundred and forty four (24.6%) of the
992 general faculty contacted to participate in the study (F0 44.4%, M055.6%; 40 disciplines) completed the survey (Table1; see details in Table S1), a response rate compara-ble to analogous email/online studies (024%, The Pew Research Center for the People & the Press 2009). The average number of general faculty contacted per state was 165 (r0142–215) and the average percent of res-ponders per state was 25 (r023.0–27.9; Table 1). Of all responders (n0244), 36.9% were females and 63.1% were males (Table 1).
Educators of Prospective Teachers Sixty-two (12.3%) of the
of responders per state was 12 (r07.2–16.4; Table1). Of all responders (n062), 59.7% were females and 40.3% were males (Table1).
Students Eight hundred and twenty-seven (4.7%) of the
17,621 students contacted to participate in the study completed the survey (Table 2; see details in Table S2). Response rate by students varied among institutions: Pub 161 (2.0% of 7,982 contacted), Priv 298 (7.8% of 3,806 contacted), Rel I 185 (4.7% of 3,910 contacted), and Rel II 183 (9.5% of the 1,923 contacted; Tables2 and S2); these values were consistent with previous online sampling of these institutions where the demographic profile of partic-ipants in the surveys resembled closely the institutional profiles (Paz-y-Miño-C and Espinosa2009a,b,2011b). Of all responders (n0827), 61.5% were females and 38.5% were males (Tables2and S2).
Representativeness of the Samples and Statistical
Con-fidence We consider our samples statistically representative
of the New England general faculty, educators of prospective teachers, and students for the following reasons: (1) The demographic segmentation of responders (i.e., percent of res-ponders per state and type of institution as function of the segmentation of those contacted) was in accordance with the demographics of the entire populations participating in the study (Tables1,2, S1and S2). Note that the response rate per state as function of those completing the survey was statisti-cally similar between Gen Fac and Edu (Chi-square02.150, df05,P00.828; data extracted from Table1), as well as the Gen Fac and Edu demographic profiles for New England, East Coast, and other states in the U.S. (Chi-square01.116,df02, P00.572; data extracted from Table2), but not when foreign countries were included in the comparison (Chi-square0 8.648,df03,P00.034; data extracted from Table2). Due to the rareness of international faculty (1.6%) among the educa-tors of prospective teachers, the latter did not skew the pattern of responses. The students’ demographic profiles closely matched those of the entire student populations at their insti-tutions, as well as their New England (76.2%) and East Coast (15%) upbringing (Tables 2 and S2); their responses were, therefore, pooled in a single group of students (Table2) to homogenize their public-, private- secular or religious back-grounds, thus matching the students’profiles with those of the general faculty and the educators (note that independent anal-ysis of New England student views about evolution have been published; Paz-y-Miño-C and Espinosa2009a,b,2011a). (2) The responses were tightly clustered (low variance is associ-ated with satisfactory accuracy; see van Bennekom2002) in each sample of Gen Fac, Edu, and Stu that we used to generate the index SI (variance: Gen Fac00.495, Edu01.036, and Stu00.910), EI (variance: Gen Fac00.431, Edu00.729, and Stu00.682), and religiosity index RI (variance: Gen Fac0
0.703, Edu01.028, and Stu01.190), from which we drew broad conclusions about acceptance of evolution in the con-text of the responders’understanding of science/evolution and level of religiosity (see Figs.11,12, andDiscussion). (3) The margin of error per sample at 95% certainty and 50% response distribution was consistent with conventional polling of public opinions of variable sizes (see van Bennekom2002), as fol-lows: Gen Fac±5.5%, Edu±11.7%, and Stu±3.3% (sample size calculator Raosoft 2011); note that by mentally adding and/or subtracting the margin of error values to/from the percentile responses in each question (results Figs.1,2,3,4, 5,6,7,8,9and10, below) the differential response pattern between Gen Fac, Edu, and Stu persists. (4) The Gen Fac, Edu, and Stu held consistently high, middle, and low percen-tile levels of agreement/disagreement, respectively in each of the ten survey questions (except for a nonstatistical difference in question 5; see Fig.5); and (5) the response rates of the general faculty (24.6%), educators of prospective teachers (12.3%), and students (4.7%), in respect to the total popula-tions contacted, were analogous to comparable studies of public opinions in the U.S. (The Pew Research Center for the People & the Press2009) and consistent with our previous studies (Paz-y-Miño-C and Espinosa2009a,b,2011a); note observation about modern views on surveys validity based on response rates (above).
Views about Evolution, Creationism, and ID
Evolution, Creationism, and Intelligent Design in the
Sci-ence Class The general faculty, educators of prospective
Intelligent DesignThe general faculty and educators of pro-spective teachers had comparable opinions about ID, which differed from the students’variable perception of ID (Fig.2; Chi-square050.836,df08,P≤0.001): 46.7/45.5% of the gen-eral faculty and 41.9/40.3% of the educators of prospective teachers versus 22.9/27.4% of the students perceived ID as
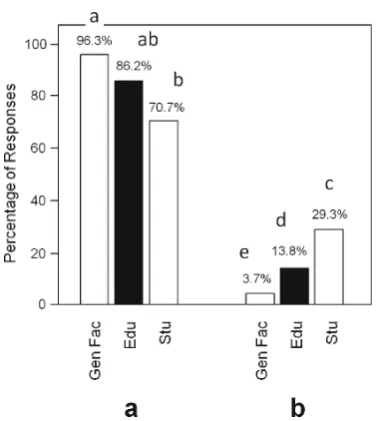
either not scientific and proposed to counter evolution based on false claims or as religious doctrine consistent with creation-ism, respectively. A small percent of the general faculty and educators of prospective teachers in comparison to a higher Fig. 1 Percentage of New England general faculty (Gen Fac,white
bars left), educators of prospective teachers (Edu,black bars center),
and college students (Stu,white bars right) who consider one of the following explanations about the origin and development of life on Earth should be taught in science classes:aevolution andbequal time to evolution, creationism, intelligent design. Comparisons among groups: Chi-square023.968,df02,P≤0.001;lowercase lettersindicate sign test two-tail pair-wise comparisons P≤0.05. Gen Fac, n0241;
Edu,n058; andStu,n0727
Fig. 2 Percentage of New England general faculty (Gen Fac, white
bars left), educators of prospective teachers (Edu,black bars center)
and college students (Stu,white bars right) who consider one of the following statements to be consistent with Intelligent Design (ID):aID is not scientific but has been proposed to counter evolution based on false claims;bID is religious doctrine consistent with creationism;cno
opinion; d ID is a scientific alternative to evolution and of equal scientific validity among scientists; andeID is a scientific theory about the origin and evolution of life on Earth. Comparisons among groups: Chi-square050.836, df08,P≤0.001;lowercase letters indicate sign test two-tail pair-wise comparisons P≤0.05. Gen Fac,n0244; Edu,
n062; andStu,n0791
Fig. 3 Percentage of New England general faculty (Gen Fac,white
bars left), educators of prospective teachers (Edu,black bars center),
and college students (Stu, white bars right) who think one of the following statements fits best their position concerning evolution:a
hearing about evolution makes me appreciate the factual explanation about the origin of life on Earth and its place in the universe; andb
percent of students had either no opinion about ID (2.5% general faculty, 6.5% educators of prospective teachers, 23.2% students), considered ID a scientific alternative to
evolution and of equal scientific validity among scientists (2.5% general faculty, 3.2% educators of prospective teachers, 9.0% students), or thought of ID as a scientific theory about the origin of life on Earth (2.8% general faculty, 8.1% educators of prospective teachers, 17.6% students; sign test two-tail pair-wise comparisonsP≤0.05; Fig.2).
Fig. 4 Percentage of New England general faculty (Gen Fac,white
bars left), educators of prospective teachers (Edu,black bars center),
and college students (Stu,white bars right) who agree with one of the following statements concerning their own education:aI prefer sci-ence courses where evolution is discussed comprehensively and humans are part of it; andbI prefer science courses where plant and animal evolution is discussed but not human evolution. Comparisons among groups: Chi-square03.931,df02,P00.14. Gen Fac, n0242;
Edu,n059; andStu,n0702
Fig. 5 Percentage of New England general faculty (Gen Fac,white
bars left), educators of prospective teachers (Edu,black bars center),
and college students (Stu,white bars right) who agree with one of the following statements concerning evolution in science exams:a Gen Fac and Edu: instructors should have no problem giving exams with questions concerning evolution, or Stu: I have no problem answering questions concerning evolution; andbscience exams should always include some questions concerning evolution. Comparisons among groups: chi-square01.34,df02,P00.512.Gen Fac,n0238;Edu,n0
58; andStu,n0711
Fig. 6 Percentage of New England general faculty (Gen Fac,white
bars left), educators of prospective teachers (Edu,black bars center),
and college students (Stu,white bars right) who believe one of the following statements describes them best: a I accept evolution and express it openly regardless of others’opinions;bno opinion; andcI accept evolution but do not discuss it openly to avoid conflicts with friends and family. Comparisons among groups: Chi-square028.022,
df04,P≤0.001;lowercase lettersindicate sign test two-tail pair-wise comparisonsP≤0.05.Gen Fac,n0216;Edu,n048; andStu,n0695
Fig. 7 Percentage of New England general faculty (Gen Fac,white
bars left), educators of prospective teachers (Edu,black bars center),
and college students (Stu,white bars right) who think evolution is:a
Fig. 8 Percentage of New England general faculty (Gen Fac), educators of prospective teachers (Edu), and college students (Stu) who consider the following definitions of evolution to be either true (black part of the bar) or false (white part of the bar):agradual process by which the universe changes, it includes the origin of life, its diversification and the synergistic phenomena resulting from the interaction between life and the environ-ment;bdirectional process by which unicellular organisms, like bacteria, turn into multi cellular organisms, like sponges, which later turn into fish, amphibians, reptiles, birds, mammals and ultimately humans, the pinna-cle of evolution;cgradual process by which monkeys, such as chimpan-zees, turn into humans;d random process by which life originates,
changes, and ends accidentally in complex organisms such as humans; andegradual process by which organisms acquire traits during their lifetimes, such as longer necks, larger brains, resistance to parasites, and then pass on these traits to their descendants. Comparisons within groups
(asterisksindicate significance):a Chi-square08.532,df02,P00.014;
b Chi-square036.748, df02,P≤0.001;cChi-square014.755, df02,
P≤0.001;dChi-square00.655,df02,P00.721;eChi-square040.081,
df02,P≤0.001.Lowercase letters indicate sign test two-tail pair-wise comparisons within groupsP≤0.05.Gen Fac,n0221;Edu,n053; and
Stu,n0733
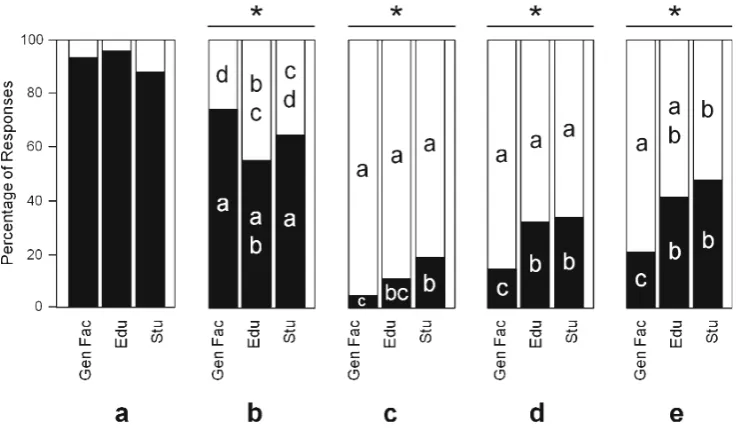
Fig. 9 Percentage of New England general faculty (Gen Fac), educa-tors of prospective teachers (Edu), and college students (Stu) who consider the following statements about evolution to be either true
(black part of the bar) or false (white part of the bar):aall current
living organisms are descendants of common ancestors, which have evolved for thousands, millions, or billions of years;b humans are apes, relatives of chimpanzees, bonobos, gorillas, and orangutans;cthe hominid (human lineage) fossil record is so poor that scientists cannot tell with confidence that modern humans evolved from ancestral forms;
dthe origin of the human mind and consciousness cannot be explained by evolution; and e the universe, our solar system and planet Earth are finely tuned to embrace human life. Comparisons within groups (asterisks indicate significance): a Chi-square05.101, df0
2, P00.078; b Chi-square07.907, df02, P00.019; cChi-square0 11.212, df02,P00.004; d Chi-square011.714, df02, P00.003; e
Chi-square016.392, df02, P≤0.001. Lowercase letters indicate sign test two-tail pair-wise comparisons within groups P≤0.05.
Evolution and Responders’ Reaction to it The general faculty, educators of prospective teachers, and students had distinctive positions about evolution (Fig. 3; Chi-square0 18.538, df02, P≤0.001): 96.6% of the general faculty, 81.4% of the educators of prospective teachers and 76.4% of the students thought that hearing about evolution made them appreciate the factual explanation about the origin of life on Earth and its place in the universe; educators of prospective teachers had intermediate percentile level of agreement with this position between the general faculty (high) and the students (low), but the three groups were statistically similar (sign test two-tail pair-wise comparison P≤0.05; Fig.3). Although only 3.4% of the general faculty considered that hearing about evolution makes no difference because evolution and creationism are in harmony, at least one in five educators of prospective teachers (18.6%) and one in four students (23.6%) hold this position (Fig.3). Note that concerning the “harmony” option, the views of the educators of prospective teachers were statistically similar to the students’ and these two groups differed from the general faculty (sign test two-tail pair-wise comparison P≤0.05; Fig.3).
Position about the Teaching of Human Evolution The
general faculty, educators of prospective teachers, and stu-dents agreed on their views about the teaching of human evolution (Fig.4; Chi-square03.931,df02,P00.14): 98.8% of the general faculty, 96.6% of the educators of prospective teachers, and 93.7% of the students preferred science
courses where evolution is discussed comprehensively and humans are part of it, and only 1.2% of the general faculty, 3.4% of the educators of prospective teachers, and 6.3% of the students preferred evolution discussions about plants and animals but not humans. In each case (i.e., science courses including or excluding human evolution) the gener-al faculty, educators of prospective teachers and student responses were statistically similar (sign test two-tail pair-wise comparisonsP≥0.05; Fig4).
Evolution in Science Exams The general faculty, educators
of prospective teachers, and students shared opinions about the inclusion of evolution in science exams (Fig. 5; Chi-square01.34,df02,P00.512): 79.4% of the general faculty, 72.4% of the educators of prospective teachers, and 75.6% of the students had no problem with either instructors in-cluding questions concerning evolution in exams or answer-ing questions concernanswer-ing evolution in exams, respectively, and 20.6% of the general faculty, 27.6% of the educators of prospective teachers, and 24.4% of the students considered that exams should always include some questions concerning evolution. In each case (i.e., optional or required inclusion of questions about evolution in exams) the general faculty, educators of prospective teachers and student responses were statistically similar (sign test two-tail pair-wise comparisonsP≥0.05, Fig.5).
Willingness to Discuss Evolution The general faculty,
edu-cators of prospective teachers, and students differed in their willingness to offer opinions about evolution (Fig. 6; Chi-square028.022,df04,P≤0.001): 94.4% of the general fac-ulty versus 75.0% of the educators of prospective teachers versus 63.4% of the students indicated acceptance of evolu-tion and of expressing it openly regardless of others’ opin-ions, 2.8% of the general faculty versus 12.5% of the educators of prospective teachers versus 20.0% of the stu-dents preferred not to comment on this issue, and 2.8% of the general faculty versus 12.5% of the educators of prospective teachers versus 16.6% of the students admitted accepting evolution but not discussing it openly to avoid conflicts with friends and family. Educators of prospective teachers had intermediate percentile levels of support for each of these three positions between the general faculty and the students and were statistically similar to the students in each choice. Edu-cators and general faculty were statistically similar in respect to the option“acceptance of evolution openly,”but differed in respect to the “no opinion” and “acceptance of evolution privately”options; note that the general faculty differed sta-tistically from the students in all cases (sign test two-tail pair-wise comparisonP≤0.05; Fig.6).
Overall Opinion about Evolution The general faculty,
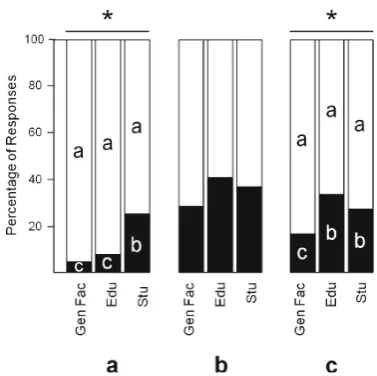
edu-cators of prospective teachers, and students differed in their Fig. 10 Percentage of New England general faculty (Gen Fac),
edu-cators of prospective teachers (Edu), and college students (Stu) who consider the following statements about religiosity to be either true
(black part of the bar) or false (white part of the bar):afaith in God is
necessary for morality;breligion is very important in my life; andcI pray at least once a day. Comparisons within groups (asterisksindicate significance): a Chi-square021.033, df02,P≤0.001; bChi-square0 3.733,df02,P00.155;cChi-square07.644,df02,P00.022.
Lower-case lettersindicate sign test two-tail pair-wise comparisons within
overall opinion about evolution (Fig.7; Chi-square013.835, df02,P≤0.001): 81.9% of the general faculty versus 71.4% of the educators of prospective teachers versus 58.4% of the students thought that evolution is definitely true, and 18.1% of the general faculty versus 28.6% of the educators of prospective teachers versus 41.6% of the students thought that evolution is probably true. Educators of prospective teachers had intermediate percentile level of support for each of these two positions between the general faculty and the students, but were statistically similar to both groups; only the general faculty differed statistically from the students (sign test two-tail pair-wise comparison P≤ 0.05; Fig.7).
Views about the Evolutionary Process
An Acceptable Definition of EvolutionThere was noticeable
variation in the views of the general faculty versus the educators of prospective teachers versus the students about alternative definitions of evolution (Fig. 8): 80% of the general faculty, 94.3% of the educators of prospective teachers, and 85.1% of the students considered definition a of evolution as true: gradual process by which the universe changes, it includes the origin of life, its diversification and the synergistic phenomena resulting from the interaction between life and the
environment; faculty and student responses were statistically
similar (within group comparisons Chi-square08.532, df02, P00.014); note that definition a was the most comprehensive included in the survey. Eleven percent of the general faculty versus 39.6% of the educators of prospective teachers versus 50.3% of the students considered definition b of evolution as true:directional process by which unicellular organisms,like
bacteria, turn into multicellular organisms, like sponges,
which later turn into fish,amphibians,reptiles,birds,
mam-mals and ultimately humans,the pinnacle of evolution(within
group comparisons chi-square036.748,df02, P≤0.001); the general faculty and the educators of prospective teachers correctly rejected this definition, but their responses were significantly different from each other (89% of the general faculty versus 60.4% considered it false, sign test two-tail pair-wise comparisonP≤0.05; Fig.8); despite the 39.6% true versus 60.4% false responses by the educators of prospective teachers, their views did not differ statistically from the stu-dents’, but the students true versus false responses were similar to chance (sign test two-tail pair-wise comparisonsP≥0.05; Fig.8); note that definition b implies purpose in evolution and goal toward “humanity.” Six percent of the general faculty versus 13.2% of the educators of prospective teachers versus 25.3% of the students considered definition c of evolution as true:gradual process by which monkeys,such as chimpanzees,
turn into humans (within group comparisons chi-square0
14.755,df02,P≤0.001); the three groups correctly rejected this definition (94% of the general faculty, 86.8% of the
educators of prospective teachers and 74.% of the students considered it false, sign test two-tail pair-wise comparison P≤0.05; Fig.8); note that definition c asserts that chimpanzees are“monkeys”and that humans evolved from them. Thirty percent of the general faculty, 34.0% of the educators of prospective teachers and 28.5% of the students considered definition d of evolution as true:random process by which life
originates,changes,and ends accidentally in complex
organ-isms such as humans; the three groups correctly rejected this
definition (70% of the general faculty, 66% of the educators of prospective teachers, and 71.5% of the students considered it false) and their responses were statistically similar (within group comparisons Chi-square00.655,df02,P00.721); note that definition d implies that evolution is random and acciden-tal. Thirty-one percent of the general faculty versus 58.5% of the educators of prospective teachers versus 74.8% of the students considered definition e of evolution as true:gradual process by which organisms acquire traits during their
life-times,such as longer necks,larger brains,resistance to
para-sites,and then pass on these traits to their descendants(within
group comparisons Chi-square040.081, df02, P≤0.001); 69% of the general faculty versus 41.5% of the educators of prospective teachers versus 25.2% of the students correctly rejected this Lamarckian definition; note that the general faculty, educators of prospective teachers and students true/ false responses were distinctive (Gen Fac 31/69% versus Edu 58.5/41.5% versus Stu 74.8/25.2%), however, the views of the general faculty differed statistically from both the opinions of the educators of prospective teachers and the students,’ the latter two groups were statistically similar (sign test two-tail pair-wise comparisonsP≤0.05; Fig.8).
Evidence about the Evolutionary Process The general
fac-ulty, educators of prospective teachers, and students varied in their understanding of how evolution works (Fig.9): 94% of the general faculty, 96.2% of the educators of prospective teachers, and 88.2% of the students correctly considered statement a as true: all current living organisms are
descendants of common ancestors,which have evolved for
thousands, millions or billions of years; responses by the
three groups were statistically similar (within group compar-isons Chi-square05.101, df02, P00.078). Seventy-four percent of the general faculty versus 54.7% of the educators of prospective teachers versus 65.4% of the students cor-rectly considered statement b as true: humans are apes,
relatives of chimpanzees, bonobos, gorillas, and
to chance (sign test two-tail pair-wise comparisonP≥0.05; Fig.9). Four percent of the general faculty versus 11.3% of the educators of prospective teachers versus 18.7% of the students considered statement c as true:the hominid(human
lineage) fossil record is so poor that scientists cannot tell
with confidence that modern humans evolved from ancestral
forms(within group comparison Chi-square011.212,df02,
P00.004); educators of prospective teachers’ responses were statistically similar to both the general faculty and the students; however, significantly less general faculty than students thought that this statement was true (sign test two-tail pair-wise comparisonsP≤0.05; Fig.9). Note that 96% of the general faculty, 88.7% of the educators of prospective teachers, and 81.3% of the students correctly rejected this statement and these responses were statistically similar (sign test two-tail pair-wise comparisonsP≥0.05; Fig.9). Fifteen percent of the general faculty versus 32.0% of the educators of prospective teachers versus 34.7% of the students con-sidered statement d as true:the origin of the human mind
and consciousness cannot be explained by evolution(within
group comparison Chi-square011.714,df02,P00.003); the general faculty responses were statistically different from both the educators of prospective teachers and the students (sign test two-tail pair-wise comparisons P≤0.05; Fig.9); note that 85% of the general faculty, 68% of the educators of prospective teachers, and 65.3% of the students correctly rejected this statement and their responses were statistically similar (sign test two-tail pair-wise comparisons P≥0.05; Fig. 9). Twenty-one percent of the general faculty versus 41.5% of the educators of prospective teachers versus 47.3% of the students considered statement e as true: the
universe,our solar system and planet Earth are finely tuned
to embrace human life (within group comparisons
Chi-square016.392, df02, P≤0.001); significantly less general faculty than both educators of prospective teachers and students thought that this statement was true (sign test two-tail pair-wise comparisons P≤0.05; Fig.9). Although 79% of the general faculty and 58.5% of the educators of prospective teachers correctly rejected this statement, and their responses were comparable to each other but different than chance (sign test two-tail pair-wise comparison P≤ 0.05; Fig.9), the students’true versus false responses were similar to chance (sign test two-tail pair-wise comparison P≥0.05; Fig.9).
Responders’Religiosity
Your Religiosity The general faculty, educators of prospective
teachers, and students varied in their religiosity (Fig.10): 5% of the general faculty, 7.5% of the educators of prospective teach-ers, and 25.1% of the students considered statement a as true:
faith in God is necessary for morality(within group
compar-isons Chi-square021.033,df02,P≤0.001); significantly less
general faculty and educators of prospective teachers than students thought that this statement was true (sign test two-tail pair-wise comparisonsP≤0.05; Fig.10). Note that 95% of the general faculty, 92.5% of the educators of prospective teachers, and 74.9% of the students considered this statement as false and their responses were statistically similar (sign test two-tail pair-wise comparisonsP≥0.05; Fig.10). Twenty-nine percent of the general faculty, 41.5% of the educators of prospective teachers, and 37.3% of the students considered statement b as true:religion is very important in my life(within group comparisons Chi-square03.733, df02, P00.155; Fig.10). Note that 71% of the general faculty, 59.5% of the educators of prospective teachers, and 62.7% of the students thought that this statement was false; true/false responses by the three groups were statistically similar (sign test two-tail pair-wise comparisonsP≥0.05; Fig.10). Seventeen percent of the general faculty, 34.0% of the educators of prospective teachers, and 27.6% of the students considered statement c as true:I pray at least once a day(within group comparisons Chi-square07.644,df02,P00.022; Fig.10). The general faculty responses were statistically different from both the educators of prospective teachers and the students (sign test two-tail pair-wise comparisons P≤0.05; Fig. 10). Note that 83% of the general faculty, 66% of the educators of prospective teachers, and 72.4% of the students rejected this statement and these responses were statistically similar (sign test two-tail pair-wise comparisonsP≥0.05; Fig.10).
Understanding of Science, Evolution, and Religiosity Indexes
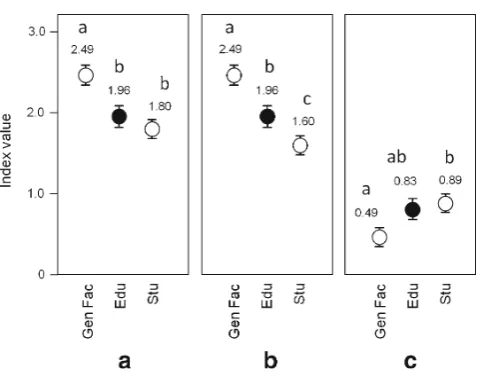
Understanding of Science Index The general faculty,
edu-cators of prospective teachers, and students differed in their levels of understanding science: the educators of prospective teachers had intermediate levels of understanding science (Edu SI01.96), between the general faculty (Gen Fac SI0 2.49) and the students (Stu SI01.80; Fig. 11; Kruskal– Wallis one-way ANOVA on ranks, H089.365, df02, P≤ 0.001). Note that the general faculty SI was statistically different from both the educators of prospective teachers SI and the students’SI (Dunn test, two-tail pair-wise com-parisons P≤0.05; Fig. 11) and that the latter two groups were statistically similar. The three groups responded dis-tinctively to each of the subcomponents of choice a, ques-tion 10 (above), as follows: first subcomponent (scientific
theories are based on opinions by scientists) the partial
scores were: Gen Fac00.891, Edu00.735, and Stu00.642; for the second subcomponent (scientific arguments are as
valid and respectable as their non-scientific counterparts),
the partial scores were: Gen Fac00.806, Edu00.641, and Stu00.635; and third subcomponent (crime-scene and accident-scene investigators use a different type of scientific
method to investigate a crime or an accident) the partial
Understanding of Evolution IndexThe general faculty, edu-cators of prospective teachers, and students differed distinc-tively in their levels of understanding evolution: the educators of prospective teachers had intermediate levels of understanding evolution (Edu EI01.96) between the gen-eral faculty (Gen Fac EI02.49) and the students (Stu EI0 1.60; Fig. 11; Kruskal–Wallis one-way ANOVA on ranks, H0171.683,df02,P≤0.001). Note that each of these three groups were statistically different (Dunn test, two-tail pair-wise comparisons P≤0.05; Fig. 11). The three groups responded distinctively to each of the subcomponents of choice b, question 10 (above), as follows: first subcomponent
(organisms acquire beneficial traits during their lifetimes and
then pass on these traits to their descendants) the partial
scores were: Gen Fac00.689, Edu00.415, and Stu00.230;
second subcomponent (during evolution monkeys such as
chimpanzees can turn into humans) the partial scores were:
Gen Fac00.950, Edu00.867, and Stu00.725; and third sub-component (the origin of the human mind and consciousness
cannot be explained by evolution) the partial scores were: Gen
Fac00.851, Edu00.679, and Stu00.642.
Religiosity Index The general faculty, educators of
prospec-tive teachers, and students differed in their levels of religi-osity: the educators of prospective teachers had intermediate levels of religiosity (Edu RI00.83) between the general faculty (Gen Fac RI00.49) and the students (Stu RI00.89; Fig. 11; Kruskal–Wallis one-way ANOVA on ranks, H0 21.734, df02, P≤0.001), but only the general faculty RI differed statistically from the students’RI (Dunn test two-tail pair-wise comparisons P≤0.05; Fig. 11). The three groups responded distinctively to each of the subcompo-nents of choice c in question 10 (above), as follows: first subcomponent (faith in God is necessary for morality), the partial scores were: Gen Fac00.045, Edu00.075, and Stu0 0.246; second subcomponent (religion is very important in my life) the partial scores were: Gen Fac00.283, Edu00.415, and Stu00.372; and third subcomponent (I pray at least once a day) the partial scores were: Gen Fac00.166, Edu00.339, and Stu00.267.
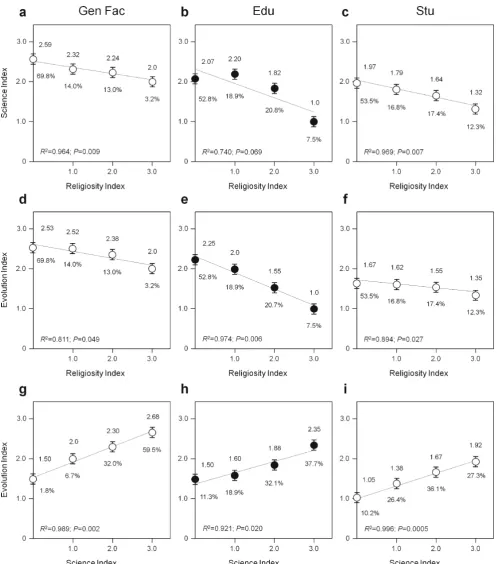
Associations between Indexes The three groups showed
directionality in the association between indexes (Fig. 12). Levels of understanding of science and evolution by the general faculty, educators of prospective teachers, and stu-dents decreased with increasing religiosity (i.e., a negative association of variables). In contrast, levels of understanding of evolution increased with increasing understanding of science (i.e., a positive association of variables). The scale at which the SI and EI indexes decreased as a function of increasing RI was in accordance with the high levels of understanding of science/evolution–and low religiosity–by the general faculty in respect to the intermediate and low levels of understanding of science/evolution–and high religiosity–by the educators of prospective teachers and the students, respectively (first and second rows, Fig. 12). Analogously, the scale at which the EI index increased as a function of SI was in accordance with the high understand-ing of science/evolution by the general faculty and the intermediate and low levels of understanding of science by the educators of prospective teachers and the students, respectively (third row, Fig.12). Note the following pattern in Fig.12: in the context of SI versus RI comparisons, the highest to lowest levels of understanding of science by the general faculty (Gen Fac SI02.59–2.0; 69.8–3.2% of res-ponders; indexR200.964,P00.009; Fig.12a), educators of prospective teachers (Edu SI02.07–1.0; 52.8–7.5% of res-ponders; indexR200.740,P00.069; Fig.12b), and students Fig. 11 Understanding of science, evolution, and religiosity indexes of
New England general faculty (Gen Fac,white circles,left), educators of prospective teachers (Edu, black circles, center), and college students (Stu, white circles, right). Each index ranges from 0 to 3 (lower to higher levels of understanding of science and evolution, or least to most religious position) as follows:afor the
understanding-of-science index, responders received +1 if they rejected the idea that
scientific theories are based on opinions by scientists, +1 if they
disagreed with the notion thatscientific arguments are as valid and
respectable as their nonscientific counterparts, and +1 if they rejected
the statement thatcrime-scene and accident-scene investigators use a
different type of scientific method to investigate a crime or an accident;
Kruskal–Wallis one-way ANOVA on ranks, H089.365, df02, P≤
0.001.bTheevolution index, responders received +1 if they rejected the idea thatorganisms acquire beneficial traits during their lifetimes
and then pass on these traits to their descendants, +1 if they disagreed
with the notion thatduring evolution monkeys such as chimpanzees
can turn into humans, and +1 if they rejected the statement thatthe
origin of the human mind and consciousness cannot be explained by
evolution; Kruskal-Wallis one-way ANOVA on ranks,H0171.683,
df02,P≤0.001.cThereligiosity index, responders received +1 if they agreed with the idea thatfaith in God is necessary for morality, +1 if they accepted the statement that religion is very important in their
lives, and +1 if they said they pray daily; Kruskal–Wallis one-way
ANOVA on ranks,H021.734,df02,P≤0.001.Lowercase letters in-dicate Dunn-test two-tail pair-wise comparisons within groupsP≤0.05.
Gen Fac,n0222;Edu,n053; andStu,n0576.Error barsare standard
Fig. 12 Association between understanding of science, evolution, and religiosity indexes of New England general faculty (Gen Fac, white
circles,left), educators of prospective teachers (Edu,black circles,center)
and college students (Stu, white circles, right). The linear regressions depict the association between the 0-to-3 levels of: first row,science index
versusreligiosity index; second row,evolution indexversusreligiosity
index; and third row,evolution indexversusscience indexfor each of the
subpopulations of responders (i.e.,Gen Fac:a,d,g;Edu:b,e,h; andStu:
c,f,i); the inverse association between level of understanding of science/
evolution and level of religiosity (first and second rows), as well as the direct association between level of understanding of evolution and level of understanding of science (third row) are evident. Numbers above and below regression lines correspond to index values and percent of respond-ers per data point, respectively. Linear regressions one tail:a,R200.964,
P00.009;b,R200.740,P00.069;c,R200.969,P00.007;d,R200.811,
P00.049;e,R200.974,P00.006;f,R200.894,P00.027;g,R200.989,
P00.002;h,R200.921,P00.020; andi,R200.996,P00.0005. Gen Fac,
(Stu SI01.97–1.32; 53.5–12.3% of responders; indexR20 0.969, P00.007; Fig. 12c) corresponded to the lowest to highest levels of religiosity (RI00.0–3.0) in each group, respectively. In the context of EI versus RI, the highest to lowest levels of understanding of evolution by the general faculty (Gen Fac EI02.53–2.0; 69.8–3.2% of responders; indexR200.811,P00.049; Fig.12d), educators of prospec-tive teachers (Edu EI02.25–1.0; 52.8–7.5% of responders; indexR200.974,P00.006; Fig.12e), and students (Stu EI0 1.67–1.35; 53.5–12.3% of responders; indexR200.894,P0 0.027; Fig.12f) corresponded to the lowest to highest levels of religiosity (RI00.0–3.0) in each group, respectively. And, in the context of EI versus SI, the lowest to highest levels of understanding of evolution by the general faculty (Gen Fac EI01.50–2.68; 1.8–59.5% of responders; index R200.989, P00.002; Fig.12g), educators of prospective teachers (Edu EI01.50–2.35; 11.3–37.7% of responders; indexR200.921, P00.020; Fig.12h), and students (Stu EI01.05–1.92; 10.2– 27.3% of responders; indexR200.996,P00.0005; Fig.12i) corresponded to the lowest to highest levels of understanding of science (SI00.0 to 3.0) in each group, respectively.
Discussion
To facilitate the discussion of the data, below we round up the values and discuss them in the context of generalizations and broad patterns:
Views about Evolution, Creationism, and ID
The educators of prospective teachers consistently held intermediate positions about evolution, creationism and intelligent design in respect to the general faculty and the students, as follows: 96% of the general faculty versus 86% of the educators of prospective teachers versus 71% of the students supported the exclusive teaching of evolution in science classes, and only 4% of the general faculty versus 14% of the educators of prospective teachers versus 29% of the students favored equal time to evolution, creationism and intelligent design (Fig.1); 92% of the general faculty versus 82% of the educators of prospective teachers versus 50% of the students perceived ID as either not scientific and proposed to counter evolution based on false claims or as religious doctrine consistent with creationism (combined values choices a+b, Fig.2). Only 8% of the general faculty versus 18% of the educators of prospective teachers versus 40% of the students had either no opinion about ID, consid-ered it a scientific alternative to evolution and of equal scientific validity among scientists, or thought of ID as a scientific theory about the origin of life on Earth (combined values choices c+d+e, Fig.2). Although the general faculty and the educators of prospective teachers had a clearer
understanding of ID than the students (Gen Fac and Edu were statistically similar; Fig.2), it is of concern that one in ten general faculty, one in five educators of prospective teachers, and one in two students were unaware of the nature of ID or considered it a legitimate scientific proposal.
Most of the general faculty (97%) and many of the educators of prospective teachers (81%) and the students (76%) preferred factual explanations about the origin of life on Earth and its place in the universe (choice a, Fig. 3). Although only one in 30 general faculty thought that evo-lution and creationism are in harmony, one in five educators of prospective teachers, and one in four students favored this position (choice b, Fig.3). Interestingly, 96% of the general faculty, educators of prospective teachers, and students pre-ferred science courses where evolution is discussed compre-hensively and humans are part of it (mean combined values choice a, Fig.4), and 76% of all responders had no problem with either instructors including questions concerning evo-lution in exams or answering questions concerning evolu-tion (mean combined values choice a, Fig.5). In fact, one in every four responders considered that science exams should always include some questions concerning evolution (choice b, Fig.5).
Most of the general faculty (94%) and many of the educators of prospective teachers (75%) indicated they ac-cept evolution and express it openly regardless of others’ opinions; only 63% of the students agreed with this position. Although only one in about 20 general faculty either did not comment on this issue or said they accept evolution private-ly (choices b, c, Fig.6), one in four educators of prospective teachers and one in three students held these positions. Indeed, educators of prospective teachers hesitated to em-brace evolution. Note that only 71% of them thought that evolution is definitely true and 29% considered it to be probably true (Fig. 7), placing between the general faculty (definitely true 82%; probably true 18%) and the students (definitely true 58%; probably true 42%; Fig.7).
Views about the Evolutionary Process
The educators of prospective teachers held an intermediate level of understanding of the evolutionary process in respect to the general faculty and the students. In some cases, their opinions were statistically similar to the students’and dif-fered from those of the general faculty, as follows: 86% (mean value) of the general faculty, educators of prospective teachers, and students agreed with a comprehensive defini-tion of evoludefini-tion as agradual process by which the universe
changes, [which]includes the origin of life,its
diversifica-tion and the synergistic phenomena resulting from the
inter-action between life and the environment. And 69% (mean
value) correctly rejected the definition that evolution is a