ORIGINAL ARTICLE
Clinical parameters predicting
pathologic complete response
following neoadjuvant chemoradiotherapy
for rectal cancer
Wei‑Gen Zeng
1, Jian‑Wei Liang
1, Zheng Wang
1, Xing‑Mao Zhang
1, Jun‑Jie Hu
1, Hui‑Rong Hou
2, Hai‑Tao Zhou
1and Zhi‑Xiang Zhou
1*Abstract
Introduction: Preoperative chemoradiotherapy (CRT), followed by total mesorectal excision, has become the standard of care for patients with clinical stages II and III rectal cancer. Patients with pathologic complete response (pCR) to preoperative CRT have been reported to have better outcomes than those without pCR. However, the factors that predict the response to neoadjuvant CRT have not been well defined. In this study, we aimed to investigate the impact of clinical parameters on the development of pCR after neoadjuvant chemoradiation for rectal cancer.
Methods: A total of 323 consecutive patients from a single institution who had clinical stage II or III rectal cancer and underwent a long‑course neoadjuvant CRT, followed by curative surgery, between 2005 and 2013 were included. Patients were divided into two groups according to their responses to neoadjuvant therapy: the pCR and non‑pCR groups. The clinical parameters were analyzed by univariate and multivariate analyses, with pCR as the dependent variable.
Results: Of the 323 patients, 75 (23.2%) achieved pCR. The two groups were comparable in terms of age, sex, body mass index, tumor stage, tumor location, tumor differentiation, radiation dose, and chemotherapy regimen. On multivariate analysis, a pretreatment carcinoembryonic antigen (CEA) level of ≤5 ng/mL [odds ratio (OR) = 2.170, 95% confidence interval (CI) = 1.195–3.939, P= 0.011] and an interval of >7 weeks between the completion of chemo‑ radiation and surgical resection (OR = 2.588, 95% CI = 1.484–4.512, P= 0.001) were significantly associated with an increased rate of pCR.
Conclusions: The pretreatment CEA level and neoadjuvant chemoradiotherapy‑surgery interval were independent clinical predictors for achieving pCR. These results may help clinicians predict the prognosis of patients and develop adaptive treatment strategies.
Keywords: Rectal cancer, Pathologic complete response, Neoadjuvant chemoradiotherapy, Carcinoembryonic antigen, Interval
© 2015 Zeng et al. This article is distributed under the terms of the Creative Commons Attribution 4.0 International License (http://creativecommons.org/licenses/by/4.0/), which permits unrestricted use, distribution, and reproduction in any medium, provided you give appropriate credit to the original author(s) and the source, provide a link to the Creative Commons license, and indicate if changes were made. The Creative Commons Public Domain Dedication waiver (http://creativecommons.org/ publicdomain/zero/1.0/) applies to the data made available in this article, unless otherwise stated.
Background
Preoperative chemoradiotherapy (CRT), followed by total mesorectal excision (TME), has become the standard
of care for patients with clinical stages II and III rectal cancer [1, 2]. Compared with surgical resection alone or postoperative CRT, preoperative CRT improves local control and increases the rate of sphincter preservation [3, 4]. However, the response to neoadjuvant CRT var-ies among different individuals. Most patients respond to neoadjuvant CRT, and approximately 10%–30% of patients achieve a pathologic complete response (pCR),
Open Access
*Correspondence: zhzhxpumc@163.com
1 Department of Colorectal Surgery, Cancer Hospital, Chinese Academy of Medical Sciences, Peking Union Medical College, 17 Panjiayuan Nanli, Chaoyang District, Beijing 100021, P.R. China
wherein they lack any viable tumor cells in the final sur-gical specimen [5]. By contrast, some patients show no response or are resistant to CRT. It has been well docu-mented that patients who achieved pCR had better long-term outcomes than those without pCR [5–8]. Moreover, a wait-and-see policy is safe and feasible for patients with clinical complete response to neoadjuvant CRT [9, 10].
As patients with pCR have a better prognosis, and the treatment strategy for these patients may be entirely different from that for the patients without pCR, the ability to predict the response to neoadjuvant CRT is of great clinical importance. Nevertheless, the factors that predict patient response to neoadjuvant CRT for rectal cancer have not been well defined. Sev-eral small retrospective studies have identified some clinical factors and molecular biomarkers that are predictors of tumor response to preoperative CRT, including the tumor size, carcinoembryonic antigen (CEA) level, epidermal growth factor receptor, and p21 [11–13]. These studies had small sample sizes of patients with pCR and investigated different response levels. Consequently, it remains a great challenge for clinicians to predict pCR after neoadjuvant CRT for rectal cancer.
In this study, we evaluated a large number of patients with pCR and aimed to indentify clinical factors or treat-ment variables associated with complete response to pre-operative CRT for rectal cancer.
Patients and methods Patient selection
This study was approved by the ethics committee at Cancer Hospital, Chinese Academy of Medical Sci-ences, and the protocol conformed to the ethical guide-lines of the 1975 Declaration of Helsinki. A total of 348 consecutive patients who underwent neoadjuvant CRT between January 2005 and December 2013 were iden-tified from our prospectively entered database. The criteria for neoadjuvant CRT were as follows: rectal adenocarcinoma confirmed by pathology, clinical stages II and III tumors, and tumors located within 10 cm of the anal verge. Twenty-five patients were excluded from the study for the following reasons: 2 patients refused surgery, 16 were treated with neoadjuvant radiotherapy without chemotherapy, and 7 underwent surgery at other hospitals.
Evaluation
All patients underwent colonoscopy with biopsy and were histologically diagnosed with adenocarcinoma. Preoperative clinical staging was determined by abdomi-nal and pelvic computed tomography (CT), transrectal
ultrasonography, pelvic magnetic resonance imaging, or a combination of these.
At least two pathologists, who are specialized in colo-rectal cancer, assessed the surgical specimens. pCR was defined as the absence of viable tumor cells in the surgi-cal specimen, including lymph nodes. Patients without pCR were grouped into the non-pCR cohort.
Treatment
As previously reported [14, 15], all patients planned to undergo a total irradiation dose of 50.0 Gy to the pel-vic area, delivered in 2.0-Gy fractions daily, five times per week for 5 weeks. One of the two chemotherapeutic regimens was delivered concurrently with radiotherapy as follows: oral capecitabine at a dose of 1,650 mg/m2 per day for 35 days, without weekend breaks, or oral capecitabine at a dose of 1,650 mg/m2 per day for 35 days plus intravenous oxaliplatin at a dose of 50 mg/m2 once weekly for 5 weeks. Surgical resection was planned for 6–8 weeks after the completion of preoperative CRT, irrespective of the response to CRT. TME was performed for each patient.
Data collection
The following data were reviewed in our database: sex, age, body mass index (BMI), clinical TNM classifica-tion, tumor differentiaclassifica-tion, tumor distance from the anal verge, radiation dose, pretreatment serum CEA level, chemotherapy regimen, and the interval between CRT and surgery.
Statistical analysis
Nonparametric variables are presented as the median and range, and categorical variables are presented as the frequency with percentages. Continuous variables were analyzed with the Mann–Whitney U test, and categori-cal variables were analyzed with the Chi square test or Fisher’s exact test, when appropriate. Univariate and multivariate analyses were performed by using logistic regression and Cox proportional hazard ratios to identify factors that predict pCR. All statistical tests were two-sided, and a P value of <0.05 was considered statistically significant. Data were analyzed by Statistical Package for the Social Science (SPSS) 18.0 for Windows (SPSS Inc., Chicago, IL, USA).
Results
Patient demographics
by TME were included in this study. The median age was 57 years (range 26–86 years). Of the 323 patients, 174 (53.9%) were males, and 149 (46.1%) were females; 78 (27.2%) had clinical stage II disease, and 235 (72.8%) had clinical stage III disease. The median distance of the tumor from the anal verge was 6 cm (range 0–10 cm). All patients received a long-course radiation, and the median radiation dose was 50 Gy (range 38–60 Gy). A total of 267 (82.7%) patients received oral capecitabine alone, concurrent with radiotherapy, and 56 (17.3%) patients received both capecitabine and oxaliplatin. The median interval between the completion of CRT and surgery was 50 days (range 25–105 days).
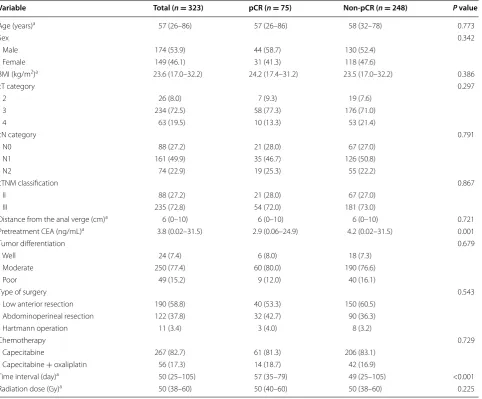
Of the 323 patients, 75 (23.2%) achieved a pCR, and 248 (76.8%) did not. The patients were divided into two groups, the pCR (n = 75) and non-pCR (n = 248) groups. The following clinical parameters were comparable between the pCR and non-pCR groups: age, sex, BMI, distance of the tumor from the anal verge, pretreatment clinical T or N category, and tumor differentiation. The chemotherapy regimens, radiation dose, and type of sur-gery were not significantly different between the pCR and non-pCR groups. The pretreatment serum CEA level was significantly lower in the pCR group than in the non-pCR group (2.9 vs. 4.2 ng/mL, P = 0.001). The median interval between the completion of CRT and surgery was
Table 1 Patient demographics and tumor characteristics
BMI body mass index, CEA carcinoembryonic antigen, pCR pathologic complete response, cTcategory clinical tumor category, cN category clinical node category, cTNM classification clinical tumor-node-metastasis classification.
a These values are presented as the median followed by the range in parentheses; other values are presents as numbers of patients followed by the percentage in
parentheses.
Variable Total (n = 323) pCR (n = 75) Non-pCR (n = 248) P value
Age (years)a 57 (26–86) 57 (26–86) 58 (32–78) 0.773
Sex 0.342
Male 174 (53.9) 44 (58.7) 130 (52.4)
Female 149 (46.1) 31 (41.3) 118 (47.6)
BMI (kg/m2)a 23.6 (17.0–32.2) 24.2 (17.4–31.2) 23.5 (17.0–32.2) 0.386
cT category 0.297
2 26 (8.0) 7 (9.3) 19 (7.6)
3 234 (72.5) 58 (77.3) 176 (71.0)
4 63 (19.5) 10 (13.3) 53 (21.4)
cN category 0.791
N0 88 (27.2) 21 (28.0) 67 (27.0)
N1 161 (49.9) 35 (46.7) 126 (50.8)
N2 74 (22.9) 19 (25.3) 55 (22.2)
cTNM classification 0.867
II 88 (27.2) 21 (28.0) 67 (27.0)
III 235 (72.8) 54 (72.0) 181 (73.0)
Distance from the anal verge (cm)a 6 (0–10) 6 (0–10) 6 (0–10) 0.721
Pretreatment CEA (ng/mL)a 3.8 (0.02–31.5) 2.9 (0.06–24.9) 4.2 (0.02–31.5) 0.001
Tumor differentiation 0.679
Well 24 (7.4) 6 (8.0) 18 (7.3)
Moderate 250 (77.4) 60 (80.0) 190 (76.6)
Poor 49 (15.2) 9 (12.0) 40 (16.1)
Type of surgery 0.543
Low anterior resection 190 (58.8) 40 (53.3) 150 (60.5) Abdominoperineal resection 122 (37.8) 32 (42.7) 90 (36.3)
Hartmann operation 11 (3.4) 3 (4.0) 8 (3.2)
Chemotherapy 0.729
Capecitabine 267 (82.7) 61 (81.3) 206 (83.1)
Capecitabine + oxaliplatin 56 (17.3) 14 (18.7) 42 (16.9)
Time interval (day)a 50 (25–105) 57 (35–79) 49 (25–105) <0.001
significantly longer in the pCR group than in the non-pCR group (57 vs. 49 days, P < 0.001).
Predictive factors of pCR
For the univariate and multivariate analyses, the variables were analyzed as discrete categorical variables. A median age of 57 was chosen as the cut-off value. We chose to investigate tumors located within 5 cm of the anal verge because that criterion could distinguish between middle and lower rectal cancer. An interval from the comple-tion of CRT to surgery of longer than 7 weeks was chosen because it was the median interval in our study.
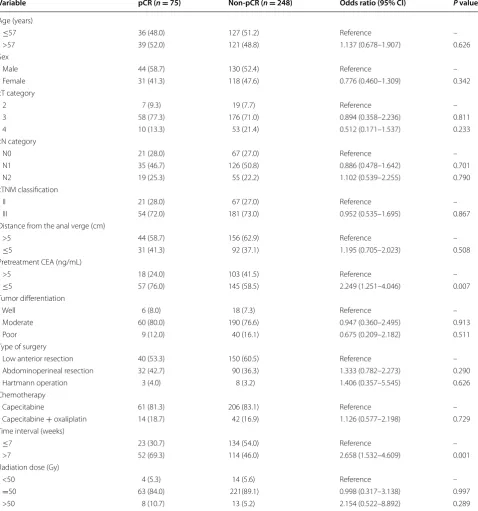
On univariate analysis, an interval from the completion of chemoradiation to surgery of >7 weeks was associated with an increased rate of pCR [odds ratio (OR) = 2.658, 95% confidence interval (CI) = 1.484–4.512, P = 0.001]. A lower pretreatment serum CEA level (≤5 ng/mL) was also significantly associated with an increased rate of pCR (OR = 2.249, 95% CI = 1.251–4.046, P = 0.007). Other factors, such as age, sex, tumor differentiation, clinical TNM classification, tumor distance from the anal verge, radiation dose, and chemotherapy regimen, were not significantly associated with pCR (Table 2).
On multivariate analysis, a pretreatment CEA level of ≤5 ng/mL (OR = 2.170, 95% CI = 1.195–3.939, P = 0.011) and an interval from the completion of neo-adjuvant CRT to surgery of >7 weeks (OR = 2.588, 95% CI = 1.484–4.512, P = 0.001) were identified as inde-pendent predictors for achieving a pCR (Table 3).
Discussion and conclusions
In this study, we analyzed clinical factors or treatment variables that are associated with a complete response to preoperative CRT. Our univariate and multivariate analysis results showed that a pretreatment CEA level of
≤5 ng/mL and an interval from the completion of neo-adjuvant CRT to surgery of >7 weeks were significantly associated with an increased rate of pCR.
Few studies have evaluated clinical factors associ-ated with complete response to preoperative CRT for rectal cancer [16–20]. García-Aguilar et al. [16] studied the clinical factors of 168 patients with locally advanced rectal cancer, but the authors failed to find any factors that were associated with pCR. Kalady et al. [17] iden-tified that an interval of >8 weeks between the comple-tion of preoperative CRT and surgical reseccomple-tion was the only predictor for pCR in a retrospective review of 242 patients. In the largest sample size study to date, Das et al. [18] evaluated the predictors of pCR in 562 patients and found that the circumferential tumor extent was the only factor that was significantly associated with pCR. In a group of 249 patients assessed by Park et al. [19], the pre-CRT movability, post-CRT size, post-CRT
morphology, and gross change were independent predic-tors of pCR. More recently, Garland et al. [20] found that the tumor size and pretreatment clinical N category were independent predictors of pCR after evaluating the clini-cal factors of 297 patients.
The serum CEA level is widely used as a tumor marker in patients with colorectal cancer. The pretreatment CEA level is useful for assessing the prognosis, and postopera-tive CEA testing is used for the early detection of recur-rent disease [21]. However, few studies have evaluated the value of the CEA level in predicting the response to preoperative CRT. We found that the CEA level was sig-nificantly higher in the non-pCR group than in the pCR group; 76.0% of the patients with a pCR had a normal pretreatment CEA level, versus 58.5% of the patients in the non-pCR group. In addition, a normal pretreatment CEA level was significantly associated with pCR in both univariate and multivariate analyses. Several previous studies have reported similar results [20, 22, 23]. Yoon et al. [22] found that the pretreatment CEA level was an independent predictor for pCR. Recently, Garland et al. [20] identified that the pretreatment serum CEA levels and a decrease in the pre- to post-treatment serum CEA level were significantly associated with pCR in univariate analysis. Additionally, tumor cells that have a high den-sity of CEA may resist radiation [24]. However, the exact mechanism is unclear and remains to be elucidated.
Radiation-induced necrosis and subsequent tumor regression is a time-dependent phenomenon in which a longer interval between the completion of CRT and surgery may increase the rate of pCR [17]. In this study, we found that an interval of >7 weeks between the completion of CRT and surgical resection was sig-nificantly associated with a higher rate of pCR (31.3 vs. 14.6%, P = 0.001). Similarly, Kalady et al. [17] reported that an interval of >8 weeks was the only independ-ent predictor for pCR (OR = 2.63, 95% CI = 1.13–6.12, P = 0.020). Wolthuis et al. [25] reported that an interval of >7 weeks was associated with increased pCR (28 vs. 16%, P = 0.030), and the 5-year cancer-specific survival rate was higher in the long-interval group than in the short-interval group (91 vs. 83%, P = 0.046). Conversely, Stein et al. [26] and Lim et al. [27] did not find that a longer interval between CRT and surgical resection was an independent predictor of pCR. To settle these disputes about the optimal time from CRT to surgery, randomized controlled trials are needed.
of these studies reported an increased pCR rate. Recently, O’Connell et al. [29] reported that adding oxaliplatin did not improve the rates of pCR, sphincter-sparing surgery, or surgical down-staging; instead, oxaliplatin added signifi-cant toxicity. We also found that the addition of oxaliplatin
did not increase the pCR rate (25.0 vs. 22.8%, P = 0.729). By contrast, waiting a longer time between CRT and sur-gery was significantly associated with a higher rate of pCR. There are some potential limitations of this study. Because this was a retrospective study, there may be bias.
Table 2 Univariate analyses of predictors for pCR
All values are presents as numbers of patients followed by percentages in parentheses. Other footnotes as in Table 1.
CI confidence interval.
Variable pCR (n = 75) Non-pCR (n = 248) Odds ratio (95% CI) P value
Age (years)
≤57 36 (48.0) 127 (51.2) Reference –
>57 39 (52.0) 121 (48.8) 1.137 (0.678–1.907) 0.626
Sex
Male 44 (58.7) 130 (52.4) Reference –
Female 31 (41.3) 118 (47.6) 0.776 (0.460–1.309) 0.342
cT category
2 7 (9.3) 19 (7.7) Reference –
3 58 (77.3) 176 (71.0) 0.894 (0.358–2.236) 0.811
4 10 (13.3) 53 (21.4) 0.512 (0.171–1.537) 0.233
cN category
N0 21 (28.0) 67 (27.0) Reference –
N1 35 (46.7) 126 (50.8) 0.886 (0.478–1.642) 0.701
N2 19 (25.3) 55 (22.2) 1.102 (0.539–2.255) 0.790
cTNM classification
II 21 (28.0) 67 (27.0) Reference –
III 54 (72.0) 181 (73.0) 0.952 (0.535–1.695) 0.867
Distance from the anal verge (cm)
>5 44 (58.7) 156 (62.9) Reference –
≤5 31 (41.3) 92 (37.1) 1.195 (0.705–2.023) 0.508
Pretreatment CEA (ng/mL)
>5 18 (24.0) 103 (41.5) Reference –
≤5 57 (76.0) 145 (58.5) 2.249 (1.251–4.046) 0.007
Tumor differentiation
Well 6 (8.0) 18 (7.3) Reference –
Moderate 60 (80.0) 190 (76.6) 0.947 (0.360–2.495) 0.913
Poor 9 (12.0) 40 (16.1) 0.675 (0.209–2.182) 0.511
Type of surgery
Low anterior resection 40 (53.3) 150 (60.5) Reference –
Abdominoperineal resection 32 (42.7) 90 (36.3) 1.333 (0.782–2.273) 0.290
Hartmann operation 3 (4.0) 8 (3.2) 1.406 (0.357–5.545) 0.626
Chemotherapy
Capecitabine 61 (81.3) 206 (83.1) Reference –
Capecitabine + oxaliplatin 14 (18.7) 42 (16.9) 1.126 (0.577–2.198) 0.729 Time interval (weeks)
≤7 23 (30.7) 134 (54.0) Reference –
>7 52 (69.3) 114 (46.0) 2.658 (1.532–4.609) 0.001
Radiation dose (Gy)
<50 4 (5.3) 14 (5.6) Reference –
=50 63 (84.0) 221(89.1) 0.998 (0.317–3.138) 0.997
Additionally, we evaluated patients who were treated over the course of 9 years. The CRT regimen and path-ologic assessment may change over time. Other studies have reported some variables that were not included in this study, such as tumor size, circumferential extent of tumor, morphology, and gross change after CRT. These factors are subjective parameters that are susceptible to inter-observer variations, and it is difficult to assess these factors in a retrospective study.
Further prospective studies are needed to identify the predictors for pCR and elucidate its potential mecha-nisms. In the future, it may be possible to stratify patients into different response groups before CRT is initiated, which could allow us to develop individualized therapy plans. Patients who are considered good responders to preoperative CRT may benefit little from TME, and their optimal treatment may involve nonoperative manage-ment or local excision. Patients who are stratified into the poor response group may need more aggressive therapies or alternative new therapies.
In conclusion, this large, retrospective study demon-strated that a pretreatment CEA level of ≤5 ng/mL and an interval from the completion of neoadjuvant CRT to surgery of >7 weeks were independent clinical predictors for achieving pCR. These findings may help clinicians predict the prognosis of patients and develop individual-ized treatment strategies.
Authors’ contributions
W‑GZ, Z‑XZ, and J‑WL conceived of the study and participated in its design and coordination. ZW, X‑MZ, and J‑JH performed the statistical analyses and interpretation. H‑RH, H‑TZ, and W‑GZ drafted the manuscript. All authors read and approved the final manuscript.
Author details
1 Department of Colorectal Surgery, Cancer Hospital, Chinese Academy of Medical Sciences, Peking Union Medical College, 17 Panjiayuan Nanli, Chaoyang District, Beijing 100021, P.R. China. 2 The Overall Planning Office, Cancer Hospital, Chinese Academy of Medical Sciences and Peking Union Medical College, Beijing 100021, P.R. China.
Compliance with ethical guidelines
Competing interests
The authors declare that they have no competing interests.
Received: 8 September 2014 Accepted: 23 April 2015
References
1. Fleming FJ, Påhlman L, Monson JR. Neoadjuvant therapy in rectal cancer. Dis Colon Rectum. 2011;54(7):901–2.
2. Glimelius B. Neo‑adjuvant radiotherapy in rectal cancer. World J Gastro‑ enterol. 2013;19(46):8489–501.
3. Sauer R, Becker H, Hohenberger W, Rödel C, Wittekind C, Fietkau R, et al. Preoperative versus postoperative chemoradiotherapy for rectal cancer. N Engl J Med. 2004;351(17):1731–40.
4. Sauer R, Liersch T, Merkel S, Fietkau R, Hohenberger W, Hess C, et al. Preoperative versus postoperative chemoradiotherapy for locally advanced rectal cancer: results of the German CAO/ARO/AIO‑94 rand‑ omized phase III trial after a median follow‑up of 11 years. J Clin Oncol. 2012;30(16):1926–33.
5. Martin ST, Heneghan HM, Winter DC. Systematic review and meta‑analy‑ sis of outcomes following pathological complete response to neoadju‑ vant chemoradiotherapy for rectal cancer. Br J Surg. 2012;99(7):918–28. 6. Maas M, Nelemans PJ, Valentini V, Das P, Rödel C, Kuo LJ, et al. Long‑term
outcome in patients with a pathological complete response after chemo‑ radiation for rectal cancer: a pooled analysis of individual patient data. Lancet Oncol. 2010;11(9):835–44.
7. de Campos‑Lobato LF, Stocchi L, da Luz Moreira A, Geisler D, Dietz DW, Lavery IC, et al. Pathologic complete response after neoadjuvant treat‑ ment for rectal cancer decreases distant recurrence and could eradicate local recurrence. Ann Surg Oncol. 2011;18(6):1590–8.
8. Capirci C, Valentini V, Cionini L, De Paoli A, Rodel C, Glynne‑Jones R, et al. Prognostic value of pathologic complete response after neoadjuvant therapy in locally advanced rectal cancer: long‑term analysis of 566 ypCR patients. Int J Radiat Oncol Biol Phys. 2008;72(1):99–107.
9. Habr‑Gama A, Perez RO, Nadalin W, Sabbaga J, Ribeiro U Jr, Silva e Sousa AH Jr, et al. Operative versus nonoperative treatment for stage 0 distal rectal cancer following chemoradiation therapy: long‑term results. Ann Surg. 2004;240(4):711–7.
10. Maas M, Beets‑Tan RG, Lambregts DM, Lammering G, Nelemans PJ, Enge‑ len SM, et al. Wait‑and‑see policy for clinical complete responders after chemoradiation for rectal cancer. J Clin Oncol. 2011;29(35):4633–40. 11. Moureau‑Zabotto L, Farnault B, de Chaisemartin C, Esterni B, Lelong B, Viret F, et al. Predictive factors of tumor response after neoadjuvant chemoradiation for locally advanced rectal cancer. Int J Radiat Oncol Biol Phys. 2011;80(2):483–91.
12. Park YA, Sohn SK, Seong J, Baik SH, Lee KY, Kim NK, et al. Serum CEA as a predictor for the response to preoperative chemoradiation in rectal cancer. J Surg Oncol. 2006;93(2):145–50.
13. Kuremsky JG, Tepper JE, McLeod HL. Biomarkers for response to neo‑ adjuvant chemoradiation for rectal cancer. Int J Radiat Oncol Biol Phys. 2009;74(3):673–88.
14. Zeng WG, Zhou ZX, Liang JW, Wang Z, Hou HR, Zhou HT, et al. Impact of interval between neoadjuvant chemoradiotherapy and surgery for rectal cancer on surgical and oncologic outcome. J Surg Oncol. 2014;110(4):463–7.
15. Zeng WG, Zhou ZX, Wang Z, Liang JW, Hou HR, Zhou HT, et al. Lymph node ratio is an independent prognostic factor in node positive rectal cancer patients treated with preoperative chemoradiotherapy followed by curative resection. Asian Pac J Cancer Prev. 2014;15(13):5365–9. 16. García‑Aguilar J, Hernandez de Anda E, Sirivongs P, Lee SH, Madoff RD,
Rothenberger DA. A pathologic complete response to preoperative chemoradiation is associated with lower local recurrence and improved survival in rectal cancer patients treated by mesorectal excision. Dis Colon Rectum. 2003;46(3):298–304.
17. Kalady MF, de Campos‑Lobato LF, Stocchi L, Geisler DP, Dietz D, Lavery IC, et al. Predictive factors of pathologic complete response after neoadju‑ vant chemoradiation for rectal cancer. Ann Surg. 2009;250(4):582–9. 18. Das P, Skibber JM, Rodriguez‑Bigas MA, Feig BW, Chang GJ, Wolff
RA, et al. Predictors of tumor response and downstaging in patients who receive preoperative chemoradiation for rectal cancer. Cancer. 2007;109(9):1750–5.
Table 3 Multivariate analyses of predictors for pCR
Footnotes as in Tables 1 and 2.
Variable Odds ratio 95% CI P value
Serum CEA (ng/mL)
>5 Reference – –
≤5 2.170 1.195–3.939 0.011
Time interval (weeks)
≤7 Reference – –
19. Park CH, Kim HC, Cho YB, Yun SH, Lee WY, Park YS, et al. Predicting tumor response after preoperative chemoradiation using clinical parameters in rectal cancer. World J Gastroenterol. 2011;17(48):5310–6.
20. Garland ML, Vather R, Bunkley N, Pearse M, Bissett IP. Clinical tumour size and nodal status predict pathologic complete response following neoadjuvant chemoradiotherapy for rectal cancer. Int J Colorectal Dis. 2014;29(3):301–7.
21. Berman JM, Cheung RJ, Weinberg DS. Surveillance after colorectal cancer resection. Lancet. 2000;355(9201):395–9.
22. Yoon SM, Kim DY, Kim TH, Jung KH, Chang HJ, Koom WS, et al. Clinical parameters predicting pathologic tumor response after preopera‑ tive chemoradiotherapy for rectal cancer. Int J Radiat Oncol Biol Phys. 2007;69(4):1167–72.
23. Park JW, Lim SB, Kim DY, Jung KH, Hong YS, Chang HJ, et al. Carcinoem‑ bryonic antigen as a predictor of pathologic response and a prognostic factor in locally advanced rectal cancer patients treated with preop‑ erative chemoradiotherapy and surgery. Int J Radiat Oncol Biol Phys. 2009;74(3):810–7.
24. Riesterer O, Milas L, Ang KK. Use of molecular biomarkers for predict‑ ing the response to radiotherapy with or without chemotherapy. J Clin Oncol. 2007;25(26):4075–83.
25. Wolthuis AM, Penninckx F, Haustermans K, De Hertogh G, Fieuws S, Van Cutsem E, et al. Impact of interval between neoadjuvant chemo‑ radiotherapy and TME for locally advanced rectal cancer on pathologic response and oncologic outcome. Ann Surg Oncol. 2012;19(9):2833–41.
26. Stein DE, Mahmoud NN, Anné PR, Rose DG, Isenberg GA, Goldstein SD, et al. Longer time interval between completion of neoadjuvant chemo‑ radiation and surgical resection does not improve downstaging of rectal carcinoma. Dis Colon Rectum. 2003;46(4):448–53.
27. Lim SB, Choi HS, Jeong SY, Kim DY, Jung KH, Hong YS, et al. Optimal surgery time after preoperative chemoradiotherapy for locally advanced rectal cancers. Ann Surg. 2008;248(2):243–51.
28. Park IJ, You YN, Agarwal A, Skibber JM, Rodriguez‑Bigas MA, Eng C, et al. Neoadjuvant treatment response as an early response indicator for patients with rectal cancer. J Clin Oncol. 2012;30(15):1770–6.
29. O’Connell MJ, Colangelo LH, Beart RW, Petrelli NJ, Allegra CJ, Sharif S, et al. Capecitabine and oxaliplatin in the preoperative multimodality treatment of rectal cancer: surgical end points from national surgical adjuvant breast and bowel project trial R‑04. J Clin Oncol. 2014;32(18):1927–34. 30. Gérard JP, Azria D, Gourgou‑Bourgade S, Martel‑Lafay I, Hennequin C, Etienne PL, et al. Clinical outcome of the ACCORD 12/0405 PRODIGE 2 randomized trial in rectal cancer. J Clin Oncol. 2012;30(36):4558–65. 31. Dewdney A, Cunningham D, Tabernero J, Capdevila J, Glimelius
B, Cervantes A, et al. Multicenter randomized phase II clinical trial comparing neoadjuvant oxaliplatin, capecitabine, and preoperative radiotherapy with or without cetuximab followed by total mesorectal excision in patients with high‑risk rectal cancer (EXPERT‑C). J Clin Oncol. 2012;30(14):1620–7.
Submit your next manuscript to BioMed Central and take full advantage of:
• Convenient online submission
• Thorough peer review
• No space constraints or color figure charges
• Immediate publication on acceptance
• Inclusion in PubMed, CAS, Scopus and Google Scholar
• Research which is freely available for redistribution