RESEARCH
Interferon γ induced compositional
changes in human bone marrow derived
mesenchymal stem/stromal cells
Qingdong Guan
1,2, Peyman Ezzati
3, Victor Spicer
3, Oleg Krokhin
3, Donna Wall
4and John A. Wilkins
3*Abstract
Background: Mesenchymal stem/stromal cells (MSC) display a range of immunoregulatory properties which can be enhanced by the exposure to cytokines such interferon γ (IFN-γ). However the compositional changes associated with the ‘licensing’ of these cells have not been clearly defined. The present study was undertaken to provide a detailed comparative proteomic analysis of the compositional changes that occur in human bone marrow derived MSC fol-lowing 20 h treatment with IFN-γ.
Methods: 2D LC MSMS analysis of control and IFN-γ treated cells from 5 different healthy donors provided confident identification of more than 8400 proteins.
Results: In total 210 proteins were shown to be significantly altered in their expression levels (≥|2SD|) following IFN-γ treatment. The changes for several of these proteins were confirmed by flow cytometry. STRING analysis determined that approximately 30% of the altered proteins physically interacted in described interferon mediated processes. Comparison of the list of proteins that were identified as changed in the proteomic analysis with data for the same proteins in the Interferome DB indicated that ~35% of these proteins have not been reported to be IFN-γ responsive in a range of cell types.
Conclusions: This data provides an in depth analysis of the proteome of basal and IFN-γ treated human mesenchy-mal stem cells and it identifies a number of novel proteins that may contribute to the immunoregulatory capacity if IFN-γ licensed cells.
Keywords: Proteomics, Human, 2D LC mass spectrometry, Interferon γ, Mesenchymal stem/stromal cells (MSC), Quantitative proteome profiling, Licensing, Membrane
© The Author(s) 2017. This article is distributed under the terms of the Creative Commons Attribution 4.0 International License (http://creativecommons.org/licenses/by/4.0/), which permits unrestricted use, distribution, and reproduction in any medium, provided you give appropriate credit to the original author(s) and the source, provide a link to the Creative Commons license, and indicate if changes were made. The Creative Commons Public Domain Dedication waiver (http://creativecommons.org/ publicdomain/zero/1.0/) applies to the data made available in this article, unless otherwise stated.
Background
Mesenchymal stem/stromal cells (MSC) are multipotent stromal cells derived from all mammalian supportive stromal tissue compartments containing distinct pools of endogenous progenitor cells. MSC possess the poten-tial for self-renewal and multi-lineage differentiation. The demonstration that MSC can also display potent
immunoregulatory activities has led to marked interest in their potential use in the treatment of autoimmunity and transplant rejection [1–4]. The underlying processes include both contact dependent (e.g. PDL-1) and soluble effector mediated processes (e.g. IDO-1) [5, 6]. Addi-tionally, MSC can regulate innate and adaptive immune responses through the release of soluble mediators (e.g. IL-10, TGFβ), the induction of regulatory T cells (Treg) and the suppression effector CD4+ and CD8+ T cells [7–11]. The fact that this activity may be enhanced by treatment of MSC with cytokines such as TNF α, IFN-γ, IL-17, IL-1α or IL-1β, has resulted in several protocols for possible ‘licensing’ of MSC [12–15]. Although a num-ber of pathways have been implicated in this process, the
Open Access
*Correspondence: John.Wilkins@umanitoba.ca
3 Manitoba Centre for Proteomics and Systems Biology, Section
of Biomedical Proteomics, Department of Internal Medicine, Rady Faculty of Health Sciences, University of Manitoba and Health Sciences Centre, 799 John Buhler Research Centre, 715 McDermot Ave, Winnipeg, MB R3E 3P4, Canada
underlying mechanisms responsible for the immunoreg-ulatory activity have not been fully elucidated. These observations highlight the need for an understanding of the responses of MSC to treatment with the cytokines.
To date there have been a limited number of detailed analysis of the proteomes of MSC. In many of these stud-ies, the focus has been largely on the comparative analysis of cells from different tissue sources, and/or multi-tissue differentiation ability, tissue repair and self-renewal [16, 17] or more recently relating to the secretomes of various cells [18–20]. Significantly the majority of these studies have used fetal bovine serum (FBS) expanded MSC for proteom-ics analysis which will not be used in the manufacturing of clinical grade MSC. In fact there have been very few studies that have examined MSC and their responses to cytokine stimulation. Thus the basis for cytokine enhanced MSC immunoregulatory activity is not fully understood.
The aim of the present study was to determine the changes in protein composition that occur in GMP grade human platelet lysate expanded MSC subsequent to 20 h of treatment with interferon γ. The focus was spe-cifically on those proteins that displayed consistent and significant alterations in their expression patterns follow-ing treatment. These proteins might ultimately be use-ful in identifying markers to assess the IFN-γ responses of treated cells or in defining the compositional changes mechanistically involved in the immunoregulatory fea-tures of the licensed cells.
Methods Chemicals
All chemicals were sourced from Sigma Chemicals (St-Louis, MO), unless noted otherwise. HPLC-grade acetonitrile and de-ionized water were used for the prep-aration of eluents. Sequencing-grade modified trypsin (Promega, Madison, WI) and 15 mL Amicon centrifugal filter units (Merck Millipore, Ireland) was used for diges-tion. Siliconized 1.5 mL vials (BioPlas, San Rafael, CA) were used for all sample preparation and fractions han-dling steps.
MSC expansion and licensing
Bone marrow aspirates were obtained from the poste-rior iliac crest of normal volunteers under institutional REB-approved study. The donors were 4 males and 1 female ranging in age from 8 to 41 years. Bone marrow-derived MSC cultures were established and maintained in a GMP compliant facility as described previously [21]. To license MSC, cells from the first or second passage were seeded into T175 flasks at 2000–3000 cells/cm2 in
complete DMEM media (Lonza, USA) with 5% human platelet lysate (Mill Creek Life Sciences, Rochester, USA), 1% glutamax (Life technologies, California, USA) and
gentamicin (5 µg/ml, Life Technologies); When the cell confluence reached 70–80%, human recombinant IFN-γ (eBioscience, California, USA) was added into the MSC culture media at 30 ng/mL for 20 h and then cells were released with tryple select (Life Technologies), washed with DPBS and analyzed [22].
Phenotyping of MSC
The immunophenotype of expanded MSCs was char-acterized by flow cytometry as described previously (Minimal criteria for defining multipotent mesenchymal stromal cells [23]. Briefly, 0.5 × 10⁶ MSCs were washed
in FACS buffer, and then incubated with Fc block for 10 min. This was followed by staining with FITC, APC or PE -labelled antibodies against surface molecules CD90, CD73, CD105, CD34, CD45, CD14, HLA-DR, CD19 and isotype control (eBioscience) respectively, for 20 min according to the manufacturer recommendations. After staining, cells were acquired and analyzed using flow cytometry (FACS Canto II, BD Biosciences, San Jose, USA) and FlowJo software (TreeStar, San Carlos, CA, USA).
Using the same methods, PE-Cy7, FITC, APC-Cy7 or Percp-Cy5.5 labeled antibodies against PD-L1, BST-2, ICAM-1 and VCAM-1 (eBioscience), were used to evaluate the expression of PD-L1, BST-2, ICAM-1 and VCAM-1 on the surface of MSC. To evaluate the expres-sion of intracellular proteins IDO-1, MSC were fixed and permeabilized using eBioscience intracellular fixation/ permeabilization buffer. Cells were then stained with PE-labeled anti-IDO-1 for 20 min. After staining, cells were acquired and analyzed using flow cytometry (FACS Canto II, BD Biosciences, San Jose, USA) and FlowJo software (TreeStar, San Carlos, CA, USA).
MSC trilineage differentiation assay
MSC were induced to differentiate into adipogenic, osteogenic or chondrogenic lineages, with the use of the STEMPRO Adipogenesis, Osteogenesis, and Chondro-genesis Differentiation Kit (Thermo Fisher Scientific) as described previously [24]. Briefly, MSC were seeded into 6-well plates at 3000/cm2 in DMEM with 5% human
platelet lysate. When MSC were reached 80% conflu-ency, each well was replaced with adipogenic, osteogenic or chondrogenic differentiation media according to the manufacturer’s instruction for 14–21 days. The staining analysis was performed with the use of oil red O, Alizarin red S and Safranin O staining for adipocytes, osteocytes and chondrocytes, respectively.
Processing of cells for MS analysis
Protein amounts to be subjected to digestion were moni-tored using micro-BCA assay (Pierce, Rockford, IL). Resulting digest was acidified with TFA and purified by RP SPE. Approximately 100 μg of the digests (determined by NanoDrop 2000, ThermoFisher) was used for 2D LC– MS experiments [26].
First dimension separation and fraction collection
Agilent 1100 series LC system with UV detector (214 nm) and 3 mm × 100 mm XTerra MS C18, 3.5 μm column (Waters, Ireland) was used for pH 10 separations. 0.66% acetonitrile gradient (0–40% acetonitrile) was delivered at 300 μL/min flow rate. Both eluents A (water) and B (1:9 water:acetonitrile) contained 20 mM ammonium formate and were prepared by 1:10 dilution of 200 mM ammonium solution with pH 10 adjusted by formic acid. Manual Reodyne injector (Bensheim, Germany) with 200 μL loop was used to deliver ~100 μg of digested sam-ple onto the column. One-minute fractions were col-lected over the 7–55 min interval, concatenated into 21 fractions, lyophilized and re-suspended in buffer A (0.1% formic acid in water).
HPLC–MS settings in the second dimension
A splitless nano-flow 2D LC Ultra system (Eksigent, Dub-lin, CA) was used to deliver water/acetonitrile gradient at 500 nL/min flow rate through a 100 μm × 200 mm analytical column packed with 3 μm Luna C18(2) (Phe-nomenex, Torrance, CA) at room temperature. Sample injection (~1 μg of peptides from each fraction in 10 μL of buffer A) via a 300 μm × 5 mm PepMap100 trap-column (ThermoFisher) was used in all experiments. The gradi-ent program included following steps: linear increase from 0.5 to 30% of buffer B (acetonitrile) in 78 min, 5 min columns wash with 90% B and 8 min system equilibra-tion using starting condiequilibra-tions of 0.5% B. Both eluents A (water) and B (acetonitrile) contained 0.1% formic acid as ion-pairing modifier.
Data-dependent acquisition TripleTOF5600 mass spec-trometer (Sciex, Concord, ON) was performed using following settings: 250 ms survey MS spectra (m/z 300– 1500) was followed by up to 20 MS/MS measurements on the most intense parent ions (300 counts/s threshold,
+2 to +4 charge state, m/z 100–1500 mass range for MS/ MS, 100 ms each, high sensitivity mode). Previously tar-geted parent ions were excluded from repetitive MS/MS acquisition for 12 s (50 mDa mass tolerance).
Data treatment and protein/peptide identification
Raw spectra files were converted into Mascot Generic File format (MGF) for peptide/protein identification by X!Tandem search algorithm [27]. Ten combined MGF files (each containing 21 MGFs of individual fractions)
were created for subsequent protein identification and quantitation. The following X!Tandem search parameters were used: 20 and 50 ppm mass tolerance for parent and fragment ions, respectively; constant modification of Cys with iodoacetamide; default set post-translational modi-fications: oxidation of Met, Trp; N-terminal cyclization at Qln, Cys; N-terminal acetylation, phosphorylation (Ser, Thr, Tyr), deamidation (Asn and Gln); an expecta-tion value cut-off of Log(e) < −1 for both proteins and peptides.
Spectra (in MGF format) and protein quantitation results are available at the University of California, San Diego’s MassIVE archive (massive.ucsd.edu) under the accession MSV000080890.
Results
Characterization of isolated MSC
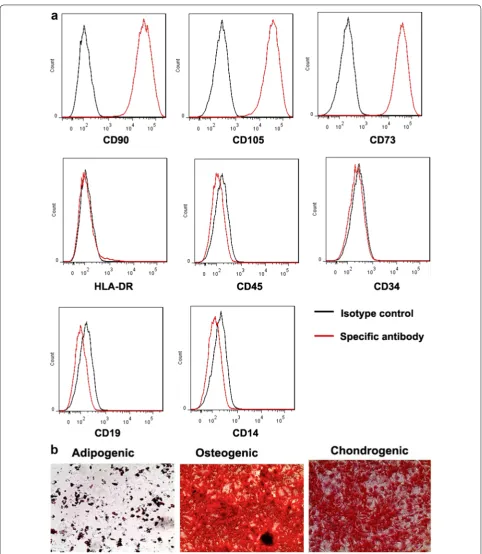
The isolated MSC were initially characterised to dem-onstrate that they expressed the appropriate surface markers and differentiation capacity as outlined by the International Society for Cell Therapy [23]. The cells expressed the MSC markers, CD90 (Thy-1), CD105 (endoglin) and CD 73 (ecto 5′nucleotidase). The cells lacked the pan-leukocyte marker CD45, the primitive hematopoietic and endothelial marker CD34, the B cell marker, CD19 and the macrophage/monocyte marker, CD14 as well as HLA-DR which is not expressed on MSC unless they have been activated (Fig. 1a). The capacity of the MSC to differentiate into chondrocytes, osteoblasts or adipocytes was also confirmed (Fig. 1b). Collectively these results indicate that the MSC isolates conformed to criteria for this designation.
Protein identification and relative quantitation
Paired digests of cell lysates of untreated and IFN-γ treated MSC expanded from 5 separate healthy indi-viduals were separated by 2D liquid chromatography and analysed by mass spectrometry. The resulting MGF spectra files for each analysis were sequentially con-catenated and searched against a human subset of the Uniprot protein database (June 2015) using X!tandem (cyclone 2012.10.01.1). Confident protein identifications were selected based on the requirement for at least two distinct unique peptides each with expectation scores of
−1.5 or lower and of −3 or lower for the protein. Pep-tide and protein identification statistics are summarized (Additional file 1: Table S1) which illustrate the signifi-cant and uniform depth of coverage across the five donor paired samples. A total of 8437 proteins were identified with ~4500 shared proteins being observed in all of the analyses.
member peptides for each of the ten MS runs. In order to be included for quantification, at least two non-redundant peptide sequences were required for each protein. Protein level expression sums were mapped into a log2 scale and
protein-by-protein differential analysis [D = (IFN inten-sity) − (CONTROL intensity)] was calculated across each of the donor cell pairs. These five donor protein-level differ-ences each manifested as three Gaussian populations, with proteins observed in both modes forming the central popu-lation, and proteins observed uniquely in one mode or the other forming the other two populations. Selection of pro-teins for relative quantitation was based on a requirement that at least two non-redundant peptides were detected in the observed mode. Each central difference population was used for the normalization (mean = 0, SD = 1) of all three difference populations; while the resulting outer two differ-ence population’s Z-scores were not directly informative of the probability of the difference being a random event. However, putting all measurements into a common scale made the comparative analysis across the five donors pos-sible (Additional file 1: Table S1).
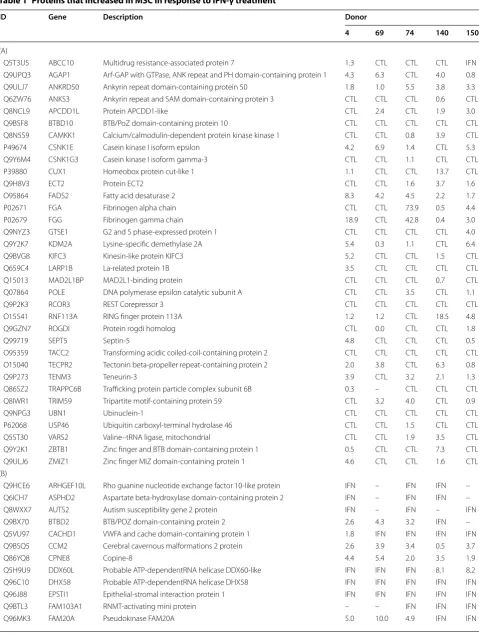
The data was analysed to identify those proteins in the IFN-γ treated population that showed a change of greater than two standard deviations from the mean of the over-all protein change in the population (i.e. the mean dif-ference of [D = (IFN intensity) − (CTL intensity)]. This corresponded to a ~3 fold difference in signal intensity because all five cell pairs had approximately the same dif-ference distribution standard deviations. The criteria for assigning a protein differentially expressed status was based on a requirement that the protein displayed a con-sistent significant change in at least 3 of the 5 cell pairs following interferon treatment. This approach resulted in the identification of 169 proteins with increased expres-sion and 41 proteins with decreased levels following interferon treatment (Tables 1A, B, 2A, B).
Flow cytometric analysis of IFN‑γ treated MSC
In an independent series of experiments the levels of expression of selected candidates (i.e. VCAM-1, ICAM1, IDO1, PDL1 and BST2) were compared between IFN-γ treated and the corresponding untreated MSC popula-tions (Fig. 2). These proteins were all predicted from the proteomic analysis to increase following IFN-γ treat-ment. The flow cytometry results indicated that IDO1 and BST2 levels increased from being virtually unde-tectable to being highly expressed on all cells following treatment. The expression levels of PDL1, ICAM1 and VCAM1 increased from very low but to detectable lev-els to markedly increased expression in the IFN-γ treated group. These results were consistent with those of the mass spectrometry analysis and offered an independent validation of the proteomic expression results.
Network and GO analysis
The list of significantly changed proteins identified in the proteomic analysis was submitted for STRING network analysis [28]. The analysis settings were: confidence level of 0.7 or greater using only evidence derived from data-bases and experiments. Analysis of the entire list indi-cated a highly organised and significant network (p = 0)
with an average degree of 2.81 and a clustering coefficient of 9.45. There was a single dominant network consisting of 51 proteins which displayed a high level of connectiv-ity. The remainder of the interacting proteins (n = 21)
were associated with 7 smaller groups consisting of 2 or 3 interactors (Fig. 2). Thus of the 169 proteins that were increased following IFN-γ treatment ~40% (n = 68) were
components of a protein–protein interaction network as determined by STRING. A separate analysis of the proteins that were decreased following IFN-γ treatment indicated that there were no significant protein–protein interactions in this group.
Functional analysis of the altered proteins using GO indicated that there was a highly significant enrich-ment of proteins (n = 73) related to host defence
responses (FDR 4.97 × 10⁻³³). The proteins were
enriched for “Interferon gamma-mediated signalling pathway” (n = 19, FDR 9.31 × 10⁻²¹). There was also
a significant enrichment in proteins that were desig-nated as involved in “Type I interferon signalling path-way” (n = 23, FDR 6.78 × 10⁻²⁷). Although many of
the upregulated proteins identified were common to both of the interferon signalling pathways, there were some clear differences in the proteins associated with the two pathways (Fig. 3). The remaining interact-ing proteins were components of shared pathways or processes (e.g. PTGES/PTGS2/PTGIS, APOBEC3F/ APOBEC3G).
Relationship between IFN‑γ induced proteomic and transcriptomic changes
Table 1 Proteins that increased in MSC in response to IFN-γ treatment
ID Gene Description Donor
4 69 74 140 150
(A)
Q5T3U5 ABCC10 Multidrug resistance-associated protein 7 1.3 CTL CTL CTL IFN
Q9UPQ3 AGAP1 Arf-GAP with GTPase, ANK repeat and PH domain-containing protein 1 4.3 6.3 CTL 4.0 0.8
Q9ULJ7 ANKRD50 Ankyrin repeat domain-containing protein 50 1.8 1.0 5.5 3.8 3.3
Q6ZW76 ANKS3 Ankyrin repeat and SAM domain-containing protein 3 CTL CTL CTL 0.6 CTL
Q8NCL9 APCDD1L Protein APCDD1-like CTL 2.4 CTL 1.9 3.0
Q9BSF8 BTBD10 BTB/PoZ domain-containing protein 10 CTL CTL CTL CTL CTL
Q8N5S9 CAMKK1 Calcium/calmodulin-dependent protein kinase kinase 1 CTL CTL 0.8 3.9 CTL
P49674 CSNK1E Casein kinase I isoform epsilon 4.2 6.9 1.4 CTL 5.3
Q9Y6M4 CSNK1G3 Casein kinase I isoform gamma-3 CTL CTL 1.1 CTL CTL
P39880 CUX1 Homeobox protein cut-like 1 1.1 CTL CTL 13.7 CTL
Q9H8V3 ECT2 Protein ECT2 CTL CTL 1.6 3.7 1.6
O95864 FADS2 Fatty acid desaturase 2 8.3 4.2 4.5 2.2 1.7
P02671 FGA Fibrinogen alpha chain CTL CTL 73.9 0.5 4.4
P02679 FGG Fibrinogen gamma chain 18.9 CTL 42.8 0.4 3.0
Q9NYZ3 GTSE1 G2 and S phase-expressed protein 1 CTL CTL CTL CTL 4.0
Q9Y2K7 KDM2A Lysine-specific demethylase 2A 5.4 0.3 1.1 CTL 6.4
Q9BVG8 KIFC3 Kinesin-like protein KIFC3 5.2 CTL CTL 1.5 CTL
Q659C4 LARP1B La-related protein 1B 3.5 CTL CTL CTL CTL
Q15013 MAD2L1BP MAD2L1-binding protein CTL CTL CTL 0.7 CTL
Q07864 POLE DNA polymerase epsilon catalytic subunit A CTL CTL 3.5 CTL 1.1
Q9P2K3 RCOR3 REST Corepressor 3 CTL CTL CTL CTL CTL
O15541 RNF113A RING finger protein 113A 1.2 1.2 CTL 18.5 4.8
Q9GZN7 ROGDI Protein rogdi homolog CTL 0.0 CTL CTL 1.8
Q99719 SEPT5 Septin-5 4.8 CTL CTL CTL 0.5
O95359 TACC2 Transforming acidic coiled-coil-containing protein 2 CTL CTL CTL CTL CTL
O15040 TECPR2 Tectonin beta-propeller repeat-containing protein 2 2.0 3.8 CTL 6.3 0.8
Q9P273 TENM3 Teneurin-3 3.9 CTL 3.2 2.1 1.3
Q86SZ2 TRAPPC6B Trafficking protein particle complex subunit 6B 0.3 – CTL CTL CTL
Q8IWR1 TRIM59 Tripartite motif-containing protein 59 CTL 3.2 4.0 CTL 0.9
Q9NPG3 UBN1 Ubinuclein-1 CTL CTL CTL CTL CTL
P62068 USP46 Ubiquitin carboxyl-terminal hydrolase 46 CTL CTL 1.5 CTL CTL
Q5ST30 VARS2 Valine–tRNA ligase, mitochondrial CTL CTL 1.9 3.5 CTL
Q9Y2K1 ZBTB1 Zinc finger and BTB domain-containing protein 1 0.5 CTL CTL 7.3 CTL
Q9ULJ6 ZMIZ1 Zinc finger MIZ domain-containing protein 1 4.6 CTL CTL 1.6 CTL
(B)
Q9HCE6 ARHGEF10L Rho guanine nucleotide exchange factor 10-like protein IFN – IFN IFN –
Q6ICH7 ASPHD2 Aspartate beta-hydroxylase domain-containing protein 2 IFN – IFN IFN –
Q8WXX7 AUTS2 Autism susceptibility gene 2 protein IFN – IFN – IFN
Q9BX70 BTBD2 BTB/POZ domain-containing protein 2 2.6 4.3 3.2 IFN –
Q5VU97 CACHD1 VWFA and cache domain-containing protein 1 1.8 IFN IFN IFN IFN
Q9BSQ5 CCM2 Cerebral cavernous malformations 2 protein 2.6 3.9 3.4 0.5 3.7
Q86YQ8 CPNE8 Copine-8 4.4 5.4 2.0 3.5 1.9
Q5H9U9 DDX60L Probable ATP-dependentRNA helicase DDX60-like IFN IFN IFN 8.1 8.2
Q96C10 DHX58 Probable ATP-dependentRNA helicase DHX58 IFN IFN IFN IFN IFN
Q96J88 EPSTI1 Epithelial-stromal interaction protein 1 IFN IFN IFN IFN IFN
Q9BTL3 FAM103A1 RNMT-activating mini protein – – IFN IFN IFN
It was noteworthy that a small subset of proteins upregulated in the interferon treated group and assigned to networks by the STRING analysis (HRAS, GAB1, HDAC1, SMAD3, GGT5, PTGS2, and PTGIS) have interactions with other IFN-γ regulated proteins. Each of these proteins was directly linked to a node in the net-work that was IFN-γ responsive.
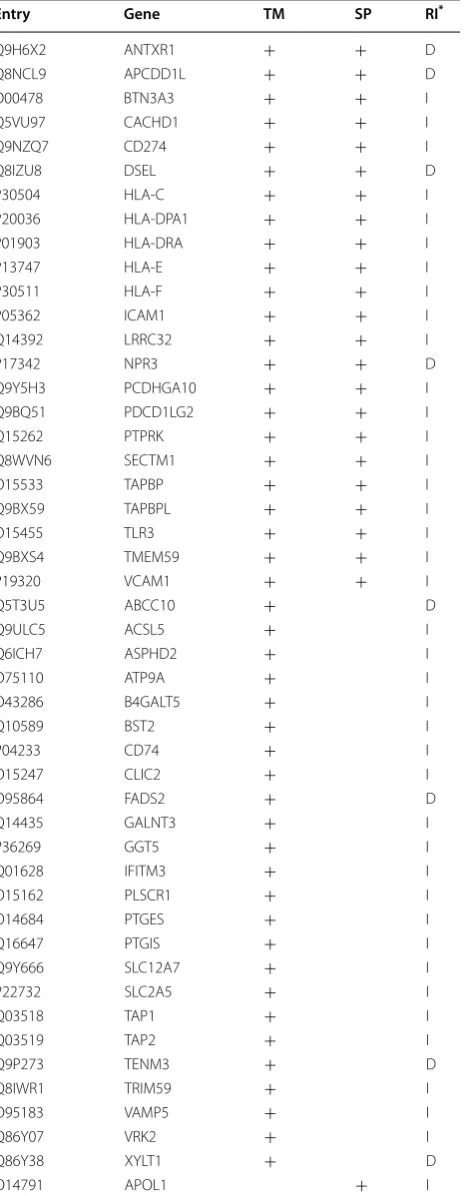
IFN‑γ induced changes in membrane and secreted proteins We were interested in the identification of IFN-γ induced membrane associated changes as these might repre-sent useful biomarkers to measure the response of cells to IFN-γ treatment. The list of proteins displaying prot-eomic changes was analysed in Uniprot for expression of transmembrane regions [30]. A total of 47 proteins were
predicted to be membrane proteins. The proteins are listed as those displaying either a gain or loss of expression in response to IFN-γ treatment (Table 3). The proteins were enriched for the KEGG pathways “Antigen pro-cessing and presentation” (CD74, HLA-C, HLA-DPA1, HLA-DRA, HLA-E, TAP1, TAPBP; FDR 1.07 × 10⁻⁸) and
“Cell adhesion molecules” (CD274, HLA-C, HLA-DPA1, HLA-DRA, HLA-E, ICAM1, PDCD1LG2, VCAM1; FDR 2.3 × 10⁻⁸). Although not highly significant “Arachidonic
acid metabolism” (GGT5, PTGES, PTGIS; FDR 0.00472) was also over represented in the membrane proteins. There were fewer membrane proteins (n = 8) identified that showed a decrease in expression following IFN-γ treatment. These proteins did not appear to be associated with any clearly defined process or functions.
Proteins that were increased following interferon treatment with transcripts that are (A) designated as IFN-γ responsive or (B) not designated as IFN-γ responsive. Results are presented as fold increase following 20 h of IFN-γ treatment. IFN indicates only detected in interferon treated cells. CTL indicates only detected in untreated cells. – indicates not detected in indicated donor sample
Table 1 continued
ID Gene Description Donor
4 69 74 140 150
Q8IXL6 FAM20C Extracellular serine/threonine protein kinase FAM20C IFN 1.0 IFN 11.1 IFN
Q13480 GAB1 GRB2-associated-binding protein 1 IFN 2.2 4.8 IFN –
Q14435 GALNT3 Polypeptide N-acetylgalactosaminyltransferase 3 IFN 12.1 8.5 3.6 IFN
P36269 GGT5 Gamma-glutamyltransferase 5 6.2 1.0 16.8 2.5 IFN
Q13547 HDAC1 Histone deacetylase 1 6.8 1.9 3.6 4.7 0.8
P01112 HRAS GTPase HRas 13.6 1.4 1.2 4.1 IFN
P01579 IFNG Interferon gamma IFN IFN IFN – IFN
Q13572 ITPK1 Inositol-tetrakisphosphate 1-kinase IFN 3.9 2.5 1.6 3.0
Q16363 LAMA4 Laminin subunit alpha-4 1.9 2.4 3.2 3.4 12.1
Q14392 LRRC32 Leucine-rich repeat-containing protein 32 IFN IFN IFN – IFN
P11137 MAP2 Microtubule-associated protein 2 – – IFN IFN IFN
Q96DP5 MTFMT Methionyl-tRNA formyltransferase, mitochondrial – – IFN IFN IFN
O75113 N4BP1 NEDD4-binding protein 1 3.5 2.0 2.1 4.6 3.5
Q7Z2Y5 NRK Nik-related protein kinase – IFN IFN IFN –
Q9Y5H3 PCDHGA10 Protocadherin gamma-A10 IFN IFN – IFN –
Q9H4M7 PLEKHA4 Pleckstrin homology domain-containing family A member 4 IFN IFN IFN 4.7 IFN
Q16647 PTGIS Prostacyclin synthase IFN 1.3 52.2 37.4 2.0
P35354 PTGS2 Prostaglandin G/H synthase 2 IFN – – IFN IFN
Q15262 PTPRK Receptor-type tyrosine-protein phosphatase kappa 4.5 2.1 5.7 4.2 3.3
P05120 SERPINB2 Plasminogen activator inhibitor 2 IFN IFN IFN 1.0 CTL
P22732 SLC2A5 Solute carrier family 2, facilitated glucose transporter member 5 IFN IFN – IFN –
P84022 SMAD3 Mothers against decapentaplegic homolog 3 4.2 0.2 5.9 4.6 1.5
Q9BXI6 TBC1D1 TBC1 domain family member 1 3.8 IFN 10.0 1.5 2.6
Q9BXS4 TMEM59 Transmembrane protein 59 4.9 IFN IFN 0.9 –
Q9BVA1 TUBB2B Tubulin beta-2B chain 0.8 1.5 IFN 65.6 IFN
P22415 USF1 Upstream stimulatory factor 1 – – IFN IFN IFN
O75317 USP12 Ubiquitin carboxyl-terminal hydrolase 12 IFN IFN – 2.2 IFN
Q702N8 XIRP1 Xin actin-binding repeat-containing protein 1 IFN IFN IFN IFN 7.3
There was also a subset of IFN-γ responsive proteins that were predicted to lack transmembrane sequences but to contain signal peptide sequences characteristic
of secreted proteins (Table 3). STRING analysis of these proteins indicated protein interaction network associated with antigen processing and presentation and fibrinolysis.
Table 2 Proteins that decreased in MSC in response to IFN-γ treatment
Proteins that were decreased following interferon treatment with transcripts that are (A) designated as IFN-γ responsive or (B) not designated as IFN-γ responsive. Results are presented as fold decrease following 20 h of IFN-γ treatment. IFN indicates only detected in interferon treated cells. CTL indicates only detected in untreated cells. – indicates not detected in indicated donor sample
ID Gene Description Donor
4 69 74 140 150
(A)
Q9H6X2 ANTXR1 Anthrax toxin receptor 1 1.1 3.9 CTL 2.2 CTL
Q8IZU8 DSEL Dermatan-sulfate epimerase-like protein CTL – CTL – CTL
P17342 NPR3 Atrial natriuretic peptide receptor 3 5.2 1.3 CTL CTL CTL
Q14123 PDE1C Calcium/calmodulin-dependent 3′,5′-cyclic nucleotide phosphodiesterase 1C 1.1 6.2 CTL CTL 2.1
O00411 POLRMT DNA-directed RNA polymerase, mitochondrial CTL CTL 4.4 0.7 1.7
Q13885 TUBB2A Tubulin beta-2A chain – – 6.5 11.6 6.4
Q86Y38 XYLT1 Xylosyltransferase 1 3.0 CTL 3.4 CTL 1.3
(B)
Q9UPQ3 AGAP1 Arf-GAP with GTPase, ANK repeat and PH domain-containing protein 1 4.3 6.3 CTL 4.0 0.8
Q9ULJ7 ANKRD50 Ankyrin repeat domain-containing protein 50 1.8 1.0 5.5 3.8 3.3
Q6ZW76 ANKS3 Ankyrin repeat and SAM domain-containing protein 3 CTL CTL CTL 0.6 CTL
Q8NCL9 APCDD1L Protein APCDD1-like CTL 2.4 CTL 1.9 3.0
Q9BSF8 BTBD10 BTB/PoZ domain-containing protein 10 CTL CTL CTL CTL CTL
Q8N5S9 CAMKK1 Calcium/calmodulin-dependent protein kinase kinase 1 CTL CTL 0.8 3.9 CTL
P49674 CSNK1E Casein kinase I isoform epsilon 4.2 6.9 1.4 CTL 5.3
Q9Y6M4 CSNK1G3 Casein kinase I isoform gamma-3 CTL CTL 1.1 CTL CTL
P39880 CUX1 Homeobox protein cut-like 1 1.1 CTL CTL 13.7 CTL
Q9H8V3 ECT2 Protein ECT2 CTL CTL 1.6 3.7 1.6
O95864 FADS2 Fatty acid desaturase 2 8.3 4.2 4.5 2.2 1.7
P02671 FGA Fibrinogen alpha chain CTL CTL 73.9 0.5 4.4
P02679 FGG Fibrinogen gamma chain 18.9 CTL 42.8 0.4 3.0
Q9NYZ3 GTSE1 G2 and S phase-expressed protein 1 CTL CTL CTL CTL 4.0
Q9Y2K7 KDM2A Lysine-specific demethylase 2A 5.4 0.3 1.1 CTL 6.4
Q9BVG8 KIFC3 Kinesin-like protein KIFC3 5.2 CTL CTL 1.5 CTL
Q659C4 LARP1B La-related protein 1B 3.5 CTL CTL CTL CTL
Q15013 MAD2L1BP MAD2L1-binding protein CTL CTL CTL 0.7 CTL
Q07864 POLE DNA polymerase epsilon catalytic subunit A CTL CTL 3.5 CTL 1.1
Q9P2K3 RCOR3 REST Corepressor 3 CTL CTL CTL CTL CTL
O15541 RNF113A RING finger protein 113A 1.2 1.2 CTL 18.5 4.8
Q9GZN7 ROGDI Protein rogdi homolog CTL 0.0 CTL CTL 1.8
Q99719 SEPT5 Septin-5 4.8 CTL CTL CTL 0.5
O95359 TACC2 Transforming acidic coiled-coil-containing protein 2 CTL CTL CTL CTL CTL
O15040 TECPR2 Tectonin beta-propeller repeat-containing protein 2 2.0 3.8 CTL 6.3 0.8
Q9P273 TENM3 Teneurin-3 3.9 CTL 3.2 2.1 1.3
Q86SZ2 TRAPPC6B Trafficking protein particle complex subunit 6B 0.3 – CTL CTL CTL
Q8IWR1 TRIM59 Tripartite motif-containing protein 59 CTL 3.2 4.0 CTL 0.9
Q9NPG3 UBN1 Ubinuclein-1 CTL CTL CTL CTL CTL
P62068 USP46 Ubiquitin carboxyl-terminal hydrolase 46 CTL CTL 1.5 CTL CTL
Q5ST30 VARS2 Valine-tRNA ligase, mitochondrial CTL CTL 1.9 3.5 CTL
Q9Y2K1 ZBTB1 Zinc finger and BTB domain-containing protein 1 0.5 CTL CTL 7.3 CTL
Notably fibrinogen which was downregulated following IFN-γ treatment was part of the network (Fig. 4).
Discussion
The intent of this study was to identify IFN-γ induced protein changes in bone marrow derived MSC as this could provide new insights regarding the immunoregu-latory capacities of these cells. Additionally protein compositional changes might also offer details of the dif-ferentiation associated biochemical processes involved in MSC licensing [26]. This made it feasible to perform a compositional comparison of cell pairs from dif-ferent donors using label free quantitation [31]. The results indicated that only a small subset of 210 proteins changed significantly. Approximately 2/3 of these pro-teins displayed IFN-γ induced directionality changes in their expression levels which were consistent with those described for their transcripts in the literature or databases. The remainder of the proteins have not been reported to be IFN-γ responsive. These changes could be associated with either innate immune responsiveness or with the differentiation of the MSC following IFN-γ exposure. There is also the possibility that these pro-teins are actually IFN-γ responsive but their expression is post-translationally regulated. This could go undetected as the current classification of interferon responsiveness is largely based on changes in transcript levels following treatment, emphasizing the importance of proteomic analysis.
A significant proportion of the proteins that changed in response to IFN-γ were functionally enriched in bio-logical processes involved in host defenses, especially those associated with antiviral responses. This was to be expected given the nature of the stimulus. Such responses included alterations in antigen processing,
presentation and loading (B2M, TAPs1&2, TAPBP), for-eign antigen and nucleic acid sensing (TLR3, OAS1/2/3), and ubiquitination/proteasome degradation pathways (TRIM 21, UBA7, USP18). There were also a number of other immunoregulatory proteins identified that have not previously been described in MSC cells (e.g. TAPBPL, THEMIS2, TNFAIP2).
Tapasin-related protein (TAPBPL) is a recently described regulator of peptide loading of Class I MHC complex [32–34]. This protein acts post TAP mediated loading of MHC to facilitate the exchange of high affin-ity peptides into the MHC. This provides a mechanism of assuring that MHC complexes remain charged with the peptide while expressed on the cell surface. This protein also provides an alternate mechanism of peptide loading of MHC I complexes, thus influencing the repertoire of peptides presented via class I molecules.
Thymocyte-selection-associated family member 2 (THEMIS2), also known as ICB1 (Induced on contact with basement membrane 1) increases the positive selec-tion of murine B1 cells and germinal center B cells by self and foreign antigens [35]. This is achieved by lower-ing the threshold for B cell activation by low-avidity, but not high-avidity, antigens [36]. However, themis2 is not required for murine B cell development, activation, or antibody responses [37]. THEMIS2 has also been shown to function as a signalling scaffold in the murine mac-rophage line, RAW 264.7, displaying pathway-specific effects on TLR responses. The over-expression of themis2 enhanced the LPS-induced production of TNFα, but did not impact levels of IL-6 or Cox-2, nor TNF production induced by ligands for TLR2 or TLR3 [35].
Tumor necrosis factor alpha-induced protein 2 (TNFAIP2, also known as M-Sec) is A 73 kDa cyto-solic protein that can also be induced by TNF α [38]. TNF α stimulation of Hela cells over or under express-ing TNFAIP2/M-Sec leads respectively to reduced or enhanced levels of IL-8 in production. There was a direct correlation between poor outcomes in septic patients and single nucleotide polymorphisms in the TNFAIP2 promoter region which enhanced protein production [39]. These observations have led to the suggestion that TNFAIP2/M-Sec is an inhibitor of NF-κB activation. Functionally TNFAIP2/M-Sec is also essential for the formation of tunneling nanotubes (TNTs) [40]. TNTs are 50–200 nm diameter cellular protrusions that can connect cells up to of several cell diameters apart. These structures offer a mechanism for the transfer of small molecules as well as organelles and transport vesicles and they are of particular relevance to immune function. Dendritic cells and macrophages are among the few cell types that constitutively express TNFAIP2/M-Sec and they form TNT following antigen exposure. NK cells use
TNT as an alternate mechanism to the immune synapse for transfer of lytic granules to their targets.
The previous examples represent IFN-γ responsive proteins that might contribute to the immunoregulatory activities of MSC. Indeed many are proposed media-tors of MSC immunosuppressive activity (e.g. CD274, PDCD1LG2, ICAM1, IDO1, PTGES2) [2, 4]. How-ever there is an additional group of proteins of poten-tial immunological and immunoregulatory significance
that are not currently described as IFN-γ responsive (e.g. PTGS2, PTGIS, FAM20A, FAM 20C and LRRC32/ GARP).
Prostaglandin dependent mechanisms of MSC medi-ated immunosuppression have been described in a num-ber of systems [41–43]. Thus it was of note that IFN-γ treated cells produced increased levels of prostaglan-din G/H synthase 2 (PTGS2/COX-2), prostacyclin syn-thase (PTGIS) and prostaglandin E synsyn-thase (PTGES).
This could provide a mechanism for increased produc-tion of prostaglandin H2 and downstream prostenoids.
Although the inhibitory activity of PGE2 has been well
documented prostacyclin has also been shown to have potent immunoregulatory properties. Prostacyclin syn-thase which generates prostacyclin is expressed by fol-licular dendritic cells in germinal centres of lymphoid
Table 3 Membrane and secreted proteins with expression levels that were differentially influenced by IFN-γ treat-ment
Entry Gene TM SP RI*
Q9H6X2 ANTXR1 + + D
Q8NCL9 APCDD1L + + D
O00478 BTN3A3 + + I
Q5VU97 CACHD1 + + I
Q9NZQ7 CD274 + + I
Q8IZU8 DSEL + + D
P30504 HLA-C + + I
P20036 HLA-DPA1 + + I
P01903 HLA-DRA + + I
P13747 HLA-E + + I
P30511 HLA-F + + I
P05362 ICAM1 + + I
Q14392 LRRC32 + + I
P17342 NPR3 + + D
Q9Y5H3 PCDHGA10 + + I
Q9BQ51 PDCD1LG2 + + I
Q15262 PTPRK + + I
Q8WVN6 SECTM1 + + I
O15533 TAPBP + + I
Q9BX59 TAPBPL + + I
O15455 TLR3 + + I
Q9BXS4 TMEM59 + + I
P19320 VCAM1 + + I
Q5T3U5 ABCC10 + D
Q9ULC5 ACSL5 + I
Q6ICH7 ASPHD2 + I
O75110 ATP9A + I
O43286 B4GALT5 + I
Q10589 BST2 + I
P04233 CD74 + I
O15247 CLIC2 + I
O95864 FADS2 + D
Q14435 GALNT3 + I
P36269 GGT5 + I
Q01628 IFITM3 + I
O15162 PLSCR1 + I
O14684 PTGES + I
Q16647 PTGIS + I
Q9Y666 SLC12A7 + I
P22732 SLC2A5 + I
Q03518 TAP1 + I
Q03519 TAP2 + I
Q9P273 TENM3 + D
Q8IWR1 TRIM59 + I
O95183 VAMP5 + I
Q86Y07 VRK2 + I
Q86Y38 XYLT1 + D
O14791 APOL1 + I
Table 3 continued
Entry Gene TM SP RI*
P61769 B2 M + I
P09871 C1S + I
P08603 CFH + I
P25774 CTSS + I
Q07325 CXCL9 + I
Q96MK3 FAM20A + I
Q8IXL6 FAM20C + I
P02671 FGA + D
P02679 FGG + D
P13284 IFI30 + I
P01579 IFNG + I
Q16363 LAMA4 + I
Q08380 LGALS3BP + I
P35354 PTGS2 + I
P05120 SERPINB2 + I
P05155 SERPING1 + I
*Proteins with transmembrane regions (TM) or signal peptides (SP) that were significantly changed in Response to IFN-γ treatment (RI) are indicated as either increased (I) or decreased (D) in the column labelled RI
organs [44]. PTGIS inhibits T cell activation while delaying the onset of apoptosis in these cells. Follicular dendritic-like HK cells have been shown to enhance the antigen presenting capacity of B cells, in part by induc-tion of CD86 on the B cell surface. This effect is also observed with prostacyclin [3]. PTGIS contains an IFN-γ response element in 5′ region upstream of the transla-tional initiation site [45]. However responsiveness to IFN-γ has not previously been reported.
The FAM20A and FAM20C are members of a fam-ily of secreted proteins [46]. FAM20A is differentially expressed in developing hematopoietic cells and it has recently been shown to be required for the appropriate compartmental distribution of and secretion of FAM20C [47]. FAM20C is an extracellular kinase that recognizes a consensus S-x-E/S sequence as a phosphorylation tar-get. The broad specificity of the enzyme suggests that it may account for a large proportion of all extracellular phosphoproteins observed in humans [48]. Functionally the proteins targeted for phosphorylation are enriched in GO processes associated with adhesion, migration, inva-sion and wound healing. These observations have led to suggestions that FAM20C expression may contribute to the regulation of immune cell function and activity fol-lowing IFN-γ treatment.
Epithelial stromal interaction protein 1 (EPSTI1) is a 37 kDa protein that was first identified in human breast cancer cells [49]. It has recently been shown to possess anti-apoptotic activity in human breast cancer cells [50]. The molecule is broadly expressed with highest mes-sage levels in the small intestine, spleen, salivary glands, and testes. EPSTI1 is an interferon response gene that is inducible by Type I interferon and the λ interferon (IL-28A) [51]. However, there have not been reports of IFN-γ responsiveness.
Leucine rich repeats containing 32/glycoprotein A rep-etitions predominant (LRRC32/GARP) is a type I mem-brane protein that binds and presents latent TGF-β in an active state on the surface of platelets, Tregs and MSC [52–54]. The protein has been demonstrated on the sur-face of human and murine MSC [55]. Our studies extend this by demonstrating that IFN-γ treatment enhanced production of LRRC32/GARP in human MSC. Although LRRC32/GARP message levels are only modestly upreg-ulated by IFN-γ in other cell types, a recent publication demonstrated that protein levels were markedly increased murine macrophages following IFN-γ treatment.
The present studies demonstrate the value of direct measurements of protein expression patterns as many of the observed changes would apparently not have been predicted based on transcriptome analysis in other cell types. However, independent of these correlations it
appears that there are a large number of immunoreg-ulatory molecules that are altered following IFN-γ treatments and these may provide additional insights regarding the immunosuppressive mechanisms employed by licensed MSC. The identification of a significant num-ber of membrane proteins that were differentially regu-lated following interferon treatment raises the possibility that these may represent potentially novel candidates for monitoring stem cell responsiveness to IFN-γ. While it remains to be determined which, if any, of these proteins actually correlates with the immunoregulatory activities of the IFN-γ treated MSC, the current results do indi-cate that are a large number of yet unassessed candidates. Additionally the present study offers one of the most in depth analysis of the basal and IFN-γ induced proteomes of bone marrow derived human MSC to date. This information may provide a baseline for the comparative analysis of the responses of these cells to other licensing agents.
Authors’ contributions
QG and DW, OK, JW designed the experiments; QG respectively designed and performed the culture and FACS analysis. PE designed and performed the MS analysis. VS and JW analyzed the data. JW wrote the manuscript. All authors read and approved the final manuscript.
Author details
1 Manitoba Centre for Advanced Cell and Tissue Therapy, Department
of Pediatrics and Child Health, University of Manitoba, Winnipeg, MB, Canada.
2 Cellular Therapy Laboratory, CancerCare Manitoba, Winnipeg, MB, Canada. 3 Manitoba Centre for Proteomics and Systems Biology, Section of Biomedical
Proteomics, Department of Internal Medicine, Rady Faculty of Health Sciences, University of Manitoba and Health Sciences Centre, 799 John Buhler Research Centre, 715 McDermot Ave, Winnipeg, MB R3E 3P4, Canada. 4 Division of
Hae-matology/Oncology, Department of Paediatrics, The Hospital for Sick Children, University of Toronto, Toronto, ON, Canada.
Competing interests
The authors declare that they have no competing interests.
Availability of data and materials
Spectra (in MGF format) and protein quantitation results are available at the University of California, San Diego’s MassIVE archive (massive.ucsd.edu) under the Accession MSV000080890.
Ethics approval and consent to participate
This study was approved by University of Manitoba Health Research Ethics Board (Ethics Number H2012:061). All materials were obtained with informed consent.
Additional file
Funding
This study was supported by The Bihlers’ Professorship in Stem Cell Research (D.A.W.), Stem Cell Network Impact Grant (Grant Number 13/5226, D.A.W. and Q.G.), and MS Society of Canada Fellowship Award and Mindel & Tom Olenick Research Award in Immunology (Q.G.)
Publisher’s Note
Springer Nature remains neutral with regard to jurisdictional claims in pub-lished maps and institutional affiliations.
Received: 11 April 2017 Accepted: 28 June 2017
References
1. Wang Y, Chen F, Gu B, Chen G, Chang H, Wu D. Mesenchymal stromal cells as an adjuvant treatment for severe late-onset hemorrhagic cystitis after allogeneic hematopoietic stem cell transplantation. Acta Haematol. 2015;133(1):72–7.
2. Dazzi F, Krampera M. Mesenchymal stem cells and autoimmune diseases. Best Pract Res Clin Haematol. 2011;24(1):49–57.
3. Kim J, Kim YM, Jeoung DI, Choe J. Human follicular dendritic cells pro-mote the APC capability of B cells by enhancing CD86 expression levels. Cell Immunol. 2012;273(2):109–14.
4. Mariani E, Facchini A. Clinical applications and biosafety of human adult mesenchymal stem cells. Curr Pharm Des. 2012;18(13):1821–45. 5. Chinnadurai R, Copland IB, Patel SR, Galipeau J. IDO-independent
suppression of T cell effector function by IFN-gamma-licensed human mesenchymal stromal cells. J Immunol. 2014;192(4):1491–501. 6. Francois M, Romieu-Mourez R, Li M, Galipeau J. Human MSC
suppres-sion correlates with cytokine induction of indoleamine 2,3-dioxy-genase and bystander M2 macrophage differentiation. Mol Ther. 2012;20(1):187–95.
7. Curti A, Trabanelli S, Salvestrini V, Baccarani M, Lemoli RM. The role of indoleamine 2,3-dioxygenase in the induction of immune tolerance: focus on hematology. Blood. 2009;113(11):2394–401.
8. Shi Y, Hu G, Su J, Li W, Chen Q, Shou P, Xu C, Chen X, Huang Y, Zhu Z, et al. Mesenchymal stem cells: a new strategy for immunosuppression and tissue repair. Cell Res. 2010;20(5):510–8.
9. Duffy MM, Ritter T, Ceredig R, Griffin MD. Mesenchymal stem cell effects on T-cell effector pathways. Stem Cell Res Ther. 2011;2(4):34.
10. Liu YL, Wang YD, Zhuang F, Xian SL, Fang JY, Su W, Zhang W. Immuno-suppression effects of bone marrow mesenchymal stem cells on renal interstitial injury in rats with unilateral ureteral obstruction. Cell Immunol. 2012;276(1–2):144–52.
11. Stagg J, Galipeau J. Mechanisms of immune modulation by mes-enchymal stromal cells and clinical translation. Curr Mol Med. 2013;13(5):856–67.
12. Chinnadurai R, Copland IB, Garcia MA, Petersen CT, Lewis CN, Waller EK, Kirk AD, Galipeau J. Cryopreserved mesenchymal stromal cells are susceptible to T-cell mediated apoptosis which is partly rescued by IFNgamma licensing. Stem Cells. 2016;34(9):2429–42.
13. Krampera M, Galipeau J, Shi Y, Tarte K, Sensebe L. Therapy MSCCotISfC: immunological characterization of multipotent mesenchymal stromal cells—The International Society for Cellular Therapy (ISCT) working proposal. Cytotherapy. 2013;15(9):1054–61.
14. Sivanathan KN, Rojas-Canales DM, Hope CM, Krishnan R, Carroll RP, Gron-thos S, Grey ST, Coates PT. Interleukin-17A-induced human mesenchymal stem cells are superior modulators of immunological function. Stem Cells. 2015;33(9):2850–63.
15. Waterman RS, Tomchuck SL, Henkle SL, Betancourt AM. A new mesen-chymal stem cell (MSC) paradigm: polarization into a pro-inflammatory MSC1 or an Immunosuppressive MSC2 phenotype. PLoS ONE. 2010;5(4):e10088.
16. Billing AM, Ben Hamidane H, Dib SS, Cotton RJ, Bhagwat AM, Kumar P, Hayat S, Yousri NA, Goswami N, Suhre K, et al. Comprehensive transcrip-tomic and proteomic characterization of human mesenchymal stem cells reveals source specific cellular markers. Sci Rep. 2016;6:21507.
17. Jeon OH, Panicker LM, Lu Q, Chae JJ, Feldman RA, Elisseeff JH. Human iPSC-derived osteoblasts and osteoclasts together promote bone regen-eration in 3D biomaterials. Sci Rep. 2016;6:26761.
18. Anjo SI, Lourenco AS, Melo MN, Santa C, Manadas B. Unraveling mesen-chymal stem cells’ dynamic secretome through nontargeted proteomics profiling. Methods Mol Biol. 2016;1416:521–49.
19. Assoni A, Coatti G, Valadares MC, Beccari M, Gomes J, Pelatti M, Mitne-Neto M, Carvalho VM, Zatz M. different donors mesenchymal stromal cells secretomes reveal heterogeneous profile of relevance for therapeutic use. Stem Cells Dev. 2017;26(3):206–14.
20. Lavoie JR, Rosu-Myles M. Uncovering the secretes of mesenchymal stem cells. Biochimie. 2013;95(12):2212–21.
21. Hanley PJ, Mei Z, da Graca Cabreira-Hansen M, Klis M, Li W, Zhao Y, Durett AG, Zheng X, Wang Y, Gee AP, et al. Manufacturing mesenchymal stromal cells for phase I clinical trials. Cytotherapy. 2013;15(4):416–22.
22. Romieu-Mourez R, Francois M, Boivin MN, Stagg J, Galipeau J. Regulation of MHC class II expression and antigen processing in murine and human mesenchymal stromal cells by IFN-gamma, TGF-beta, and cell density. J Immunol. 2007;179(3):1549–58.
23. Dominici M, Le Blanc K, Mueller I, Slaper-Cortenbach I, Marini F, Krause D, Deans R, Keating A, Prockop D, Horwitz E. Minimal criteria for defining multipotent mesenchymal stromal cells. The International Society for Cellular Therapy position statement. Cytotherapy. 2006;8(4):315–7. 24. Trojahn Kolle SF, Oliveri RS, Glovinski PV, Kirchhoff M, Mathiasen AB,
Elberg JJ, Andersen PS, Drzewiecki KT, Fischer-Nielsen A. Pooled human platelet lysate versus fetal bovine serum-investigating the prolifera-tion rate, chromosome stability and angiogenic potential of human adipose tissue-derived stem cells intended for clinical use. Cytotherapy. 2013;15(9):1086–97.
25. Wisniewski JR, Zougman A, Nagaraj N, Mann M. Universal sample prepa-ration method for proteome analysis. Nat Methods. 2009;6(5):359–62. 26. Dwivedi RC, Spicer V, Harder M, Antonovici M, Ens W, Standing KG,
Wilkins JA, Krokhin OV. Practical implementation of 2D HPLC scheme with accurate peptide retention prediction in both dimensions for high-throughput bottom-up proteomics. Anal Chem. 2008;80(18):7036–42. 27. Bowden P, Beavis R, Marshall J. Tandem mass spectrometry of human
tryptic blood peptides calculated by a statistical algorithm and captured by a relational database with exploration by a general statistical analysis system. J Proteomics. 2009;73(1):103–11.
28. Szklarczyk D, Morris JH, Cook H, Kuhn M, Wyder S, Simonovic M, Santos A, Doncheva NT, Roth A, Bork P, et al. The STRING database in 2017: quality-controlled protein–protein association networks, made broadly accessible. Nucleic Acids Res. 2017;45(D1):D362–8.
29. Rusinova I, Forster S, Yu S, Kannan A, Masse M, Cumming H, Chapman R, Hertzog PJ. Interferome v2.0: an updated database of annotated interferon-regulated genes. Nucleic Acids Res. 2013;41(Database issue):D1040–6.
30. The UniProt C. UniProt: the universal protein knowledgebase. Nucleic Acids Res. 2017;45(D1):D158–69.
31. McQueen P, Spicer V, Schellenberg J, Krokhin O, Sparling R, Levin D, Wilkins JA. Whole cell, label free protein quantitation with data independent acquisition: quantitation at the MS2 level. Proteomics. 2015;15(1):16–24.
32. Boyle LH, Hermann C, Boname JM, Porter KM, Patel PA, Burr ML, Duncan LM, Harbour ME, Rhodes DA, Skjodt K, et al. Tapasin-related protein TAPBPR is an additional component of the MHC class I presentation pathway. Proc Natl Acad Sci USA. 2013;110(9):3465–70.
33. Hermann C, Trowsdale J, Boyle LH. TAPBPR: a new player in the MHC class I presentation pathway. Tissue Antigens. 2015;85(3):155–66.
34. Hermann C, van Hateren A, Trautwein N, Neerincx A, Duriez PJ, Stevanovic S, Trowsdale J, Deane JE, Elliott T, Boyle LH. TAPBPR alters MHC class I peptide presentation by functioning as a peptide exchange catalyst. Elife. 2015;4:e09617.
35. Peirce MJ, Brook M, Morrice N, Snelgrove R, Begum S, Lanfrancotti A, Notley C, Hussell T, Cope AP, Wait R. Themis2/ICB1 is a signaling scaffold that selectively regulates macrophage Toll-like receptor signaling and cytokine production. PLoS ONE. 2010;5(7):e11465.
• We accept pre-submission inquiries
• Our selector tool helps you to find the most relevant journal
• We provide round the clock customer support
• Convenient online submission
• Thorough peer review
• Inclusion in PubMed and all major indexing services
• Maximum visibility for your research
Submit your manuscript at www.biomedcentral.com/submit
Submit your next manuscript to BioMed Central
and we will help you at every step:
37. Hartweger H, Schweighoffer E, Davidson S, Peirce MJ, Wack A, Tybulewicz VL. Themis2 is not required for B cell development, activation, and anti-body responses. J Immunol. 2014;193(2):700–7.
38. Wolf FW, Sarma V, Seldin M, Drake S, Suchard SJ, Shao H, O’Shea KS, Dixit VM. B94, a primary response gene inducible by tumor necrosis factor-alpha, is expressed in developing hematopoietic tissues and the sperm acrosome. J Biol Chem. 1994;269(5):3633–40.
39. Thair SA, Topchiy E, Boyd JH, Cirstea M, Wang C, Nakada TA, Fjell CD, Wurfel M, Russell JA, Walley KR. TNFAIP2 inhibits early TNFalpha-induced NF-x03BA;B signaling and decreases survival in septic shock patients. J Innate Immun. 2016;8(1):57–66.
40. Kimura S, Hase K, Ohno H. Tunneling nanotubes: emerging view of their molecular components and formation mechanisms. Exp Cell Res. 2012;318(14):1699–706.
41. Duffy MM, Pindjakova J, Hanley SA, McCarthy C, Weidhofer GA, Sweeney EM, English K, Shaw G, Murphy JM, Barry FP, et al. Mesenchymal stem cell inhibition of T-helper 17 cell- differentiation is triggered by cell-cell contact and mediated by prostaglandin E2 via the EP4 receptor. Eur J Immunol. 2011;41(10):2840–51.
42. Noone C, Kihm A, English K, O’Dea S, Mahon BP. IFN-gamma stimu-lated human umbilical-tissue-derived cells potently suppress NK activation and resist NK-mediated cytotoxicity in vitro. Stem Cells Dev. 2013;22(22):3003–14.
43. Szabo E, Fajka-Boja R, Kriston-Pal E, Hornung A, Makra I, Kudlik G, Uher F, Katona RL, Monostori E, Czibula A. Licensing by inflammatory cytokines abolishes heterogeneity of immunosuppressive function of mesenchy-mal stem cell population. Stem Cells Dev. 2015;24(18):2171–80. 44. Lee IY, Ko EM, Kim SH, Jeoung DI, Choe J. Human follicular dendritic
cells express prostacyclin synthase: a novel mechanism to control T cell numbers in the germinal center. J Immunol. 2005;175(3):1658–64. 45. Yokoyama C, Yabuki T, Inoue H, Tone Y, Hara S, Hatae T, Nagata M,
Taka-hashi EI, Tanabe T. Human gene encoding prostacyclin synthase (PTGIS): genomic organization, chromosomal localization, and promoter activity. Genomics. 1996;36(2):296–304.
46. Nalbant D, Youn H, Nalbant SI, Sharma S, Cobos E, Beale EG, Du Y, Wil-liams SC. FAM20: an evolutionarily conserved family of secreted proteins expressed in hematopoietic cells. BMC Genom. 2005;6:11.
47. Ohyama Y, Lin JH, Govitvattana N, Lin IP, Venkitapathi S, Alamoudi A, Husein D, An C, Hotta H, Kaku M, et al. FAM20A binds to and regulates FAM20C localization. Sci Rep. 2016;6:27784.
48. Tagliabracci VS, Wiley SE, Guo X, Kinch LN, Durrant E, Wen J, Xiao J, Cui J, Nguyen KB, Engel JL, et al. A single kinase generates the majority of the secreted phosphoproteome. Cell. 2015;161(7):1619–32.
49. Nielsen HL, Ronnov-Jessen L, Villadsen R, Petersen OW. Identification of EPSTI1, a novel gene induced by epithelial-stromal interaction in human breast cancer. Genomics. 2002;79(5):703–10.
50. Capdevila-Busquets E, Badiola N, Arroyo R, Alcalde V, Soler-Lopez M, Aloy P. Breast cancer genes PSMC3IP and EPSTI1 play a role in apoptosis regulation. PLoS ONE. 2015;10(1):e0115352.
51. Meng X, Yang D, Yu R, Zhu H. EPSTI1 is involved in IL-28A-mediated inhibi-tion of HCV infecinhibi-tion. Mediators Inflamm. 2015;2015:716315.
52. Andersson J, Tran DQ, Pesu M, Davidson TS, Ramsey H, O’Shea JJ, Shevach EM. CD4+ FoxP3+ regulatory T cells confer infectious tolerance in a TGF-beta-dependent manner. J Exp Med. 2008;205(9):1975–81. 53. Edwards JP, Hand TW, Morais da Fonseca D, Glass DD, Belkaid Y, Shevach
EM. The GARP/Latent TGF-beta1 complex on Treg cells modulates the induction of peripherally derived Treg cells during oral tolerance. Eur J Immunol. 2016;46(6):1480–9.
54. Fridrich S, Hahn SA, Linzmaier M, Felten M, Zwarg J, Lennerz V, Tuetten-berg A, Stocker W. How soluble GARP enhances TGFbeta activation. PLoS ONE. 2016;11(4):e0153290.