Prediction of lateral force in an off-road tire using response
surface methodology (RSM)
Hamid Abdolmaleki, Ali Jafari
*, Hossein Mousazadeh, Ali Hajiahmad
(Department of Agricultural Machinery Engineering, College of Agriculture and Natural Resources, University of Tehran, Karaj, Iran)
Abstract: In this study, an in-situ Single Wheel Tester (iSWT) was used to investigate the effect of the most important
independent variables on the lateral force of a high lug agricultural tire. The variables include some soil parameters and tire characteristics. Response Surface Methodology (RSM) also was used to construct a design of experiment and propose the lateral force model as a function of seven variables (various combination treatments of soil characteristics and tire parameters). A total of 152 experimental tests were conducted to find the appropriate model. Reduced form of a quadratic model was selected to predict the tire lateral force (R2>0.9). The results showed that the side slip angle and the moisture content had
major and minimal effect on tire lateral force respectively. When all other variables were in their middle points, the 95% increase of the normal load would cause the 112% increment in the lateral force. Also, the difference between the lateral force when the moisture content is at minimum and maximum levels, is about 4%. Noteworthily, increasing the tire normal load, not only increases the maximum value of tire lateral force attainment, but also pushes the peak value of the lateral force to higher slip angles.
Keywords: response surface methodology, single wheel tester, side slip angle, normal load, drawbar pull, moisture content, tire
inflation pressure
Citation: Abdolmaleki,H., A. Jafari, H. Mousazadeh, A. Hajiahmad, and H. Goli. 2018. Prediction of lateral force in an
off-road tire using response surface methodology (RSM). Agricultural Engineering International: CIGR Journal, 20(2): 138–143.
1 Introduction
Prediction and modeling of unknown parameters in different scientific activities are always fascinating and intriguing for researchers. In the field of Terramechanics and off-road vehicles as engineering curriculums, many experiments are carried out to investigate different important parameters produce some response of interest, including motion resistance (Abdolmaleki et al., 2015), tire tractive performance (Goli et al., 2012), traction force (Elwaleed et al., 2006), side slip angle (Hajiahmad et al., 2014), lateral force (Armbruster and Kutzbach, 1991) and many others.
One of these attractive parameters is generally the lateral behavior of a vehicle and tractor. However, lateral behavior has attracted less attention compared to the other
Received date: 2017-11-10 Accepted date: 2018-06-04 *Corresponding author: Ali Jafari, PhD, Professor at
Department of Agricultural Machinery Engineering, Karaj, Iran. Email: [email protected]. Tel: +982632801011, Fax: +982632801011.
parameters due to highly complex physical phenomenon of interaction of tire with terrain, and also due to the existence of a number of measurement difficulties. The knowledge about lateral behavior and its considerable influences on turning, stability, handling, side slope operation and ride of off-road vehicles can also be used in computer simulations and vehicle control systems.
Tire lateral force is probably the principal parameter for the study of lateral behavior of a vehicle. When a force is exerted to a tire, with respect to the tire-plane, a lateral force will be developed at the tire-ground contact patch. In this case, the tire will move along a path at an angle α with the wheel plane (Figure 1), usually known as side slip angle (Wong, 2001).
driving force, slip, and side slip angle on the tire lateral force. He formed a simplified tire lateral force model as a linear function.
A little deeper study into lateral force delved by Armbruster and Kutzbach (1991) found that the lateral force was decreased as the tractive force increased, especially at higher slip angles. Furthermore, it has been investigated that the maximum lateral force was at a little negative tractive force, which was corresponding with small negative slippage of the wheel.
Tractive efficiency of a lunar tire towing dead weights over regolith for different vertical loads, rotational velocities and wheel forms is also discussed (Jiang et al., 2018). Also, they performed Distinct Element Method (DEM) simulations in terrestrial and extraterrestrial environments to verify the new proposed contact model.
Du Plessis and Venter (1993) measured the lateral force (for slip angles from 0° to 10°) for a tractor tire on different deformable surfaces and studied the interactions between side slip angle, lateral force and braking/traction coefficient for different wheel loads. The model proposed by Krick (1973) was unable to fit their collected data. Although they amended the developed model of Crolla and El-Razaz (1987) to predict more closely tire forces on soft surfaces, the calculated lateral forces for both high traction and braking coefficients were more than the measured values.
In addition to experimental approaches, finite element methods (FEM), empirical, and semi-empirical analyses are also used by researchers. As a semi-empirical approach, an enhanced tire model for off-road vehicle has been proposed by Senatore and Sandu (2011). The model they developed considers two types of soils and also accounts for rigid wheels and flexible tires. El-Sayegh et al. (2018) presented an improved tire-soil interaction model based on Finite Element Analysis (FEA) to predict the rolling resistance of an off-road truck tire (underiven type) over three different types of soils.
A thorough search of the relevant literature yielded no related article concerning the application of Response Surface Methodology (RSM) for predicting the side force of an off-road tire. Hence, the main aim of this experimental study is to predic the lateral force in an
off-road tire as a function of seven variables using RSM. The study evaluates various combination treatments of soil characteristics (cone index and moisture content) and tire parameters (tire inflation pressure, rotational speed, drawbar pull, normal load, and side slip angle).
2 Material and methods
2.1 Lateral force measurement
When a tire experiences side slip angle, a lateral side force will be developed on the tire contact patch. This force could be considered as a reaction force that prevents side slip when the wheel produces a side slip angle (Abe, 2009). In this study, the in-situ single wheel tester (ISWT) mentioned in Abdolmaleki et al. (2015) was used. To measure the tire lateral force, a mechanism was developed in which an S-beam load cell (load cell 3 in Figure 1) was coincided with the wheel axis. To prevent load cell cable from twisting when the tire is rotating, the load cell axis was surrounded by inner rings of two spherical roller bearings.
Figure 1 Tire lateral force measurement mechanism
2.2 Response surface methodology
model. The general form of the first-order model is
0 1
k j j j
y=β +
∑
= β x + ∈ (1)and the second-order model is
2
0 1 1
k k k
j j jj j ij i j j j i j
y=β +
∑
= β x +∑
= β x +∑∑
< β x x + ∈ (2)For fitting a response surface model to the collected data, the Design-Expert Software (http://www.statease. com/) 8.0.6.1 was used. The range of the independent variables and corresponding coded values are shown in Table 1.
Table 1 Factors affecting the tire lateral force in this study and their experimental values
Parameters symbol Unit Min. value (-1) Max. value (+1) Rotational speed N (rpm) 7 13 Cone index CI (kPa) 774 1268 Drawbar pull DP (N) 721 1071 Inflation pressure Pr (kPa) 100 200 Moisture content MC (%) 8 14 Normal load Fz (N) 877 1712
Side slip angle α (deg.) 0 20
The minimum, mean and maximum values of each variable were represented by –1, 0, and +1, respectively, mainly known as coded values.
2.3 Experimental conditions
The field tests were done on an agricultural soil by using a moldboard plough to a depth of 15-20 cm before a disk harrow to break up the clods and to make the field ready for experiments. The experimental field was evenly divided between nine regions that included three compacted treatment levels and three irrigated levels (Table 1). Cone index values of the soil were recorded for the 0 to 15 cm depths using soil cone penetrometer. Soil samples for determining moisture contents were taken at 0-15 cm depth. The texture, organic matter and bulk density of the soil are illustrated in Table 2.
Table 2 Some physical properties of the experimental field
Soil texture Clay, Silt, Sand (%) Organic matter (%) Dry bulk density(g cm-3)*
Clay loam 28, 42, 30 3 1.35 Note: * Dry bulk density of untrafficked soil for the 0-10 cm depth range.
The average and standard deviation of a set of 20 sample readings of cone index values for each treatment have been tabulated in Table 3.
A 5.00-12, 4-ply, high-lug agricultural tire, was used to perform data.
Table 3 Cone index values (kPa) at different moisture contents and compaction levels
Moisture content (% dry basis) Compaction level
8 11 14 Ploughed 774±31.4 788±26.5 821±29.7 Compacted using two passes 1012±36.1 1016±32.3 1026±41.0
Compacted using five passes 1219±25.9 1248±37.5 1268±30.8
3 Results and discussion
3.1 Model selection
A total of 152 tests were performed in order to find an appropriate model of lateral force. For selecting the best predicting model, a set of different polynomial models were compared (using Design Expert software). The second-order model was chosen with respect to a good trade-off between the highest coefficient of determination, and the lowest standard deviation, P-value and degrees of freedom. Finally, in order to reduce and optimize the number of candidate regressors, a stepwise regression algorithm, as a most widely used variable selection technique (Montgomery and Runger, 2014), was then applied, resulting in the reduced model (Table 4).
Table 4 Summary statistics of the reduced quadratic model
Standard
deviation Mean C.V. % R-Squared Adj R-Squared
Degrees of freedom
Sequential p-value
54.52 283.34 19.24 0.9013 0.8844 22 <0.0001
The fitted equation for the tire lateral force is represented in Equation (3), in which the coefficients are in the coded unit form.
Fy =+375.04+8.05*MC –18.35*CI +95.02*Fz +258*α– 20.06*n –32.67*DP +17.13*Pr+2.50*MC*Fz+ 7.97*MC*α –5.68*CI*Fz–18.12*CI*α–7.50*CI*Pr + 89.30*Fz*α–6.20*Fz*n +5.29* Fz * Pr –19.78*α*n – 29.07*α*DP +16.89*α*Pr+11.27*CI2 –29.66*F
z2 – 84.09* α2 –15.90*DP2 (3)
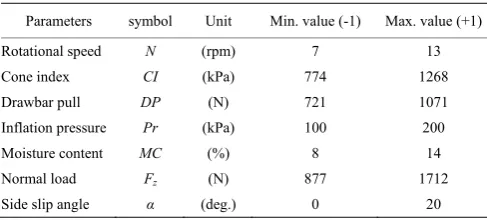
3.2 Perturbation plot
the response is sensitive to that factor. These influential factors are good choices for the axes on the surface or contour plots. The response trace plot for the lateral force is shown in Figure 2a. The vertical axis is the predicted
lateral force and the horizontal axis is the incremental change made in each factor. Moreover, the scatter plot of actual values of lateral force vs. predicted values using final model are displayed in Figure 2b.
a b
Figure 2 a) Perturbation plot, b) Predicted lateral force values versus actual ones
The strong nonlinear effects of the side slip angle and tire normal load on the lateral force are conspicuous (Figure 2a). As appreciated from the Figure 2a, lateral force increased with the increased side slip angle. It was absolutely clear that for small slip angles, the lateral force was linear, however, the rate of increasing the lateral force diminishes for greater side slip angle. In general, the lateral force remains constant or drops slightly when the side slip angle reaches a saturation level or critical value at which the tire begins sliding laterally on the ground/road (Jazar, 2008). For this off-road tire, the saturation point and maximum value are not yet reached at 20 degrees of side slip angle. For passenger car tires, the maximum lateral force may reach at a slip angle of about 18 degrees, while for racing car tires, the saturation point is approximately 6 degrees (Wong, 2001). After side slip angle, the next impressive parameter is normal load. The figure clearly indicated that lateral force increased with the increasing normal load. Tire lateral force is moderately affected by inflation pressure and drawbar pull. Additionally, it is perceived that the decrease of the inflation pressure led to reduced lateral force. The lateral force decreases gradually in inverse proportion to the amount of drawbar pull (Figure 3a and e). Assume a vehicle is turning and drawbar pull is applied to it. To generate the same lateral force value and proper yaw moment in comparing to non-existense of drawbar pull,
the driver must turn increasingly steering wheel to provide required side slip angle value.
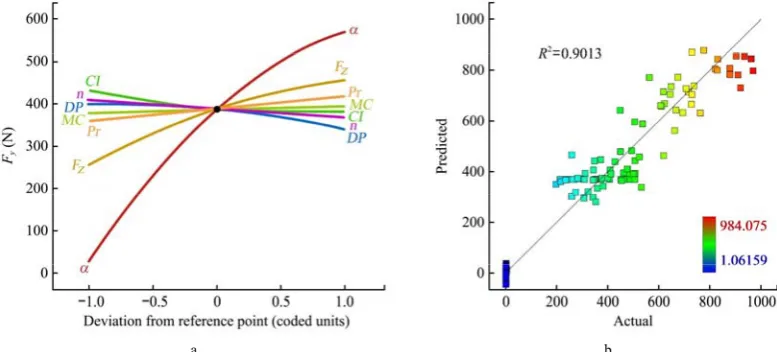
3.3 Surface plots
Figure 3a-f, the three-dimensional surfaces of the final extracted model of the tire lateral force were presented. Increasing the tire normal load, not only increased the maximum value of tire lateral force attainment, but also shifted the maximum of the lateral force to higher slip angles. On the other hand, at higher normal loads, the tire lateral force reaches its peak in a greater value of side slip angles (Figure 3b). It also can be found from Figure 3b that for a given side slip angle, the lateral force increases with an increase of the normal load. However, as mentioned by Wong (2001), the relationship between the lateral force and the normal load is nonlinear. When all other variables are in their middle points, increasing the normal load by 95% will cause the 112% increment in the lateral force.
Although Raheman and Singh (2004) found that increasing the tire inflation pressure resulted in the tire lateral force decrement. Also, it was revealed that increasing tire inflation pressure increased tire lateral force. Probably, this sharp disagreement between the results was due to the different types of experimental tested tires. The tire utilized in this study was agricultural high lug type and in driven mode, so it seemed, increasing tire lateral force with tire inflation pressure increment was due to tire sidewall stiffness increment.
When tire normal load and moisture content increase
(Figure 3b and c), the tire lugs stick to the ground and also on deformable surfaces, lug/tire sinkage is more noteworthy. Consequently, in this situation, the lateral force increases at a constant side slip angle.
From the Figure 3d, it can be seen that the rotational speed has almost no effect on the lateral force at small side slip angles, but has a more noticeable effect as side slip angles get larger. Increase of rotational speed contributes to the decrease of lateral force. Hence, in these cases and at higher velocities, to generate the same lateral force, the side slip angle must be increased.
a b c
d e f
Figure 3 Response surface plots for the reduced quadratic model
4 Conclusions
To sum up, the conclusions drawn from this study are as follows:
(1) All independent variables, including soil characteristics (cone index and moisture content) and tire parameters (tire inflation pressure, rotational speed, drawbar pull, normal load, and side slip angle) affect the tire lateral force.
(2) The tire lateral force was found as a complex function of seven independent variables, with degrees of
freedom of 22, using the reduced form of a quadratic model.
(3) Increasing drawbar pull and reducing tire inflation pressure demonstrates decrement in lateral force.
(4) The side slip angle and soil moisture content had major and minimal effects on tire lateral force respectively.
References
Abdolmaleki, H., A. Jafari, A. Tabatabaeifar, A. Hajiahmad, and H. Goli. 2015. Development and evaluation of an in-situ tire testing facility with variable side slip angles. Journal of Terramechanics, 59: 49–58.
Abe, M., 2009. Vehicle Handling Dynamics: Theory and Application. United Kingdom: Butterworth-Heinemann. Armbruster, K., and H. D. Kutzbach. 1991. Combined lateral and
longitudinal forces on driven angled tractor tyres. Journal of Terramechanics, 28(4): 331–338.
Crolla, D. A., and A. El-Razaz. 1987. A review of the combined lateral and longitudinal force generation of tyres on deformable surfaces. Journal of Terramechanics, 24(3): 199–225.
Du Plessis, H., and G. Venter. 1993. Soft surface lateral forces and force modelling for a tractor type. Journal of Terramechanics, 30(2): 101–110.
El-Sayegh, Z., M. El-Gindy, I. Johansson, and F. Öijer, 2018. Improved tire-soil interaction model using FEA-SPH simulation. Journal of Terramechanics, 78: 53–62.
Elwaleed, A. K., A. Yahya, M. Zohadie, D. Ahmad, and A. F. Kheiralla. 2006. Net traction ratio prediction for high-lug agricultural tyre. Journal of Terramechanics, 43(2): 119–139.. Goli, H., S. Minaee, A. Jafari, A. Keyhani, A. Borghaee, and A.
Hajiahmad. 2012. An instrumented drive axle to measure tire tractive performance. Journal of Terramechanics, 49(6):
309–314.
Hajiahmad, A., H. Goli, A. Jafari, A. Keyhani, H. Abdolmaleki. 2014. Side slip angle prediction model of an off-road tire on different terrains. Journal of Terramechanics, 56: 25–35. Jazar, R. N. 2008. Vehicle Dynamics: Theory and Applications.
Germany: Springer Verlag.
Jiang, J., Y. Dai, L. Cui, B. Xi. 2018. Experimental and DEM analyses on wheel-soil interaction. Journal of Terramechanics, 76: 15–28.
Krick, G. 1973. Behaviour of tyres driven in soft ground with side slip. Journal of Terramechanics, 9(4): 9–30.
Montgomery, D. C., and G. C. Runger. 2014. Applied Statistics and Probability for Engineers. Hoboken, NJ: John Wiley & Sons, Inc.
Myers, R. H., D. C. Montgomery, and C. M. Anderson-Cook. 2009. Response Surface Methodology: Process and Product Optimization Using Disigned Experiments, 3rd ed. Hoboken, N.J.: Wiley.
Raheman, H., and R. Singh. 2004. Steering forces on undriven tractor wheel. Journal of Terramechanics, 40(3): 161–178. Senatore, C., and C. Sandu. 2011. Off-road tire modeling and the
multi-pass effect for vehicle dynamics simulation. Journal of Terramechanics, 48(4): 265–276.
Wong, J. Y. 2001. Theory of Ground Vehicles. United States: Wiley-Interscience.
Nomenclature
symbol unit meaning symbol unit meaning
CI [kPa] Cone index value Rh [N] Horizontal surface reaction force
DP [N] Drawbar pull Rv [N] Vertical surface reaction force
FAT [N] The force acting on the load cell 4 measuring aligning torque Rx [N] Longitudinal reaction force applied to chrome shaft by the carrier
Fx [N] Longitudinal force measured by load cell 2 Ry [N] Lateral reaction force applied to chrome shaft by the carrier
Fy [N] Lateral force measured by load cell 3 S [%] Tire slippage
Fz [N] Wheel normal load x [m] Lever arm of lateral force
GT [N] Gross traction y [m] Lever arm of longitudinal force
MC [%] Moisture Content zAT [m] Normal distance between load cell 4 and center of chrome shaft
NT [N] Net traction zT [m] Normal distance between load cell 1 and center of axle
n [rpm] Tire rotational speed α [deg.] Side slip angle