R E S E A R C H
Open Access
Parallel developmental genetic features underlie
stickleback gill raker evolution
Andrew M Glazer, Phillip A Cleves, Priscilla A Erickson, Angela Y Lam and Craig T Miller
*Abstract
Background:Convergent evolution, the repeated evolution of similar phenotypes in independent lineages, provides natural replicates to study mechanisms of evolution. Cases of convergent evolution might have the same underlying developmental and genetic bases, implying that some evolutionary trajectories might be predictable. In a classic example of convergent evolution, most freshwater populations of threespine stickleback fish have independently evolved a reduction of gill raker number to adapt to novel diets. Gill rakers are a segmentally reiterated set of dermal bones important for fish feeding. A previous large quantitative trait locus (QTL) mapping study using a marine × freshwater F2 cross identified QTL on chromosomes 4 and 20 with large effects on evolved gill raker reduction. Results:By examining skeletal morphology in adult and developing sticklebacks, we find heritable marine/freshwater differences in gill raker number and spacing that are specified early in development. Using the expression of the
Ectodysplasin receptor(Edar) gene as a marker of raker primordia, we find that the differences are present before the budding of gill rakers occurs, suggesting an early change to a lateral inhibition process controlling raker primordia spacing. Through linkage mapping in F2 fish from crosses with three independently derived freshwater populations, we find in all three crosses QTL overlapping both previously identified QTL on chromosomes 4 and 20 that control raker number. These two QTL affect the early spacing of gill raker buds.
Conclusions:Collectively, these data demonstrate that parallel developmental genetic features underlie the
convergent evolution of gill raker reduction in freshwater sticklebacks, suggesting that even highly polygenic adaptive traits can have a predictable developmental genetic basis.
Keywords:Convergent evolution,Gasterosteus, Quantitative trait locus, Stickleback, Gill raker
Background
Convergent evolution, the repeated evolution of similar phenotypes in different lineages, provides evolutionary rep-licates to test for possible constraints on evolutionary tra-jectories. This repeated evolution of similar traits has been observed for a wide variety of morphological [1-4], phy-siological [5-9], and behavioral [10-12] traits. Numerous recent studies in a variety of microbes, plants, and animals have begun to address the extent to which convergent phenotypic evolution occurs via parallel genetic bases (reviewed in [13-16], but see [17]). One striking conclusion from these studies is that convergent evolution often occurs via parallel genetic mechanisms, with the same gen-omic regions, genes, and sometimes even alleles used for evolutionary change. This genetic parallelism of convergent
evolution has been observed in naturally [18-23] and arti-ficially [24-26] selected populations of animals, as well as in plants [27-30], and experimentally evolved microbes [31-33]. These common phenomena of convergent and parallel evolution suggest that some evolutionary trajec-tories are constrained and perhaps even predictable.
Why some evolved phenotypes appear to have a predict-able genetic basis remains a major unanswered question in biology, but could result from topology of genetic networks, constraints to developmental programs, constraints to available genetic variation, correlated response to selection on another trait, or even coincidence ([16,34-36], reviewed in [37]). One test for parallelism underlying convergent phenotypes is to compare how convergent traits arise dur-ing development, as distinct (non-parallel) developmental processes can generate convergent phenotypes [38]. The developmental processes affected by most evolved morpho-logical traits are in general poorly understood, although * Correspondence:[email protected]
Molecular and Cell Biology Department, University of California-Berkeley, Berkeley, CA 94720, USA
several recent studies have begun to examine the develop-mental trajectories of evolved traits [39-42].
The adaptive radiation of the threespine stickleback (Gasterosteus aculeatus) provides a powerful system to study convergent evolution (reviewed in [43]). Ancestral marine populations of sticklebacks have repeatedly co-lonized and adapted to countless freshwater lakes and streams throughout the Northern Hemisphere. Despite their evolved differences, ancestral marine and derived freshwater forms can be crossed, generating viable and fer-tile hybrid offspring, allowing for forward genetic crosses to map genomic regions controlling evolved change. Gen-etic studies from this system have revealed that the same genomic regions [44-47], genes [48], and even alleles [49,50] can be reused in freshwater adaptation. However, these previously studied traits (pelvic skeleton, lateral plates, and pigmentation) are each primarily controlled by a single large-effect locus that explains over half of the variance in the trait. One outstanding question in evolu-tionary biology is whether rules of traits with a relatively simple genetic basis apply to traits with a more polygenic basis, which are much more common in nature (reviewed in [51]). In particular, the degree to which highly polygenic traits evolve using a parallel genetic basis is largely un-known. Intriguingly, recent genome-wide genotyping and genome resequencing studies in sticklebacks have iden-tified striking re-use of many genomic variants during freshwater adaptation [52-54]. These results suggest that parallel genetic evolution is common in sticklebacks, per-haps through reuse of adaptive variants of both large and small effect [55,56].
A classic set of phenotypes studied by evolutionary biol-ogists are trophic traits, as many radiations (for example, Galapagos finches, African cichlids, threespine stickle-backs) display striking correlations between a population’s craniofacial pattern and the diet they eat [57-67]. In fish, the patterning of gill rakers, a segmentally reiterated set of dermal bones important for feeding, often correlates with a population’s diet composition and prey size ([68], reviewed in [69]). Gill raker number predicts feeding effi-ciency, with high gill raker counts correlating with better foraging on zooplankton [70,71], and low gill raker counts correlating with better foraging on benthos [72]. While marine sticklebacks primarily eat small zooplankton sus-pended in the water column, freshwater sticklebacks typic-ally eat larger prey items [73,74]. Correlated with this dietary shift, many freshwater stickleback populations have evolved a reduction in gill raker number. Gill raker reduc-tion has been documented in over 100 independently derived stickleback populations (and likely has evolved thousands of times) from three main ecological contrasts: marine versus freshwater, limnetic versus benthic zones within a lake, and lake versus adjoining inlet or outlet streams (for example, [73,75-80]). This repeated evolution
of gill raker reduction throughout the Northern Hemi-sphere suggests that gill raker number is under strong nat-ural selection.
Gill raker number in both marine and freshwater popu-lations is highly heritable [81-85]. Tests of phenotypic plasticity have revealed that gill raker number, unlike gill raker length, has no significant plastic response to a shifted diet [82]. Genetic studies in both sticklebacks [86] and whitefish [87,88] have revealed that gill raker number is a polygenic trait, controlled by multiple quantitative trait loci (QTL). In a large F2 cross between marine fish from Japan and benthic freshwater fish from Paxton Lake, British Columbia, we previously mapped gill raker number and spacing to QTL on 17 chromosomes [89]. Two large-effect QTL on chromosomes 4 and 20 explained 23% and 25% of the variance of ventral gill raker patterning, re-spectively. Each of the additional modifier QTL had much weaker effects, explaining 3% to 8% of the variance of gill raker number or spacing.
Despite the well-established gill raker patterning differ-ences in wild adult populations, little is known about the developmental basis of these patterning changes. Gill rakers appear to have genetic and developmental simi-larities to other vertebrate epithelial appendages, a broad class of periodically patterned organs that include hair, teeth, feathers, sweat glands, and scales (reviewed in [90,91]). These structures form embryonically from pla-codes - transient, regularly arrayed, epithelial thickenings that signal to underlying mesenchyme to make an epithe-lial organ (reviewed in [90]). Ectodysplasin(Eda) and the gene encoding the EDA receptor, Ectodysplasin receptor (Edar) play highly conserved roles in the development of placodes. Mice and humans with strong loss-of-function mutations in either gene have ectodermal dysplasia, with defects in teeth, hair, and sweat glands (reviewed in [92]). During development of epithelial appendages,Edaris typ-ically expressed in the placodes, flanked by a complemen-tary expression pattern of Eda around the non-placode forming part of the field [93-97]. Interestingly, in zebrafish, Eda and Edar are required for proper formation of gill rakers, as well as teeth and scales [98]. In cichlid larvae, Edaris expressed within developing gill rakers andEdais expressed between gill rakers [99]. This shared genetic re-quirement and complementary expression pattern ofEda andEdarsuggests that gill rakers and other epithelial ap-pendages develop by similar co-opted developmental gen-etic regulatory networks.
crosses between fish from a marine population and three independently derived freshwater populations.
Methods
Stickleback crosses and care
Three marine × freshwater F1 crosses were generated: (1) a wild-caught anadromous marine male from the Little Campbell River (British Columbia,‘LITC’) was crossed to a wild-caught female from Fishtrap Creek (Washington State;‘FTC’); (2) a male fish from Bear Paw Lake (Alaska, ‘BEPA’, lab-reared offspring of wild-caught parents) was crossed to a wild-caught female LITC fish; and (3) a male benthic fish from Paxton Lake (British Columbia;‘PAXB’, lab-reared offspring of wild-caught parents) was crossed to a wild-caught female LITC fish. Fish from each F1 cross were intercrossed to create F2 families. Adult F2 fish (n = 273, 384, and 418) were analyzed from seven, five, and 11 F2 families in the PAXB, FTC, and BEPA crosses, re-spectively. All lab-reared fish were raised at 18°C in 110 L (29 gallon) aquaria in a common brackish salinity (3.5 g/L Instant Ocean salt, 0.217 mL/L 10% sodium bicarbonate). Lab-reared fish were fed a common diet of live Artemia naupliiand frozenDaphniaas fry and juveniles, and fro-zen bloodworms and Mysis shrimp as adults. ‘Adult’F2s were raised to a minimum standard length of at least 20 mm (mean +/- standard deviation of 31.1 +/- 7.3, 38.1 +/- 5.6, and 39.8 +/- 9.0 mm in the PAXB/FTC/BEPA crosses, respectively). For the PAXB and FTC crosses, an early time point of F2s was taken at 19 to 20 days post fertilization (dpf) (n = 96 per cross); these datasets are re-ferred to as‘20 dpf’ or ‘early’ F2 time points. These fish had a total length (TL) average and standard deviation of 8.9 +/- 0.8 and 8.4 +/- 0.6 mm in the PAXB and FTC crosses, respectively. To generate fish for the time course analyses, lab-reared fish from LITC, FTC, and PAXB incrosses were raised as described above to various stages of development from 8 to 50 mm TL.
Bone and cartilage staining
For bone staining, fish were fixed for 1 to 2 days in 10% neutral buffered formalin or 3 to 5 days in 4% paraformal-dehyde in 1× PBS, washed with water overnight, stained overnight with 0.008% Alizarin Red S in 1% potassium hy-droxide, destained in water overnight, then lightly cleared in a 0.25% potassium hydroxide, 50% glycerol solution. For bone and cartilage staining of time course fish and 20 dpf F2s, fish were stained with an acid-free two-color Alizarin/Alcian protocol as described [100].
Gill raker phenotyping
Branchial skeletons were dissected out of fish and flat-mounted on a bridged coverslip. For all adults, time course, and 20 dpf F2s, each branchial skeleton was phe-notyped for row 1 or multiple rows of ventral and dorsal
gill raker number, counting only Alizarin-positive rakers whose center lay between the Alizarin-positive boundar-ies of the ceratobranchial (for ventral rakers) or epibran-chial (for dorsal rakers) gill arch bones (Additional file 1: Figure S1). When indicated, composite phenotypes such as the average of ventral rows 1 to 3 or rows 1 to 7 were determined and averages of left and right side rakers were taken. Genetic mapping in adults was performed with the average of rows 1 to 3 ventral or dorsal raker number, averaging the left and right side counts. For the early F2 time point, ventral row 1 raker counts and ven-tral row 1 to 7 spacing measurements were analyzed; rows 8 and 9 were not scored because these posterior rakers are last to develop and were not consistently present at this time point. Raker primordia phenotypes were measured by mounting the most anterior branchial arch on a bridged cover slip post in situ, then quantify-ing the number, spacquantify-ing, and width of distinct Edar-posi-tive puncta in row 1 buds (Additional file 2: Figure S2A). All gill raker spacing measurements were obtained by ac-quiring digital images of rakers on a Leica DM2500 or Leica M165 microscope, determining the x and y coordi-nates of the center of the base of each raker in imageJ [101], then calculating the average center-to-center spa-cing between each pair of adjacent rakers with a custom Python script (www.python.org). Raker width measure-ments were similarly calculated from digital images in imageJ, using the coordinates of the lateral and medial-most extent of Edar-positive cells within raker buds (for early Edar expressing foci) or Alizarin-positive edges of rakers (for adult rakers). Raker field size was calculated by measuring in imageJ the lateral-medial extent of Edar+ primordia with a segmented line that followed the path of raker primordia.
Genotyping
sequence (TGTAAAACGACGGCCAGT, all sequences listed are 5′to 3′) to the 5′of the forward primer and in-cluding a fluorescently labeled M13 primer in the reaction [105]. PCR product sizes were determined by agarose gel electrophoresis (non-fluorescent PCR products) or by frag-ment analysis (fluorescent PCR products) with a 3730xl DNA Analyzer and GeneMapper (Applied Biosystems). Fish sex was determined by PCR amplification with primers CATATTGCTGCTTGTGTGGAAG and GATCCTCCTC GTTCCTACAG and gel electrophoresis. These two primers amplify fragment sizes of 186 bp and 229 bp from the X and Y chromosomes, respectively, from a region tightly linked to the sex-determining region [106]. Linkage maps were calculated using JoinMap 4 [107] with regres-sion mapping and default settings.
QTL mapping
For QTL mapping, raker number or spacing was tested for an association with standard length (adult) or total length (early F2 time point) and sex by linear regression in R (www.r-project.org) and corrected for size and/or sex, when appropriate. When association with length and/or sex was significant (P<0.05), residuals were taken from a linear model with fish length and/or sex, then back-transformed to their original units. For adults, phe-notypes were back-transformed to values expected for a 40 mm standard length fish. For early F2s, phenotypes were back-transformed to values expected for an 8 mm total length fish. For the early raker primordia (Edar in situ hybridization) dataset, phenotypes were back-transformed to values expected for a 5.5 mm total length fish. Outliers greater than four standard deviations from the mean (<0.01% of all values) were removed.
Adult QTL mapping was performed in R/qtl [108,109]. LOD plots and percentage of variance explained were calculated with fitqtl and refineqtl, adjusting for the ef-fect of another QTL controlling the phenotype when ap-propriate (for example, adjusting for chromosome 20 genotype while mapping chromosome 4 QTL). For adult QTL mapping, significance thresholds (P <0.05) were calculated by performing 1,000 permutations of the ge-notypes on the two linkage groups being tested in each cross.
To generate plots of LOD score versus physical (genome assembly) position, the genomic coordinates of each marker were used, with two exceptions. First, the region on chromosome 4 from 17.82 Megabases (Mb) to 28.36 Mb was inverted to correct for the true orientation and positions of scaffolds 24 and 28 as previously de-scribed [110]. Second, since Scaffold 46 containing marker Chr20_204 maps to the ‘left’ end of chromosome 20 in all three crosses despite being on the ‘right’ end of the genome assembly (higher coordinate in the genome as-sembly), this marker was assigned an adjusted physical
position of 0 Mb. Cytogenetic data are consistent with Scaffold 46 mapping to the left end of the chromosome (lower coordinate in the genome assembly) [111].
Other statistical analyses
For comparisons between lab-reared and wild fish, two-tailed t-tests were performed on raw or back-transformed phenotypes, when appropriate (see above). Best-fit curves for the raker number and spacing time course plots were calculated with theloess.smoothfunction in R with a span of 0.4. Dominance was calculated using the equation d/a [112], whereaequals the additive effect of one additional freshwater allele (that is, half the phenotypic difference be-tween the homozygous freshwater and homozygous mar-ine genotypic classes).dequals the dominance effect: the difference between the heterozygous phenotype and the midpoint between homozygous parental phenotypes. Pearson’s correlation coefficients were calculated from size and sex-adjusted (as appropriate, see above) raker number and spacing measurements in R.
In situhybridization
Lab-reared FTC and LITC embryos and fry were fixed with 4% paraformaldehyde in 1× PBS with 1% DMSO overnight at 4°C. Whole mount in situhybridization was performed essentially as described [113], with 5 to 10 min of bleaching in a 3% hydrogen peroxide, 0.5% potassium hydroxide solution and 10 min of 20 ug/mL Proteinase K treatment in PBSTween with 1% DMSO. Embryos were hybridized for >36 h with an Edar antisense probe or sense probe as a negative control.Edarprobes were gener-ated by amplifying a fragment of the sticklebackEdargene
using primers GCCGCTCGAGTGCCAGTGCAGAG
TATTCCA and GCCGTCTAGACAGCTGCTCGTTCT CTGATG from LITC whole fry cDNA, directionally clon-ing this fragment into pBluescript II SK + with XhoI and XbaI, linearizing this construct with XhoI, and transcrib-ing the antisense probe with T3 polymerase or lineariztranscrib-ing with XbaI and transcribing the sense probe with T7 poly-merase. After wholemount in situ, first branchial arches were dissected out, transferred to 33%, 66%, and 100% gly-cerol, mounted flat on a bridged coverslip, and imaged with a Leica DM2500 compound microscope.
Animal statement
California-Berkeley or Stanford University (protocol num-ber R330 and 13834).
Results
Heritable evolution of differences in gill raker pattern in three freshwater populations
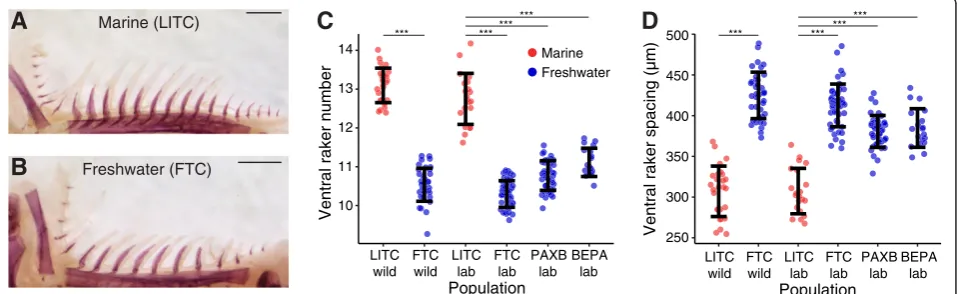
To test whether multiple freshwater populations have evolved a heritable change in gill raker number and spa-cing, we compared skeletal morphology in marine and freshwater wild and lab-reared fish. Stickleback gill rakers were present in nine rows along the anterior-posterior axis, protruding anteriorly (odd rows) and posteriorly (even rows) from the five branchial arches (Additional file 1: Figure S1A). They were also present in both ventral and dorsal domains (overlaying the ceratobranchial and epi-branchial bones, respectively; Additional file 1: Figure S1B). We first compared gill rakers from adult wild and lab-reared fish from the anadromous marine population from the Little Campbell River (LITC) in British Columbia to the Fishtrap Creek (FTC) freshwater population from Washington State (Figure 1A, B). These populations were previously described as having high and low gill raker counts, respectively, in the wild [76,83]. We observed highly significant differences in ventral gill raker number and spacing between marine LITC and freshwater FTC fish for both wild and lab-reared fish (P<10-10) for each comparison by Tukey’s HSD test; Figure 1C, D, Additional file 4: Figure S3). In lab-reared fish, mean LITC raker number was 41% higher than FTC, with a concomitant 40% increase in mean FTC raker spacing compared to LITC (measured from center to center, Additional file 1: Figure S1B). Next we examined lab-reared fish from two additional freshwater populations: BEPA and benthic fish
from PAXB. PAXB wild and lab-reared fish have been pre-viously characterized as low-rakered [82,114]. Lab-reared BEPA fish have also been described as low-rakered [55]. As with FTC, we also observed highly significant differ-ences between marine LITC and freshwater PAXB and BEPA lab-reared fish for both ventral raker number and spacing (P <10-10 for each comparison by Tukey’s HSD test; Figure 1C, D). Across the lab-reared and wild datasets ventral row 1 raker number and spacing were generally moderately anti-correlated (Additional file 5: Figure S4). These data show that relative to ancestral marine fish, fish from these three derived freshwater populations have con-vergently evolved a heritable decrease in adult gill raker number and increase in gill raker spacing.
Early developmental difference in marine/freshwater gill raker spacing
Although gill raker development has not been well stud-ied, development of many other epithelial appendages involves a reaction-diffusion system of activators and in-hibitors that control the regular size and spacing of pla-codes [91,115], reviewed in [116,117]. Therefore, we hypothesized that during gill raker development, fresh-water fish have evolved differences in lateral inhibition, a developmental process where cells inhibit other nearby cells from adopting their same fate. The altered lateral inhibition hypothesis predicts that the raker primordia are spaced differently at the time of their first appear-ance, and that these spacing differences are maintained to adulthood. To test this hypothesis, we examined lab-reared fish from the LITC marine and FTC and PAXB freshwater populations. Fish from all three populations were raised to various stages of development and stained
250 300 350 400 450 500
Ventral raker spacing (µm)
A
B
Marine (LITC)
Freshwater (FTC)
Ventral raker number 10
11 12 13 14
LITC wild
FTC wild
LITC lab
FTC lab
PAXB lab
BEPA lab
Population
LITC wild
FTC wild
LITC lab
FTC lab
PAXB lab
BEPA lab
Population
D
C
*** *** *** *** *** ******
***
Freshwater Marine
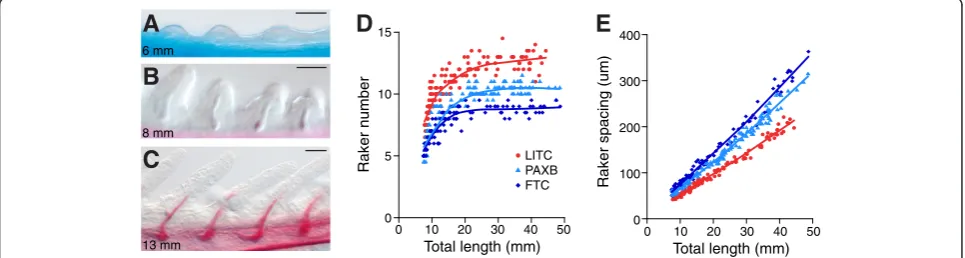
for cartilage and bone. Gill rakers were first apparent in approximately 6 mm total length (TL) fry as non-ossified buds of soft tissue that protruded from the ventral gill-bearing (branchial) arches (Figure 2A). As development proceeded, these buds grew outwards and dermal bone os-sified inside the buds (Figure 2B, C). In all three popula-tions, the number of ventral rakers in the anterior-most row (row 1) was largely fixed by the 20 mm total length stage. From the earliest point of raker ossification until adulthood, we observed consistent marine-freshwater dif-ferences in gill raker number (Figure 2D). Row 1 inter-raker spacing increased approximately linearly as the fish grew and was also consistently different between marine and freshwater fish throughout development, with fresh-water fish having a larger distance between their rakers (Figure 2E). Throughout development, FTC fish had fewer gill rakers and larger inter-raker spacing than PAXB (Figure 1C, D, Figure 2D, E), but both freshwater popu-lations had fewer, more widely-spaced rakers than marine LITC fish from the earliest stage of the time courses (P<0.001, Tukey’s HSD test of pre-15 mm TL fish). These results establish that evolved reductions in gill raker num-ber in two independently derived freshwater populations arise mainly through a parallel early developmental in-crease in freshwater inter-raker spacing.
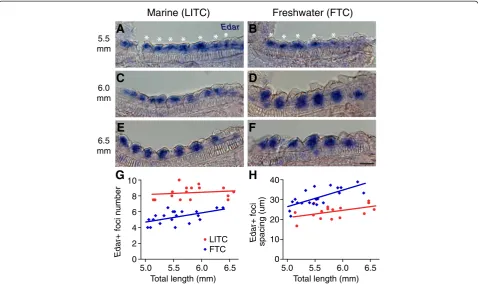
If stickleback freshwater raker reduction were due to an altered lateral inhibition process, the spacing of presump-tive gill rakers would differ between marine and freshwater stickleback from the first point of specification, even be-fore the morphological process of budding actually occurs. Therefore, we attempted to detect pre-budded gill rakers byin situhybridization ofEctodysplasin receptor(Edar), a gene required for gill raker formation in zebrafish [98] and a marker of developing gill rakers in cichlids [99]. In early-stage (approximately 5.5 mm TL) branchial arches before rakers were visibly budded, Edar was detected broadly throughout pharyngeal endodermal epithelia, but appeared to have increased expression in periodic clusters
of cells, which we interpreted as specified, pre-budded raker primordia (Figure 3A, B). We did not detect any spe-cific staining pattern using a control Edar sense probe (data not shown). As gill rakers began to bud, Edar ex-pression in the buds remained strong, in contrast to the inter-raker expression domains, which lost Edar expres-sion (Figure 3C, F). From the earliest stage that we could detectEdar-positive gill raker primordia, we saw a signifi-cant difference in both the number of primordia and the spacing between primordia in LITC marine and FTC freshwater fish (P<0.001, two-tailed t-test, Figure 3G, H). After adjusting for fish size, marine fish had a 45% in-crease (P <0.001) in meanEdar+ foci number compared to freshwater fish (Additional file 2: Figure S2B). There was a concomitant 32% increase (P<0.001) in mean foci spacing in freshwater fish, strongly supporting altered lat-eral inhibition as a major factor contributing to primordia number differences (Additional file 2: Figure S2C). How-ever, marine fry also had a 15% increase (P= 0.007) in field size (the total length of the field containingEdar+ primor-dia) compared to freshwater fish, suggesting that raker primordia field size differences also exist between marine and freshwater fish (Additional file 2: Figure S2D). Fresh-water fry also had slightly wider Edar +primordia (14% increase,P= 0.03, Additional file 2: Figure S2E); however there was no significant difference between FTC and LITC row 1 raker width in adults (P= 0.37, Additional file 6: Figure S5).
Parallel genetic and developmental effects of QTL on chromosomes 4 and 20
In a large F2 cross between Japanese marine and Paxton benthic freshwater fish, we previously mapped gill raker number to QTL on 17 chromosomes including the two largest-effect QTL on chromosomes 4 and 20 [89]. To test the hypothesis that parallel reduction of gill raker number in multiple independently derived freshwater populations involved QTL on chromosomes 4 and 20,
0 10 20 30 40 50 0
100 200 300 400 15
10
5
0
0 10 20 30 40 50 LITC PAXB FTC
Raker number
Raker spacing (um)
Total length (mm) Total length (mm)
E
D
A
C
B
8 mm
13 mm 6 mm
we raised three large F2 crosses (n = 273, 384, and 418 fish) between PAXB, FTC, or BEPA grandparental fresh-water fish each crossed to grandparental marine LITC fish. In each cross, we phenotyped gill raker number in each F2 fish. We also identified and genotyped a set of markers that were: (1) polymorphic in at least two of three crosses; and (2) spanned the previously identified QTL intervals and surrounding regions on chromo-somes 4 and 20 (5 to 8 markers per chromosome per cross; Additional file 3: Table S1 and Additional file 7: Table S2). We found high correlations between the num-ber of ventral gill rakers in different rows (Additional file 5: Figure S4); therefore we phenotyped rows 1 to 3 in the entire set of F2s. Strikingly, we detected QTL with strong effects on gill raker number on chromosomes 4 and 20 in all three crosses (percent variance explained of 10% to 21% and 10% to 22% for chromosomes 4 and 20, respectively; Figure 4, Table 1). Furthermore, the localization of the two QTL overlapped in all three crosses (Additional file 8: Table S3 and Additional file 9: Figure S6), and highly co-localized with the originally reported chromosome 4 and 20 gill raker QTL in each cross [89]. The peak marker of the chromosome 4 QTL in the PAXB cross was Chr4_152, which was also the peak marker in the FTC cross (Figure 4A). In the BEPA
cross, the peak marker of the chromosome 4 QTL was Chr4_131, a marker tightly linked (only 3.3 cM away, Additional file 7: Table S2) to Chr4_152. Although the BEPA peak marker was different, there was a high degree of overlap between the 1.5 LOD intervals (an approximate 95% confidence interval [118]) of the chromosome 4 QTL in the BEPA cross and the PAXB and FTC crosses (Additional file 8: Table S3). The peak marker of the chromosome 20 QTL in the PAXB cross was Stn216, which was also the peak marker in the BEPA cross (Figure 4C). In the FTC cross, the peak marker was Stn212, 0.4 cM away (Additional file 7: Table S2) from Stn216 in this cross, having a peak LOD only 0.4 LOD units higher than Stn216 (Figure 4C). Thus, raker number mapped to largely overlapping genomic regions within chromosomes 4 and 20 in all three crosses.
To further test whether the two raker number QTL have parallel genetic features, we asked whether the QTL had similar properties of additivity and epistasis in each cross. In all three crosses, the chromosome 4 and 20 gill raker QTL had additive genetic effects with dominance values between -0.30 and 0.23 (dominances of -1, 0, or 1 re-present a perfectly recessive, additive, or dominant effect, respectively, of the freshwater allele; Additional file 8: Table S3, Figure 4B, D). Furthermore, in each cross, there 0
2 4 6 8 10
Edar
+ foci
0 10 20 30 40
5.0 5.5 6.0 6.5 5.0 5.5 6.0 6.5
Edar+
foci number
Total length (mm) Total length (mm)
6.5 mm 5.5 mm
6.0 mm
Freshwater (FTC) Marine (LITC)
C
A
B
H
F
D
E
G
LITC FTC
Edar
spacing (um)
Figure 3Marine/freshwater gill raker spacing differences are specified before gill raker budding. (A-F)Edarexpression in developing ventral row 1 raker primordia in pre-bud(A-D)and early bud(E, F)stages (fish total length in millimeters shown at left) in Little Campbell marine (LITC)(A, C, E)and Fishtrap Creek freshwater (FTC). Scale bar = 25 um.(G, H)Significant differences in early bud stage ventral row 1 raker number
were no significant epistatic interactions between the chromosome 4 and 20 QTL (P= 0.18, 0.37, and 0.10 for the PAXB, FTC, and BEPA crosses, respectively, for a Chromosome 4 peak genotype × Chromosome 20 peak genotype interaction term in an ANOVA).
Next, we asked whether the two raker number QTL have parallel developmental features. Gill rakers are present in both ventral and dorsal domains (Figure 1A, B, Additional file 1: Figure S1), and both ventral and
dorsal gill raker numbers significantly differ between mar-ine (LITC) and freshwater (FTC/PAXB/BEPA) lab-reared fish (P <0.001 by Tukey’s HSD, Figure 1C, Additional file 10: Figure S7). Despite the differences in lab-reared phenotypes, in all three crosses the effect of the chromo-some 4 and 20 QTL was modular, with a much stronger effect on ventral raker number than dorsal raker number (Additional file 11: Table S4). Consistent with this find-ing, ventral and dorsal raker numbers had low or no
PAXB x LITC FTC x LITC BEPA x LITC
PAXB x LITC FTC x LITC BEPA x LITC
Genetic Position (cM)
Chromosome 4 Genotype
Genetic Position (cM)
LOD
Raker number
Raker number
LOD
B
D
C
A
10
5
0 10
5
0
8 16 24
0
8 12
4
20
0 40 0 20 40
40 20 0
20 30
0
0
*
*
0 4 8 12
30 20
0 10 00 20
10 20 30
*
*
*
10.8 11.3
10.2
11.8
10.6 11.2 10.8
11.4 11.8
10.8 11.3
10.2
11.8
10.8 11.3 10.8
11.4 11.8
Heterozygous Homozygous
freshwater Homozygous
marine
Chromosome 20 Genotype
Chr. 20 40
60 Chr.
4
*
correlation in the three crosses and the lab-reared and wild datasets (Additional file 5: Figure S4). Thus, both raker number QTL display multiple genetic and devel-opmental parallelisms in three independently derived freshwater populations.
Finally, we asked whether the chromosome 4 and 20 QTL affected gill rakers through a similar developmental mechanism in different freshwater populations. We hy-pothesized that early in development, the chromosome 4 and 20 QTL were largely responsible for the altered rela-tive strength of a lateral inhibition process controlling raker bud spacing. To test whether the chromosome 4 and 20 QTL directly controlled the early spacing of raker primordia, we raised 96 F2 fish from each of the PAXB × LITC and FTC × LITC crosses to an early stage of 19 to 20 dpf (approximately 8.5 mm total length), when early gill raker buds were still being specified. In both crosses, gill raker number and spacing were each controlled by both the chromosome 4 and 20 QTL at this early time point (Figure 5 and Additional file 12: Table S5; P <0.05, two-tailed t-test between marine and freshwater homozygous classes). Thus, the differences in early raker patterning between marine and freshwater fish are due in large part to the early action of the chromosome 4 and 20 gill raker QTL, which control the early spacing of gill raker primordia in independently de-rived freshwater populations.
Discussion
Parallel genetic features underlie stickleback gill raker reduction
For polygenic quantitative traits that have evolved con-vergently, QTL mapping is a powerful first test of a par-allel genetic architecture. While it is difficult to find the mutation(s) underlying these QTL, one prediction of parallel use of the same genes or genomic regions is that overlapping QTL would be found in multiple crosses from independently derived populations. A main finding of this study is that three independently derived fresh-water populations have evolved a reduction in gill raker
number involving QTL on chromosomes 4 and 20. Over-lapping QTL on these chromosomes from three inde-pendently derived freshwater populations could be due to either the same genes underlying the QTL in each fresh-water population, or different tightly linked genes in differ-ent populations. We parsimoniously hypothesize that the same genes in each population underlie the two QTL pri-marily because the QTL map to overlapping regions of chromosomes 4 and 20. Additional support of this hy-pothesis comes from several shared features of these QTL: (1) the QTL have similar genetic properties of additivity; (2) the QTL lack epistatic interactions with the other QTL; (3) the QTL have a modular effect with stronger ef-fects on ventral than dorsal gill rakers; and (4) the QTL affect the same developmental process of early raker prim-ordia spacing. Although multiple genetic changes underlie raker reduction in stickleback and whitefish genetic crosses [86-88], the parallel involvement of QTL on chro-mosomes 4 and 20 in three independently derived fresh-water stickleback populations suggests that the evolution of gill raker reduction is genetically constrained, and that properties of these two QTL bias them towards being se-lected to result in evolved changes in gill raker pattern. These properties could include the large additive pheno-typic effects and specific developmental effects on the spa-cing of early gill raker primordia that we show here, but also could include pleiotropic effects (or the lack thereof ) and/or standing allele frequencies in the oceanic popula-tion. The strongly additive effects of raker QTL in this study are consistent with previous findings of additivity for chromosome 4 and 20 gill raker QTL in a large mar-ine × PAXB F2 cross [89], and for row 1 total gill raker number in a marine × BEPA F1 cross [55].
Repeated use of the same genes during stickleback adaptive radiation has been observed in previous genetic studies of traits with a simple genetic architecture that evolve repeatedly from either standing variation [49,50] or repeated mutation [48]. However, to our knowledge, this study is the first to demonstrate multiple overlap-ping QTL controlling a convergently evolved trait in
Table 1 Location and effect size of adult raker number QTL
Cross Chr. LOD PVE Peak
marker
Phenotype mean +/- standard error
MM MF FF
PAXB 4 8.9 12.5 Chr4_152 11.54 +/- 0.08 11.2 +/- 0.05 10.97 +/- 0.06
FTC 4 20.7 20.7 Chr4_152 11.21 +/- 0.07 10.83 +/- 0.04 10.4 +/- 0.06
BEPA 4 11.2 9.5 Chr4_131 11.58 +/- 0.07 11.26 +/- 0.04 11.08 +/- 0.06
PAXB 20 7.9 11.5 Stn216 11.54 +/- 0.07 11.25 +/- 0.05 10.99 +/- 0.07
FTC 20 10.2 9.7 Stn212 11.04 +/- 0.06 10.85 +/- 0.04 10.54 +/- 0.06
BEPA 20 24.8 22.4 Stn216 11.65 +/- 0.06 11.31 +/- 0.04 10.8 +/- 0.05
multiple independently derived freshwater stickleback pop-ulations. Recent genomic studies in sticklebacks suggest that adaptation through the reuse of identical genetic va-riants is strikingly widespread, although the phenotypes controlled by these reused variants are mostly unknown [52,54]. Intriguingly, in the Joneset al.set of standing vari-ant regions under parallel selection in freshwater, chromo-somes 4 and 20 are the two chromochromo-somes with the most re-used standing variant regions, including several regions that overlap the raker QTL identified here (Additional file 8: Table S3) [54]. Given the widespread use of standing variants in stickleback freshwater adaptation, we hypo-thesize that the two raker QTL are standing variants, present at low frequency in the oceanic population, that increase in frequency predictably upon freshwater colo-nization. This pattern, recently termed‘collateral evolution’, has largely been documented on traits with fairly simple genetic architectures (reviewed in [16]). The extent to which collateral evolution is used for more complex, highly polygenic traits is poorly understood, but evolved gill raker reduction in sticklebacks provides a powerful system to ad-dress this question, especially since constant low levels of gene flow between oceanic and freshwater populations
provide ample opportunities for adaptive alleles to be recycled and reused again during future freshwater coloni-zations [55,56]. Future work will test the hypothesis of col-lateral evolution of gill raker QTL by using next-generation sequencing approaches to look for genomic signatures of shared haplotypes that are under strong selection in mul-tiple raker-reduced freshwater populations and present at low frequency in anadromous marine populations [52,54]. It will be especially interesting to compare the genetic and developmental mechanisms of evolved changes in gill raker number in additional stickleback populations, as well as in other fish species that also evolve dramatic changes in gill raker counts in populations adapted to eat differ-ent diets [69], for example, whitefish and Arctic charr (reviewed in [119]).
Although the two chromosome 4 and 20 QTL have many parallel features in multiple freshwater popula-tions, there are still several unexplained aspects of the genetic and developmental basis of convergent gill raker evolution observed in this study. First, the effect sizes of the chromosome 4 and 20 QTL varied in the three crosses. Although some variation in effect size is to be expected by chance, this phenomenon could also suggest
47 48 49 50 51 52
6.8 7.0 7.2 7.4 7.6 7.8 7.6 7.8 8.0 8.2 8.4 8.6
48 49 50 51 52
Chr. 20
*
Chr. 4
*
FTC x LITC
B
Chr. 20
***
Chr. 4
***
Bud spacing (um)
Homozygous freshwater Homozygous marine
Chr. 20
*
Chr. 4
***
PAXB x LITC
A
Chr. 20
**
Chr. 4
**
Bud spacing (um)
Bud number
Bud number
that different genetic backgrounds might modulate the effects of the QTL (for example due to varying numbers of other modifier QTL and/or epistatic interactions with other QTL). Alternatively, the variation in effect size could reflect different underlying genetic bases in the different freshwater populations.
A second unexplained feature of gill raker reduction observed in this study is the modularity of dorsal and ventral gill rakers: both the chromosome 4 and 20 QTL have much stronger effects on ventral gill raker number than dorsal gill raker number in all three crosses. In an-other cross, we previously also found extensive modular-ity along the dorsal-ventral axis in the genetic control of stickleback gill raker reduction [89]. In the time course studies presented here, ventral gill rakers form much earlier during development than dorsal gill rakers, so this modularity might reflect the temporal window of developmental effect for the QTL, and/or regionally re-stricted (for example, in ventral not dorsal primordia) expression of genes underlying the QTL. Regardless of the developmental genetic mechanism, this strong modularity of gill rakers even within row 1 suggests that separately phenotyping dorsal and ventral row 1 gill rakers might yield different results than summing the total of all row 1 rakers, as is commonly done in ecological and evolu-tionary studies.
A third unexplained genetic feature of gill raker reduc-tion observed in this study is that one freshwater popula-tion (FTC) is more raker reduced than the others (BEPA and PAXB). Interestingly, much of this difference is due to a much stronger reduction of FTC in row 1 gill raker rela-tive to other rows (compare Additional file 4: Figure S3 to Figure 1C), which might reflect differences in freshwater diets and/or available genetic variation. Future work using genome-wide linkage mapping in multiple F2 crosses will address the extent of genetic constraint, and whether smaller-effect modifier QTL are also repeatedly used to accomplish repeated gill raker reduction. We hypothesize that there are additional and/or stronger effect QTL con-trolling FTC gill rakers than in PAXB or BEPA, possibly including modular row 1-specific gill raker QTL present in FTC. In addition, further genotyping of the chromo-some 4 and 20 QTL in the three crosses, while unlikely to change the main result presented here of overlapping QTL, may improve the resolution of these QTL.
Parallel developmental features underlie stickleback gill raker reduction
Another main finding of this study is that parallel devel-opmental changes underlie convergent evolution of gill raker reduction. Despite the established adaptive signifi-cance of evolved changes in gill raker number and the recurrent phenomenon of this trait evolving across many fish clades (reviewed in [69,120]), little was previously
known about the developmental processes altered by these evolved genetic changes. Here, we find that gill raker spacing is increased in all three freshwater popula-tions in adults, and dense developmental time courses in two of these populations reveal an early developmental increase in the spacing of gill raker primordia that is controlled by the chromosome 4 and 20 QTL. The adult difference in pattern is specified as an increased distance between the budding gill raker primordia at a surpris-ingly early stage - before hatching, raker ossification, and feeding. A previous study found no significant plastic response in gill raker number to shifts in diet [82]. This result, together with our findings that marine/freshwater gill raker number differences are fixed before the onset of feeding, suggests that gill raker number is largely gen-etically hard-wired at an early stage in development. This genetically programmed difference in spacing arises somewhere upstream of the genetic regulatory networks controlling early spacing ofEctodysplasin receptor (Edar)-expressing raker primordia, although the precise location of the evolved changes in this pathway in different fresh-water populations remains to be determined. A comple-mentary expression pattern of Edarand Edain gill raker buds and inter-raker domains, respectively [99, this work] resembles the complementary expression patterns ofEdar andEda in other epithelial appendage bud and inter-bud domains [93-97], suggesting a shared genetic program for gill rakers and other epithelial appendages.
Evolved changes in patterning of epithelial appendages have occurred repeatedly during vertebrate evolution. For example, in human populations, a derived allele of the EDAR gene affecting hair, sweat gland, and mam-mary gland morphology underwent one of the strongest selective sweeps in the genome [121]. Ectodysplasin sig-naling is perhaps used repeatedly during stickleback and human evolution because epithelial appendages are a ‘hot spot’for evolution, as they form and function at the interface between an organism and its environment (reviewed in [92]).
of other epithelial appendages, mutations that contrib-ute to an increase in the spacing of gill raker primordia could increase the strength of inhibitory genes, decrease the strength of activating genes, or both. Understanding the developmental and genetic mechanisms underlying stickleback gill raker evolution might further shed light on general principles of epithelial appendage evolution.
Pleiotropy and candidate genes
Parallel evolution of gill raker reduction might also be pro-moted by selection on another trait that is genetically con-trolled in a linked or pleiotropic manner to gill rakers. Interestingly, we have previously mapped trait clusters of several large-effect QTL controlling various skeletal phe-notypes to chromosomes 4 and 20 [89]. It is possible that the genes underlying the chromosome 4 and 20 gill raker QTL have a pleiotropic effect on multiple adaptive skeletal traits, or that these genes are tightly linked to genes that also confer adaptive phenotypes in freshwater environ-ments, promoting the parallel use of gill raker QTL on chromosome 4 and 20.
One gene in particular,Eda, stands out as a candidate for playing a pleiotropic adaptive role in freshwater adaptation. Eda is located on chromosome 4, and has been identified as the principal gene underlying fresh-water lateral plate reduction and marine/freshfresh-water neu-romast differences [44,49,123]. In sticklebacks, the Eda genomic region has also been linked to multiple other phenotypes: behavioral preference for alternative salin-ities [124], aspects of body shape [125], and schooling behavior, perhaps through effects on the lateral line [126,127]. Eda plays pleiotropic roles during fish devel-opment, as zebrafish homozygous for strong loss-of-function alleles ofEdalack scales (homologous to lateral plates), as well as gill rakers, teeth, and fin rays [98]. However, genetic resolution of the QTL argues strongly against the previously identifiedEda haplotype control-ling plate number [49] underlying the chromosome 4 gill raker QTL. In all three crosses, the peak marker of the chromosome 4 gill raker QTL is to the‘right’(higher co-ordinate in the genome assembly) of Eda (which is lo-cated at Stn382) and in the FTC and PAXB crosses, the coding region of Eda lies well outside the 1.5 LOD inter-val. This mapping better supports candidate genes to the right of Eda, although it is possible that there is a long-range regulatory element ofEdathat lies within the con-sensus QTL interval. Although the chromosome 4 and 20 QTL intervals are broad, several interesting candidate genes lie within the intervals that are members of im-portant developmental signaling pathways known to play a role in epithelial appendage patterning. Fgf20, Hes7, Fgf4, andSmad5on chromosome 4 andHey1andGsk3a on chromosome 20 stand out as intriguing candidates given their roles in FGF, Notch, BMP, or WNT signaling.
Conclusions
In summary, this work establishes that convergent evolution of gill raker reduction evolves via parallel em-bryonic shifts in the spacing of gill raker primordia, ac-complished at least in part via the parallel use of QTL on chromosomes 4 and 20 in derived freshwater popula-tions from Alaska, British Columbia, and Washington. During embryonic development, gill raker reduction is accomplished largely by an increased spacing between gill raker primordia, which the chromosome 4 and 20 QTL both control. Collectively our data support a model where this classic ecology-driven naturally selected trait evolves repeatedly via parallel developmental genetic mech-anisms. Future forward [128,129] and reverse [130,131] genetic approaches will further test how parallel the underlying molecular genetic changes are in this system of parallel adaptive evolution, and how these changes affect evolved differences in the developmental processes con-trolling epithelial appendage patterning.
Additional files
Additional file 1: Figure S1.Diagram of gill raker domains in the stickleback branchial skeleton.(A)Adult Alizarin red-stained stickleback branchial skeleton. Gill rakers are present in nine anterior-posterior rows (r1-r9). They protrude anteriorly and posteriorly from ventral ceratobranchials 1-4 (cb1-4), epibranchials 1-4 (eb1-4), and anteriorly from ceratobranchial 5 (cb5). A = anterior, P = posterior, D = dorsal, V = ventral. Scale bar = 1 mm.
(B)Adult Alizarin red-stained stickleback branchial skeleton, zoomed in on left side row 1 gill rakers. Ventral and dorsal gill rakers protrude anteriorly from ceratobranchial 1 (cb1) and epibranchial 1 (eb1), respectively. Raker spacing measurements were obtained by measuring the mean center-to-center distance of all ventral rakers. Raker width measurements were obtained by measuring the width of the Alizarin-positive region of the raker base. Scale bar = 500 um.
Additional file 2: Figure S2.Pre-budding marine/freshwater differences in bud number, bud spacing, bud width, and field size.
(A)Edarexpression in developing ventral row 1 raker primordia in early bud stage (6.0 mm total length) fry. Landmarks used for foci width, foci spacing, and field size are indicated. Scale bar = 25 um.(B-E)Significant differences in early bud stage ventral row 1Edar+ foci number(B), foci spacing(C), field size(D), and foci width(E)between LITC (red) and FTC (blue) fish, detected byEdar in situhybridization. Phenotypes are back transformed residuals for a regression to total length for a mean length of 5.5 mm. Error bars depict mean +/- SD. DisplayedPvalues are from a two tailed t-test. Percent difference is from the ratio of mean marine and freshwater values.
Additional file 3: Table S1.Markers used in this study. Three methods of PCR were used in this study to genotype markers. Type A: 3 primer PCR. Method of [105] with M13F (TGTAAAACGACGGCCAGT) added to the 5′of the forward primer. Type B: Direct PCR. Forward primer directly labeled with a fluorophore (FAM/VIC/PET/NED). Type C: Unlabeled PCR. Primers not fluorescently labeled; analyzed by gel electrophoresis.
FTC is especially low-rakered in row 1. Error bars depict mean +/- SD.
n> = 19 per condition. ***P<0.001, Tukey’s HSD test.
Additional file 5: Figure S4.Correlations of raker number and spacing measurements. Pearson’s correlation coefficients are presented for five comparisons between size and sex-adjusted (as appropriate) raker number and spacing phenotypes for all measured fish (wild and lab-reared datasets) or a sample of 100 fish (crosses). Correlations are presented as values multiplied by 100 (for example, 76 corresponds to a correlation of 0.76). Positive correlations are colored red and negative correlations are colored blue. Phenotypes are abbreviated: 1V = mean row 1 ventral number, 1-3V = mean row 1-3 ventral number,
1-9V = mean row 1-9 ventral number, 1D = mean row 1 dorsal number, 1Sp = left side row 1 spacing.
Additional file 6: Figure S5.Adult marine and freshwater fish do not have significantly different gill raker widths. Boxplot of row 1 ventral gill raker width for Little Campbell (LITC) marine and Fish Trap Creek (FTC) freshwater adult lab-reared fish. Values are represented as median +/-interquartile range.n> =12 per population. n.s. = not significant (P= 0.37, two-tailed t-test). Refer to Additional file 1: Figure S1B for a diagram of the landmarks used for raker width measurements.
Additional file 7: Table S2.Genetic maps of chromosome 4 and 20 used for adult QTL mapping. *The genomic region containing scaffolds 24 and 28 on chromosome 4 (containing Stn253) is inverted in the genome assembly [110]. ^Scaffold 46 containing marker Chr20_204 maps to the‘left’end of chromosome 20 in all three crosses despite being on the right end of the genome assembly (higher coordinate in the genome assembly). Cytogenetic data are consistent with Scaffold 46 mapping to the left end of the chromosome (lower coordinate in the genome assembly) [111]. Chr4_221, which was not used for adult QTL mapping, is located at 25.32 Mb in the genome assembly.
Additional file 8: Table S3.Summary of adult QTL. Statistics for QTL for average ventral rows 1-3 are shown. Genotypic classes of F2 fish are abbreviated: MM = homozygous marine, MF = heterozygous, FF = homozygous freshwater. LOD is the logarithm of the odds and PVE is the percentage of phenotypic variance explained. Genomic coordinates of regions of marine-freshwater divergence (Joneset al., 2012) that overlap with consensus QTL positions from this study are shown (Mb = megabases).
Additional file 9: Figure S6.Physical positions of chromosome 4 and 20 QTL.(A, B)Association of mean ventral row 1-3 gill raker number with chromosome 4(A)or chromosome 20(B)genotype, plotted against adjusted physical position (genome assembly coordinates adjusted as previously described; see Methods). Refer to Additional file 7: Table S2 for a list of which markers are present in each plot.
Additional file 10: Figure S7.Lab-reared freshwater fish have fewer dorsal gill rakers than marine fish. Boxplot of mean row 1-3 dorsal gill raker number for Little Campbell (LITC) marine and Fish Trap Creek (FTC) freshwater, Paxton Benthic freshwater (PAXB), or Bear Paw freshwater (BEPA) adult lab-reared fish. Values are represented as median +/-interquartile range.n> =19 per condition. ***P<0.001, Tukey’s HSD test.
Additional file 11: Table S4.Ventral modularity of raker number QTL. LOD scores (logarithm of the odds) for ventral (average rows 1-3) and dorsal (average rows 1-3) raker domains in three adult marine × freshwater F2 crosses.
Additional file 12: Table S5.Summary of early (20 days post fertilization) QTL. Statistics for QTL for left side ventral row 1 number and left side row 1-7 spacing are shown. Effect size for the spacing phenotypes is in units of microns. Genotypic classes of F2 fish are abbreviated: MM = homozygous marine, FF = homozygous freshwater. PVE is the percentage of phenotypic variance explained.
Abbreviations
BEPA:Bear Paw freshwater; cM: centiMorgans;Eda:Ectodysplasin;
Edar:Ectodysplasin receptor; FF: Homozygous freshwater; FTC: Fishtrap Creek freshwater; LITC: Little Campbell marine; LOD: Logarithm of the odds; MF: Heterozygous (marine/freshwater); MM: Homozygous marine; PAXB: Paxton benthic freshwater; PVE: Percentage of phenotypic variance
explained; QTL: Quantitative trait locus; SD: Standard deviation; SEM: Standard error of the mean.
Competing interests
The authors declare that they have no competing interests.
Authors’contributions
AMG, PAC, PAE, and CTM conceived and designed the experiments. AMG, PAC, PAE, and AYL performed the experiments. AMG and CTM analyzed the data and wrote the manuscript. All authors critically revised earlier drafts, and then read and approved the final manuscript.
Acknowledgements
We thank David Kingsley for his input and support during the beginning of this study, Dolph Schluter and Mike Bell for their generous gifts of Paxton benthic and Bear Paw lake fish, Alex Pollen for assistance collecting Fishtrap Creek and Little Campbell River fish, the Semiahmoo First Nation for permission to collect sticklebacks from the Little Campbell River, Patrick Lee and Anthony Lee for expert assistance in crossing and raising fish, and Jessica Grindheim, Emily Killingbeck, Monica Jimenez, and Nihar Patel for genotyping and phenotyping assistance. This work was supported in part by the NIH (R01- DE021475 to CTM and a Predoctoral Training Grant
5T32GM007127 to AMG, PAC, PAE), the NSF-Graduate Research Fellowship Program (AMG, PAC), a March of Dimes Basil O’Connor Starter Scholar Award (CTM), and a Pew Scholar in Biomedical Sciences award supported by the Pew Charitable Trusts (CTM).
Received: 22 February 2014 Accepted: 23 April 2014 Published: 12 May 2014
References
1. Albert VA, Williams SE, Chase MW:Carnivorous plants: phylogeny and structural evolution.Science1992,257:1491–1495.
2. Bossuyt F, Milinkovitch MC:Convergent adaptive radiations in
Madagascan and Asian ranid frogs reveal covariation between larval and adult traits.Proc Natl Acad Sci U S A2000,97:6585–6590.
3. Donley JM, Sepulveda CA, Konstantinidis P, Gemballa S, Shadwick RE:
Convergent evolution in mechanical design of lamnid sharks and tunas. Nature2004,429:61–65.
4. Kolbe JJ, Revell LJ, Szekely B, Brodie ED 3rd, Losos JB:Convergent evolution of phenotypic integration and its alignment with
morphological diversification in Caribbean Anolis ecomorphs.Evolution
2011,65:3608–3624.
5. Chen L, DeVries AL, Cheng CH:Evolution of antifreeze glycoprotein gene from a trypsinogen gene in Antarctic notothenioid fish.Proc Natl Acad Sci U S A1997,94:3811–3816.
6. Christin PA, Besnard G, Samaritani E, Duvall MR, Hodkinson TR, Savolainen V, Salamin N:Oligocene CO2 decline promoted C4 photosynthesis in grasses.Curr Biol2008,18:37–43.
7. Dobler S, Dalla S, Wagschal V, Agrawal AA:Community-wide convergent evolution in insect adaptation to toxic cardenolides by substitutions in the Na, K-ATPase.Proc Natl Acad Sci U S A2012,109:13040–13045. 8. McCracken KG, Barger CP, Bulgarella M, Johnson KP, Sonsthagen SA, Trucco
J, Valqui TH, Wilson RE, Winker K, Sorenson MD:Parallel evolution in the major haemoglobin genes of eight species of Andean waterfowl. Mol Ecol2009,18:3992–4005.
9. Tishkoff SA, Reed FA, Ranciaro A, Voight BF, Babbitt CC, Silverman JS, Powell K, Mortensen HM, Hirbo JB, Osman M, Ibraham M, Omar SA, Lema G, Nyambo TB, Ghori J, Bumpstead S, Pritchard JK, Wray GA, Deloukas P:
Convergent adaptation of human lactase persistence in Africa and Europe.Nat Genet2007,39:31–40.
10. Blackledge TA, Gillespie RG:Convergent evolution of behavior in an adaptive radiation of Hawaiian web-building spiders.Proc Natl Acad Sci U S A2004,101:16228–16233.
11. Hodgkin J, Doniach T:Natural variation and copulatory plug formation in Caenorhabditis elegans.Genetics1997,146:149–164.
12. Kowalko JE, Rohner N, Linden TA, Rompani SB, Warren WC, Borowsky R, Tabin CJ, Jeffery WR, Yoshizawa M:Convergence in feeding posture occurs through different genetic loci in independently evolved cave populations of Astyanax mexicanus.Proc Natl Acad Sci U S A2013,
13. Conte GL, Arnegard ME, Peichel CL, Schluter D:The probability of genetic parallelism and convergence in natural populations.Proc Biol Sci2012,
279:5039–5047.
14. Martin A, Orgogozo V:The loci of repeated evolution: a catalog of genetic hotspots of phenotypic variation.Evolution2013,67:1235–1250. 15. Nadeau NJ, Jiggins CD:A golden age for evolutionary genetics? Genomic
studies of adaptation in natural populations.Trends Genet2010,26:484–492. 16. Stern DL:The genetic causes of convergent evolution.Nat Rev Genet
2013,14:751–764.
17. Arendt J, Reznick D:Convergence and parallelism reconsidered: what have we learned about the genetics of adaptation?Trends Ecol Evol2008,
23:26–32.
18. Calboli FC, Kennington WJ, Partridge L:QTL mapping reveals a striking coincidence in the positions of genomic regions associated with adaptive variation in body size in parallel clines of Drosophila melanogaster on different continents.Evolution2003,57:2653–2658. 19. Gross JB, Borowsky R, Tabin CJ:A novel role for Mc1r in the parallel
evolution of depigmentation in independent populations of the cavefish Astyanax mexicanus.PLoS Genet2009,5:e1000326.
20. Perry GH, Dominy NJ, Claw KG, Lee AS, Fiegler H, Redon R, Werner J, Villanea FA, Mountain JL, Misra R, Carter NP, Lee C, Stone AC:Diet and the evolution of human amylase gene copy number variation.Nat Genet
2007,39:1256–1260.
21. Protas ME, Hersey C, Kochanek D, Zhou Y, Wilkens H, Jeffery WR, Zon LI, Borowsky R, Tabin CJ:Genetic analysis of cavefish reveals molecular convergence in the evolution of albinism.Nat Genet2006,38:107–111. 22. Reed RD, Papa R, Martin A, Hines HM, Counterman BA, Pardo-Diaz C, Jiggins
CD, Chamberlain NL, Kronforst MR, Chen R, Halder G, Nijhout HF, McMillan WO:Optix drives the repeated convergent evolution of butterfly wing pattern mimicry.Science2011,333:1137–1141.
23. Sucena E, Delon I, Jones I, Payre F, Stern DL:Regulatory evolution of shavenbaby/ovo underlies multiple cases of morphological parallelism. Nature2003,424:935–938.
24. Andersson LS, Larhammar M, Memic F, Wootz H, Schwochow D, Rubin CJ, Patra K, Arnason T, Wellbring L, Hjalm G, Imsland F, Petersen JL, McCue ME, Mickelson JR, Cothran G, Ahituv N, Roepstorff L, Mikko S, Vallstedt A, Lindgren G, Andersson L, Kullander K:Mutations in DMRT3 affect locomotion in horses and spinal circuit function in mice.Nature2012,
488:642–646.
25. Parker HG, VonHoldt BM, Quignon P, Margulies EH, Shao S, Mosher DS, Spady TC, Elkahloun A, Cargill M, Jones PG, Maslen CL, Acland GM, Sutter NB, Kuroki K, Bustamante CD, Wayne RK, Ostrander EA:An expressed fgf4 retrogene is associated with breed-defining chondrodysplasia in domestic dogs.Science2009,325:995–998.
26. Sutter NB, Bustamante CD, Chase K, Gray MM, Zhao KY, Zhu L, Padhukasahasram B, Karlins E, Davis S, Jones PG, Quignon P, Johnson GS, Parker HG, Fretwell N, Mosher DS, Lawler DF, Satyaraj E, Nordborg M, Lark KG, Wayne RK, Ostrander EA:A single IGF1 allele is a major determinant of small size in dogs.Science2007,316:112–115.
27. Cooley AM, Modliszewski JL, Rommel ML, Willis JH:Gene duplication in Mimulus underlies parallel floral evolution via independent trans-regulatory changes.Curr Biol2011,21:700–704.
28. Johanson U, West J, Lister C, Michaels S, Amasino R, Dean C:Molecular analysis of FRIGIDA, a major determinant of natural variation in Arabidopsis flowering time.Science2000,290:344–347.
29. Streisfeld MA, Rausher MD:Genetic changes contributing to the parallel evolution of red floral pigmentation among Ipomoea species.New Phytol
2009,183:751–763.
30. Yoon HS, Baum DA:Transgenic study of parallelism in plant morphological evolution.Proc Natl Acad Sci U S A2004,101:6524–6529. 31. Herring CD, Raghunathan A, Honisch C, Patel T, Applebee MK, Joyce AR,
Albert TJ, Blattner FR, van den Boom D, Cantor CR, Palsson BO:
Comparative genome sequencing of Escherichia coli allows observation of bacterial evolution on a laboratory timescale.Nat Genet2006,
38:1406–1412.
32. Tenaillon O, Rodriguez-Verdugo A, Gaut RL, McDonald P, Bennett AF, Long AD, Gaut BS:The molecular diversity of adaptive convergence.Science
2012,335:457–461.
33. van Ditmarsch D, Boyle KE, Sakhtah H, Oyler JE, Nadell CD, Deziel E, Dietrich LE, Xavier JB:Convergent evolution of hyperswarming leads to impaired biofilm formation in pathogenic bacteria.Cell Rep2013,4:697–708.
34. Jeffery WR:Regressive evolution in Astyanax cavefish.Annu Rev Genet
2009,43:25–47.
35. Kopp A:Metamodels and phylogenetic replication: a systematic approach to the evolution of developmental pathways.Evolution2009,63:2771–2789. 36. Losos JB:Convergence, adaptation, and constraint.Evolution2011,
65:1827–1840.
37. Stern DL:Evolutionary developmental biology and the problem of variation.Evolution2000,54:1079–1091.
38. Tanaka K, Barmina O, Kopp A:Distinct developmental mechanisms underlie the evolutionary diversification of Drosophila sex combs. Proc Natl Acad Sci U S A2009,106:4764–4769.
39. Cooley AM, Shefner L, McLaughlin WN, Stewart EE, Wittkopp PJ:The ontogeny of color: developmental origins of divergent pigmentation in Drosophila americana and D. novamexicana.Evol Dev2012,14:317–325. 40. Manceau M, Domingues VS, Mallarino R, Hoekstra HE:The developmental role of Agouti in color pattern evolution.Science2011,331:1062–1065. 41. Sanger TJ, Revell LJ, Gibson-Brown JJ, Losos JB:Repeated modification of
early limb morphogenesis programmes underlies the convergence of relative limb length in Anolis lizards.Proc Biol Sci2012,279:739–748. 42. Yamamoto Y, Byerly MS, Jackman WR, Jeffery WR:Pleiotropic functions of
embryonic sonic hedgehog expression link jaw and taste bud amplification with eye loss during cavefish evolution.Dev Biol2009,
330:200–211.
43. Bell MA, Foster SA:The Evolutionary Biology of the Threespine Stickleback.
Oxford: Oxford University Press; 1994.
44. Colosimo PF, Peichel CL, Nereng K, Blackman BK, Shapiro MD, Schluter D, Kingsley DM:The genetic architecture of parallel armor plate reduction in threespine sticklebacks.PLoS Biol2004,2:635–641.
45. Coyle SM, Huntingford FA, Peichel CL:Parallel evolution of Pitx1 underlies pelvic reduction in Scottish threespine stickleback (Gasterosteus aculeatus).J Hered2007,98:581–586.
46. Cresko WA, Amores A, Wilson C, Murphy J, Currey M, Phillips P, Bell MA, Kimmel CB, Postlethwait JH:Parallel genetic basis for repeated evolution of armor loss in Alaskan threespine stickleback populations.Proc Natl Acad Sci U S A2004,101:6050–6055.
47. Shapiro MD, Marks ME, Peichel CL, Blackman BK, Nereng KS, Jonsson B, Schluter D, Kingsley DM:Genetic and developmental basis of evolutionary pelvic reduction in threespine sticklebacks.Nature2004,
428:717–723.
48. Chan YF, Marks ME, Jones FC, Villarreal G Jr, Shapiro MD, Brady SD, Southwick AM, Absher DM, Grimwood J, Schmutz J, Myers RM, Petrov D, Jonsson B, Schluter D, Bell MA, Kingsley DM:Adaptive evolution of pelvic reduction in sticklebacks by recurrent deletion of a Pitx1 enhancer. Science2010,327:302–305.
49. Colosimo PF, Hosemann KE, Balabhadra S, Villarreal G Jr, Dickson M, Grimwood J, Schmutz J, Myers RM, Schluter D, Kingsley DM:Widespread parallel evolution in sticklebacks by repeated fixation of Ectodysplasin alleles.Science2005,307:1928–1933.
50. Miller CT, Beleza S, Pollen AA, Schluter D, Kittles RA, Shriver MD, Kingsley DM:Cis-regulatory changes in Kit ligand expression and parallel evolution of pigmentation in sticklebacks and humans.Cell2007,
131:1179–1189.
51. Rockman MV:The QTN program and the alleles that matter for evolution: all that’s gold does not glitter.Evolution2012,66:1–17.
52. Hohenlohe PA, Bassham S, Etter PD, Stiffler N, Johnson EA, Cresko WA:
Population genomics of parallel adaptation in threespine stickleback using sequenced RAD tags.PLoS Genet2010,6:e1000862.
53. Jones FC, Chan YF, Schmutz J, Grimwood J, Brady SD, Southwick AM, Absher DM, Myers RM, Reimchen TE, Deagle BE, Schluter D, Kingsley DM:
A genome-wide SNP genotyping array reveals patterns of global and repeated species-pair divergence in sticklebacks.Curr Biol2012,22:83–90. 54. Jones FC, Grabherr MG, Chan YF, Russell P, Mauceli E, Johnson J, Swofford R,
Pirun M, Zody MC, White S, Birney E, Searle S, Schmutz J, Grimwood J, Dickson MC, Myers RM, Miller CT, Summers BR, Knecht AK, Brady SD, Zhang H, Pollen AA, Howes T, Amemiya C, Broad Institute Genome Sequencing Platform & Whole Genome Assembly Team, Baldwin J, Bloom T, Jaffe DB, Nicol R,et al:The genomic basis of adaptive evolution in threespine sticklebacks.Nature2012,484:55–61.
55. Bell MA, Aguirre WE:Contemporary evolution, allelic recycling, and adaptive radiation of the threespine stickleback.Evol Ecol Res2013,