Classification of marine sediments can be
based upon size or origin
• Size classification divides
sediment by grain size into
gravel, sand, silt and clay.
– Mud is a mixture of silt and
clay.
• Origin classification divides
sediment into five categories:
– terrigenous sediments (45%)
– biogenous sediments (55%)
– hydrogenous sediments (1%)
– volcanogenous sediments
– cosmogenous sediments
Sediment in the Sea
• Factors that control sedimentation include:
– particle size
– the turbulence of the depositional environment
• Terrigenous sediments strongly reflect their source.
– They are transported to the sea by wind, rivers and glaciers.
• Rate of erosion is important in determining nature of
sediments.
• Average grain size reflects the energy of the depositional
environment. (see Hjulström’Diagram)
• Hjulström’s Diagram graphs the relationship
between particle size and energy for
– erosion
– transportation
– deposition
Sediment in the Sea
• Based upon water depth, the ocean
environment can be divided into:
– the shelf
(Sediments on continental margins called Neritic Sediments)
• shallow and near a terrigenous source
• Dominated by Terrigenous sediments
– the deep ocean basin
(Called Pelagic Sediments)
• deep and far from a terrigenous source
• Dominated by Biogenous sediments
• Finer particles of terrigenous origins
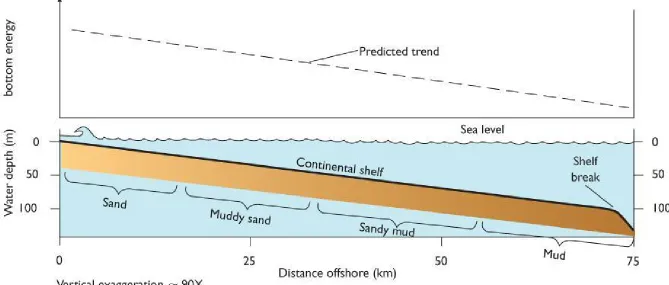
• Shelf sedimentation is strongly controlled by:
– Tides, Waves, and Currents
– influence of these (3) decreases with water depth.
• Shoreline turbulence prevents small particles
from settling in the shallow water.
• Particle size decreases seaward for
recent
sediments.
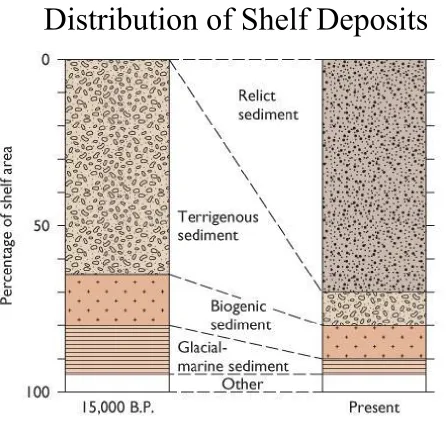
Shelf Sedimentation
Sedimentation in the Ocean
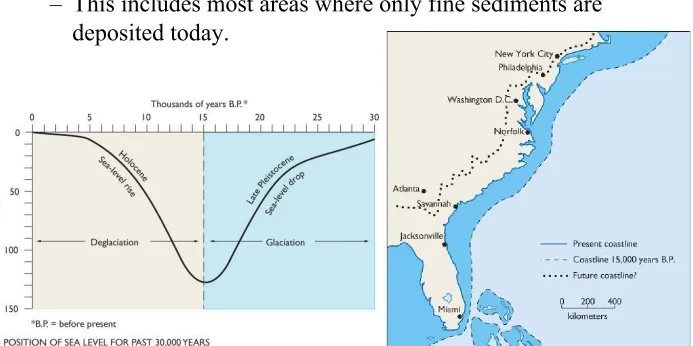
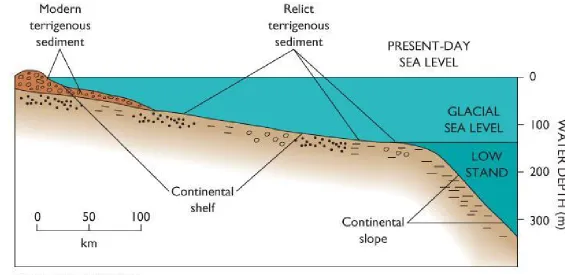
Past fluctuations of sea level have stranded coarse (relict)
sediment across the shelf.
– This includes most areas where only fine sediments are
deposited today.
Figure 4-2 Shelf Sedimentation
Shelf Sedimentation
Figure 4-3b Relict Sediment
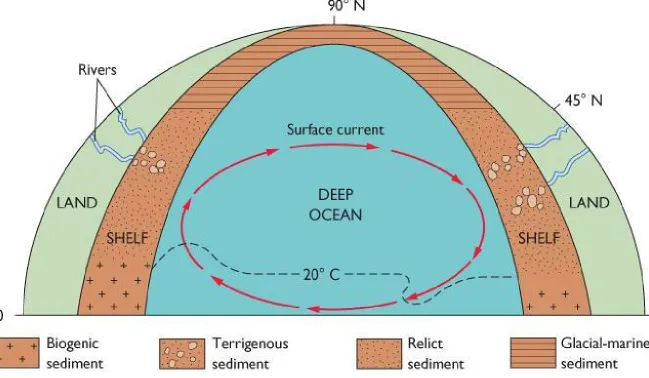
• Worldwide distribution of recent shelf sediments
by composition is strongly related to
latitude
and
climate
.
• Calcareous biogenous sediments dominate tropical
shelves.
• River-supplied sands and muds dominate
temperate shelves.
• Glacial till and ice-rafted sediments dominate
polar shelves.
Shelf Sedimentation Model
Distribution of Shelf Deposits
If influx of terrigenous sediment is low and the
water is warm,
carbonate
sediments and reefs
will dominate.
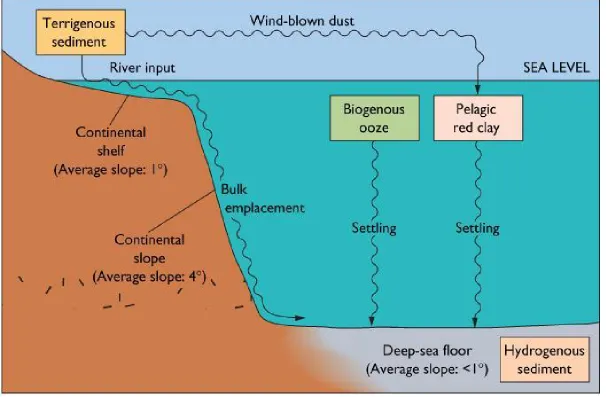
• Deep-sea Sedimentation has two main
sources of sediment:
–
External
– terrigenous material from the land
–
Internal
– biogenous and hydrogenous from
Deep-Sea Sedimentation
• The distribution of sediments in the
deep
ocean reflects:
– Latitude
– distance from landmasses
– the calcium carbonate compensation depth
• Glacial marine sediments occur in the high
latitudes. (Ice-Rafting)
Global Deep-Sea Deposits
Figure 4-16a Deep-Sea Sediment Distribution
Radiolari ans
Diatoms
Diatoms
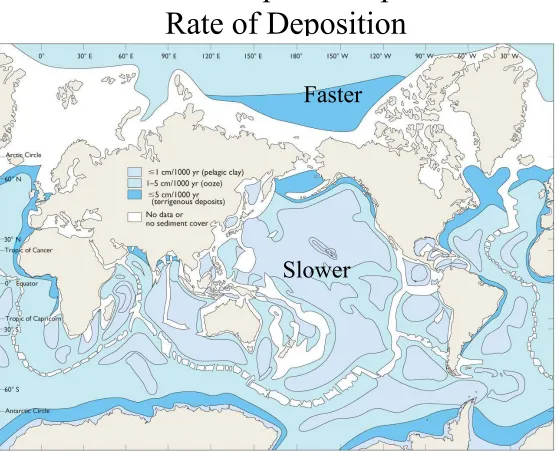
• Calcareous oozes occur above the calcium carbonate
composition depth.
• The rate of sedimentation depends on the type of sediment
in deep sea.
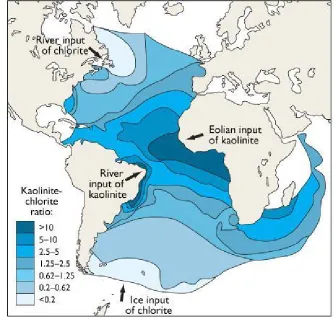
Figure 4-13 Clays in Deep-Sea Muds
The type of
sediment (clay)
indicates the
Global Deep-Sea Deposits
Rate of Deposition
Figure 4-16b Sedimentation Rates
Faster
The Formation of Glacial-Marine Sediments
The Formation of Glacial-Marine Sediments
• Major sedimentary processes in the deep sea include:
– Bulk emplacement
(Slumps - intact slides from shelf/slope)
– Debris flows
(downslope flow of unconsolidated debri)
– Turbidity currents
(sediment laden slurries that result in “turbidites and
submarine fans)
Major pelagic sediments
in the ocean are red
clay and
biogenic
oozes
.
Figure 4-14b Foraminifera - Calcareous
• Hydrogenous deposits are chemical and biochemical
precipitates that form on the sea floor. They include:
– ferromanganese nodules
– phosphorite
•
Deep-sea stratigraphy
refers to the
broad-scale layering of sediments that cover the
basaltic crust.
• The Atlantic basin contains a “two-layer-cake”
stratigraphy – a thick basal layer of carbonate
ooze overlain by a layer of mud.
• The Pacific basin contains a “four-layer-cake” stratigraphy.
• It crosses the equator where the CCD is lowered to the
ocean bottom.
Figure 4-18a Pacific Ocean
Stratigraphy of the Pacific Basin
Figure 4-18b Stratigraphy of the Pacific Basin
Figure 4-18c Model to Account for Pacific Stratigraphy
• The Mediterranean basin is located where plates are
colliding as Africa moves northward relative to
Europe.
•
Anhydrite
(that can form only in salty brine)
and
stromatolites
(bacterial fossils)
of Miocene age indicate that the
Mediterranean sea “dried” out between 5 and 25
million years ago.
• Two models have been suggested to account for this emptying
of the Mediterranean Sea of its water.
– The “Uplift” Model
– The “Drying-Out” Model
• After drying out, seawater from the Atlantic Ocean cascaded
down the face of the Gibraltar Sill, refilling it in about 100
years.
The Drying Up of the Mediterranean Sea
• Geologic controls of continental shelf sedimentation
must be considered in terms of a
time frame
.
• For a time frame up to:
– 1000 years,
waves, currents and tides
control
sedimentation.
– 1,000,000 years,
sea level
lowered by glaciation controls
sedimentation and cause rivers to deposit their sediments at
the shelf edge and onto the upper continental slope.
– 100,000,000 years,
plate tectonics
determines the type of
margin that develops and controls sedimentation.
Paleogeography of North America
Sedimentation in the Ocean
Figure 4-5a North American Paleogeography 100 MYBP
Sedimentation in the Ocean
Figure 4-5c Western North American Tectonic Margin (Active Margin)
Development of a Passive Atlantic-type Margin
Figure 4-6a Initial Rifting (Triassic Period: 200 MYBP)
Figure 4-6c Present-Day Margin Southeast of Cape Cod
Subduction Tectonics and Sedimentation
Figure 4-7b Accretionary Prism
Bulk Emplacement of Sediment to the Deep Sea
Figure 4-10c Margin-Sedimentation Model