Annales Geophysicae (2004) 22: 3995–4003 SRef-ID: 1432-0576/ag/2004-22-3995 © European Geosciences Union 2004
Annales
Geophysicae
Multitaper spectral analysis of atmospheric radar signals
V. K. Anandan1,*, C. J. Pan1, T. Rajalakshmi2, and G. Ramachandra Reddy2
1Institute of Space Science, National Central University, Chung-Li, 32054, Taiwan *on leave from National MST Radar Facility, Gadanki, India
2Department of EEE, SV University, Tirupati, AP, 517 502, India
Received: 22 October 2004 – Revised: 5 June 2004 – Accepted: 11 June 2004 – Published: 29 November 2004 Part of Special Issue “10th International Workshop on Technical and Scientific Aspects of MST Radar (MST10)”
Abstract. Multitaper spectral analysis using sinusoidal taper has been carried out on the backscattered signals received from the troposphere and lower stratosphere by the Gadanki Mesosphere-Stratosphere-Troposphere (MST) radar under various conditions of the signal-to-noise ratio. Comparison of study is made with sinusoidal taper of the order of three and single tapers of Hanning and rectangular tapers, to un-derstand the relative merits of processing under the scheme. Power spectra plots show that echoes are better identified in the case of multitaper estimation, especially in the region of a weak signal-to-noise ratio. Further analysis is carried out to obtain three lower order moments from three estimation techniques. The results show that multitaper analysis gives a better signal-to-noise ratio or higher detectability. The spec-tral analysis through multitaper and single tapers is subjected to study of consistency in measurements. Results show that the multitaper estimate is better consistent in Doppler mea-surements compared to single taper estimates. Doppler width measurements with different approaches were studied and the results show that the estimation was better in the multita-per technique in terms of temporal resolution and estimation accuracy.
Key words. Radio science (signal processing, instruments and techniques)
1 Introduction
It is well known that the spectral estimation through Fast Fourier Transform (FFT) to a finite length data gives rise to leakage and picket fence effects. Weighting the data with suitable windows can reduce these effects. Tapering is an-other name for the data windowing operation in the time do-main. Harris (1978) had given a detailed account on spec-tral leakage due to the application of various single tapers in the harmonic analysis. Single taper smoothed spectrum es-timates are plagued by a trade-off between the variance of Correspondence to: V. K. Anandan
(anandanvk@hotmail.com)
the estimate and the bias caused by spectral leakage. A ta-per is applied to reduce bias by discarding data and thereby increasing the variance of the estimate. Single taper esti-mators, which are less affected by leakage, not only have increased variance but also can misrepresent the spectra of non-stationary data. So, as long as only a single data taper is used, there will be a trade-off between the resistance to spectral leakage and the variance of a spectral estimate. Sin-gle taper spectral estimates have relatively large variance (in-creases as a large fraction of data is discarded and the bias of the estimate is reduced) and are inconsistent estimates (i.e. the variance of the estimate does not drop as one increases the number of data). To counteract this, it is conventional to smooth the single taper spectral estimate by applying a mov-ing average to the estimate. This reduces the variance of the estimate but results in a short-range loss of frequency reso-lution and therefore an increase in the bias of the estimate (Dimitris et al., 2000). An estimate is consistent if the bias and the variance both tend to zero as the number of obser-vations is increased. Thus, the problem associated with the spectral estimation of a finite length data by the FFT tech-niques is the problem of establishing efficient data tapers or data smoothing schemes.
Identifying atmospheric signals and computing three lower order spectral moments is central to the problem of extracting information from the Doppler spectra of the MST radar echoes. The straightforward method of analyzing the MST radar spectral data is based on identifying the most prominent peak of the Doppler spectrum for each range gate and computing three lower order spectral moments using the expressions given by Woodman (1985). Since MST radar signals are characterized by a rapidly falling signal-to-noise ratio (SNR), detection of atmospheric signals in a weak SNR region is always difficult and leads to erroneous estimation of moments.
3996 V. K. Anandan et al.: Multitaper spectral analysis of atmospheric radar signals Observations show that the leakage may overestimate the
noise level up to 28 dB for the strongest signals. Here we are present spectral estimation of atmospheric data using weight-ing functions of a higher order taper called multitaper. This paper demonstrates the capability and advantages of multi-taper spectral analysis, and the results are, compared with those results obtained with Hanning and rectangular single tapers. Section 2 presents the brief background of multitaper analysis and the taper used in this study. Observation and results are presented in Sect. 3 and a conclusion is given in Sect. 4.
2 Multitaper spectral analysis – theory
Thomson (1982) introduced the multitaper spectral analysis technique and that has been applied widely to the signal anal-ysis (Jeffrey et al., 1987). In multitaper analanal-ysis the data are multiplied by not one, but several leakage-resistant tapers. This yields several tapered time series from one record. Tak-ing the DFTs (Discrete Fourier Transform) of each of these time series, several “eigen spectra” are produced which are averaged to form a single spectral estimate. There are a num-ber of multitapers that have been proposed. Some of them are Slepian tapers, Discrete Prolate Spheroidal sequences, Sinusoidal tapers, etc. The central premise of this multita-per approach is that if the data tamultita-pers are promultita-perly designed orthogonal functions, then under mild conditions, the spec-tral estimates would be independent of each other at every frequency.
The multitapers are constructed so that each taper sam-ples the time series in a different manner while optimizing resistance to spectral leakage. The statistical information dis-carded by the first taper is partially recovered by the second taper; the information discarded by the first two tapers is par-tially retrieved by the third taper, and so on. Only a few lower-order tapers are employed, as the higher-order tapers allow for an unacceptable level of spectral leakage. One can use these tapers to produce an estimate that is not hampered by the trade-off between leakage and variance that plagues single-taper estimates.
Reidel and Sidorenko (1995) proposed a set of orthonor-mal tapers, which contain harmonically related sinusoidal ta-pers. These tapers are called sinusoidal tapers or minimum bias tapers. The continuous time minimum bias tapers are given as
vk(t )=
√
2 sin(π kt /τ ) (k=1,2, . . .) (1) and its Fourier Transform as
Vk(ω)=
√ 2j
"
sin ω+π k
τ
ω+π k
τ
+sin ω −π k
τ
ω−π k
τ
#
. (2)
The discrete analogs of the continuous time minimum bias tapers are called sinusoidal tapers. The k-th sinusoidal taper is given by
vk(n)=
r
2
N+1sin
π kn
N+1
n=1,2. . . ,N; k=1,2, . . . ,K, (3) where the amplitude term on the right a is normalization fac-tor that ensures orthonormality of the tapers. These sine ta-pers have a much narrower main lobe and much higher side lobes. Thus, they achieve a smaller bias due to smoothing by the main lobe, but at the expense of side lobe suppres-sion. Clearly, this performance is acceptable if the spectrum is varying slowly. The kt horder sinusoidal taper has its spec-tral energy concentrated in the frequency bands,
π(k−1)
N+1 ≤ |ω| ≤
π(k+1)
N+1 k=1,2, . . . K . (4) The time domain representation of the sinusoidal taper of or-der factor k=1, 2, 3 is as shown in Fig. 1. The sample val-ues of data that are weakly weighted by the first taper are weighted strongly by higher order tapers. The data samples that are weakly weighted by both the first and second tapers is weighted by the third and fourth tapers strongly. Thus, the data is weighted equally at all points like the rectangular taper, with the additional flexibility that these tapers have a slope of fall of weighting function and thus reduce the leak-age.
3 Observation and results
The MST radar at Gadanki (13.5◦N, 79.2◦E) is operates at 53 MHz with a peak power of 2.5 MW. A detailed system description may be obtained from Rao et al. (1995) and fur-ther changes on the radar system from Anandan et al. (2001). There are three cases of analysis presented here, one with low SNR, a second with good SNR and a third to show the improvement in detectability by SNR enhancement. The data used for the analysis is taken on 11 April (low SNR), 10 May (good SNR) and 25 July 2002 (long time data set) with 6 beam directions (zenith-X, zenith-Y in vertical and east, west, north, south directions with 10◦ off-zenith) and 150-m range resolution. For multitaper spectral estimation, sinusoidal taper and for single tapers Hanning and rectan-gular tapers were used. We have used up to third order of sinusoidal taper, which is found to be optimum in the anal-ysis. Frequency domain correction is applied for removing the ground clutter. Noise is removed from the spectra by us-ing the method followed by Hildebrand and Sekhon (1974) before computing the three lower order moments, by identi-fying the strongest peak signal.
V. K. Anandan et al.: Multitaper spectral analysis of atmospheric radar signals 3997
0
Figure 2
Figure 1
Fig. 1. Time domain representation of the first 3 orders of sinusoidal taper.
0
Figure 2
[image:3.595.98.500.62.174.2]Figure 1
Fig. 2. Power spectra estimated using (a) rectangular taper, (b) Hanning taper and (c) sinusoidal taper- order 3 for the west 10◦beam on 10 May 2002.
Table 1. Number of range gates failed in detecting the correct mean Doppler frequency and standard deviation of more than 0.5 Hz over the average mean Doppler, using sinusoidal (S), Hanning (H) and rectangular (R) tapers on 10 May 2002.
West 10◦beam Zenith beam North 10◦beam
10 May 2002 S H R S H R S H R
Doppler detection failed range gates 62 107 142 48 69 92 78 111 165
(Total number of range gates=1548)
% of corruption 4.0 6.91 9.17 3.1 4.45 5.94 5.03 7.17 10.65
% of range gates having standard deviation 15.0 21.48 28.9 14.51 17.74 20.61 15.52 24.36 34.45
>0.5 over average mean Doppler
spectral estimation enhances the SNR and thereby signal de-tectability in what would otherwise be a low SNR regime. The same type of analysis is carried out in all beams and for all dates reported here. We present detailed results of mo-ments analysis of west 10◦, zenith and north 10◦beams.
On 10 May, data is recorded for 45 min, having 12 frames in each beam. An average of the mean Doppler frequency is estimated and a standard deviation is calculated for three methods. Range gates from 3.6 to 22.6 km are used for mo-ment estimation. Accordingly in 12 frames for each beam there are 1548 range gates available. Table 1 shows the
[image:3.595.74.527.221.377.2] [image:3.595.51.543.468.577.2]3998 V. K. Anandan et al.: Multitaper spectral analysis of atmospheric radar signals
1
Figure –3
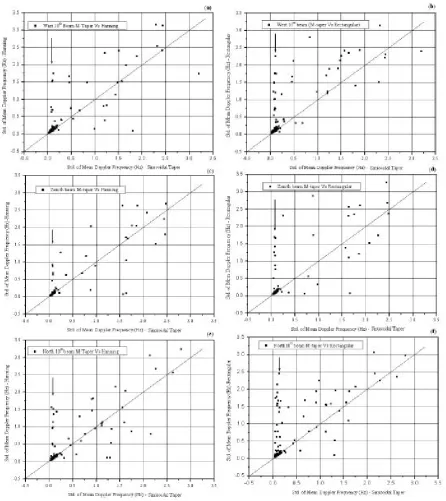
Fig. 3. Comparison of the standard deviation of the mean Doppler frequency for sinusoidal taper vs. Hanning taper, and sinusoidal taper vs. rectangular taper, (a) and (b) for west 10◦beam, (c) and (d) for zenith beam, (e) and (f) for north beam, respectively, observed on 10 May 2002.
between sinusoidal and Hanning taper, and between sinu-soidal and rectangular taper, (a) and (b) for west 10◦beam, (c) and (d) for zenith beam (e) and (f) for north 10◦beam, respectively. The diagonal line in all scatter plots represents equal value points. The arrow in the second column indi-cates those points where the sinusoidal taper has consistent estimation of mean Doppler, where it has failed in the other two cases. The consistency in estimation is poor in the case of the rectangular taper compared to the Hanning taper. In
all methods consistency is better in the case of the zenith beam, which indicates that noise variance is greatly influenc-ing Doppler detection and in the case of sinusoidal taper the variance is greatly reduced there by better consistent detec-tion of the mean Doppler frequency.
[image:4.595.77.524.60.562.2]V. K. Anandan et al.: Multitaper spectral analysis of atmospheric radar signals 3999
Table 2. Same as the case for Table 1 but for the observation on 11 April 2002.
West 10◦beam Zenith beam North 10◦beam
11 April 2002 S H R S H R S H R
Doppler detection failed range gates 109 134 180 59 62 81 112 142 152
(Total number of range gates=896)
% of corruption 12.16 14.95 20.13 6.58 6.91 9.04 12.5 15.84 17.0
% of range gates having standard deviation 26.6 36.09 43.11 16.07 16.07 21.42 29.6 36.69 42.49
>0.5 over average mean Doppler
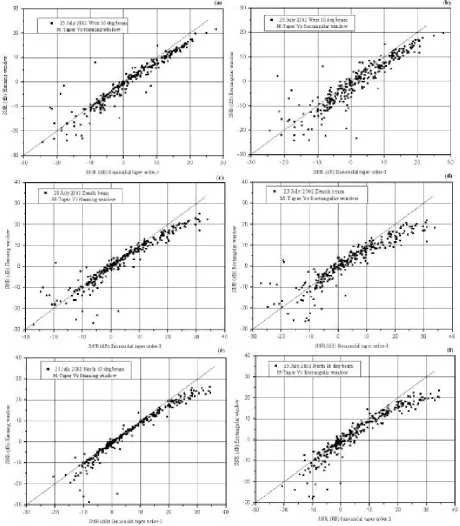
this day, range gates from 3.6 to 20 km are considered for moment estimation. Accordingly in 8 frames for each beam there are around 896 range gates available. Table 2 shows the number of range gates which failed in detecting the cor-rect mean Doppler frequency and the percentage of range gates having a standard deviation of more than 0.5 of average mean Doppler observed in sinusoidal, Hanning and rectan-gular tapers-based analysis. In this case as well, in all beams the sinusoidal taper shows the smallest number of range gate corruption, followed by the Hanning taper but the percentage of corruption in all methods is larger compared to the earlier observation. Figure 4 shows the comparison of the standard deviations of the mean Doppler frequency between the sinu-soidal and the Hanning taper, and between the sinusinu-soidal and the rectangular taper, (a) and (b) for west 10◦beam (c) and (d) for zenith beam, (e) and (f) for north beam, respectively. The consistency in Doppler detection is better in the sinu-soidal taper estimate compared to the single taper estimates. To show the improvement in detectability by sinusoidal ta-per analysis, a long set of data is used for a ta-period of 6 h on 25 July 2002. In this observation data are collected for 15 min in every one hour period. Figure 5 shows the comparison of SNR between the sinusoidal versus the Hanning taper, and the sinusoidal versus the rectangular taper, (a) and (b) for the west 10◦beam, (c) and (d) for the zenith beam, (e) and (f) for the north 10◦beam, respectively. Only range gates with correctly detected Doppler between 3.6 and 22 km are shown in the plots. Most of the points lie below the diagonal line in-dicating that SNR computed through the sinusoidal taper has higher values compared to Hanning and rectangular taper es-timation. In all cases the sinusoidal taper shows a difference of around 5–7 dB in the high SNR regions and it is around 5– 10 dB in the low SNR regions. In the case of the rectangular taper, a larger number of range gates shows a large differ-ence compared to the estimation through the Hanning taper. The result further suggests that multitaper spectral analysis improves SNR and thereby signal detectability.
Atmospheric signals are highly contaminated with noise and are often difficult to discern from the noise background. Multitaper spectral estimation reduces spectral leakage and variances of the noise, so the method yields a better esti-mate within such an environment. Figures 6a–c show the
power spectra plot of a region of weak echoes between 20.40 to 21.60 km, estimated using Hanning, rectangular and si-nusoidal tapers, respectively, for one incoherent integration and Figs. 6d–f for three incoherent integrations. It is clear from the plots that the echoes are better defined in the multi-taper spectral estimate than with the other single multi-tapers. The ambiguity in identifying the echoes is much smaller in the case of the multitaper method. The result also shows in the case of sinusoidal taper that the spectral peak and the val-ley point (signal boundaries) are easy to identify, leading to better estimation of the signals. Figures 7a and b show the Doppler width (half) estimated using three methods for the case of one-incoherent integration and three-incoherent in-tegrations (averaging time of 10 min). In the case of one-incoherent integration, the sinusoidal taper spectral estimate always shows higher Doppler width than that of single ta-per estimates. In the three-incoherent integrations the values of the Doppler width are comparable in all estimates. The maximum change in Doppler width from one-incoherent in-tegration to three-incoherent inin-tegrations for the sinusoidal taper is around 40%, and for that of single tapers it is around 100%. Incoherent integration improves detectability and re-duces noise variance. The significant change in Doppler width observed in the case of single tapers may be attributed to the removal of additive noise fluctuation over the signal ta-per and thereby detection of the signal envelope. In the case of sinusoidal taper it is almost achieved in one-incoherent in-tegration already. Doppler transience over the averaging time may also contribute to the increasing of the Doppler width for all estimates.
4000 V. K. Anandan et al.: Multitaper spectral analysis of atmospheric radar signals
[image:6.595.74.521.73.579.2]2
Figure-4
Fig. 4. Comparison of standard deviation of mean Doppler frequency between sinusoidal taper, vs. Hanning taper, and sinusoidal taper vs. rectangular taper, (a) and (b) for west 10◦beam, (c) and (d) for zenith beam, (e) and (f) for north beam, respectively, observed on 11 April 2002.
integration period may be neglected compared to the average spectra of the single taper. Therefore, the improvement in measuring the Doppler width is a distinct advantage in this method. The analysis is carried out for all beams and similar results are observed.
4 Conclusion
V. K. Anandan et al.: Multitaper spectral analysis of atmospheric radar signals 4001
3
Figure 5
Fig. 5. Comparison of SNR between sinusoidal taper vs. Hanning taper, and sinusoidal taper vs. rectangular taper, (a) and (b) for west 10◦ beam, (c) and (d) for zenith beam, (e) and (f) for north 10◦beam, respectively, observed on 25 July 2002.
SNR, the multitaper spectral estimate shows significant gain compared to single taper estimates. Multitaper analysis pro-duces consistent estimates with less variance compared to single taper estimates. Result shows an SNR enhancement of 5–7 dB in the strong signal region and 5–10 dB in the weak signal region. This shows that multitaper analysis enhances
[image:7.595.66.527.74.601.2]4002 V. K. Anandan et al.: Multitaper spectral analysis of atmospheric radar signals
4
Figure 6
Figure -7
Fig. 6. Power spectra estimated (a) and (d) using Hanning taper, (b) and (e) using rectangular taper, (c) and (f) using sinusoidal taper for 1 and 3 incoherent integration, respectively.
4
Figure 6
Figure -7
Fig. 7. Doppler width (half) estimated from power spectra obtained through Hanning, rectangular, and sinusoidal tapers for (a) one incoherent integration (b) three incoherent integration.
comparable to that of the three incoherent integrations. Thus, the results show that multitaper-based spectral analysis gives a distinct advantage over the conventional method of sin-gle taper spectral analysis. Multitaper estimation involves a complex computation compared to that of the single taper
[image:8.595.75.522.67.373.2] [image:8.595.56.538.431.624.2]V. K. Anandan et al.: Multitaper spectral analysis of atmospheric radar signals 4003
Acknowledgements. The National MST Radar Facility (NMRF) is
operated as an autonomous facility under Department of Space (DOS), India. Successful operation of the radar for the observa-tions reported here was made possible due to the dedicated efforts of several scientists and engineers associated with it. This paper is partially supported by the National Science council of the R.O.C, through grant NSC 92-2811-M-008-025.
Topical Editor U.-P. Hoppe thanks P. B. Rao and another referee for their help in evaluating this paper.
References
Anandan, V. K., Jain, A. R., Rao, P. B.: A New ADSP21060 based Signal Processor for Atmospheric Radar, Proceedings of MST 9 and COST 76, 511, 2000.
Dimitris, G. M., Ingle, V. K., Kogan, S. M.: Statistical and Adaptive Signal Processing, McGraw Hill International edition, 246–255, 2000.
Fukao, S., Yamanaka, M. D., Ao, N., Hocking, W. K., Sato, T., Yamamoto, M., Nakamura, T., Suda, T., and Kato, S.: Seasonal variability of vertical eddy diffusivity in the middle atmosphere, 1, Three year observations by the middle and upper atmosphere radar, J. Geophys. Res., 99, 18 973–18 987, 1994.
Harris, F. J.: On the use of windows for harmonic analysis with the discrete Fourier Transform, Proc. IEEE, 66, 51–83, 1978.
Hildebrand, P. H. and Sekhon, R. S.: Objective determination of the noise level in Doppler spectra, J. Appl. Meterol., 13, 808–811, 1974.
Hocking, W. K.: Observation and measurements of turbulence in the middle atmosphere by radar techniques: A review, Radio Sci., 20, 1403–1422, 1985.
Hocking, W. K.: Observation and measurements of turbulence in the middle atmosphere with a VHF radar, J. Atmos. Terr. Phys., 48, 655–670, 1986.
Hocking, W. K.: An assessment of the capabilities and limitations of radars in measurements of upper atmospheric turbulence, Adv. Space Res., 17(11), 37–47, 1996.
Hooper, D. A.: Signal and noise level estimation for narrow spectral width returns observed by the Indian MST radar, Radio Sci., 34, 859–870, 1999.
Jeffrey, P., Lindberg, C. R., and Venron III, F. L.: Multitaper Spec-tral Analysis of High Frequency Seismograms, J. Geophys. Res., Vol. 92, No. B12, November 10, 1987.
Rao, P. B., Jain, A. R., Kishore, P., Balamuralidhar, P., Damle, S. H., and Viswanathan, G.: Indian MST Radar, 1. System description and sample vector wind measurements in ST mode, Radio Sci., 30, 1125–1138, 1995.
Reidel, K. S. and Sidorenko, A.: Minimum Bias Multiple Taper Spectral Estimation, IEEE Transactions on Signal Processing, Vol. 43, No.1, January 1995.
Thomson, D. J.: Spectrum estimation and harmonic analysis, IEEE proc., 70, 1055–1096, 1982.


![[−2]proPSA versus ultrasensitive PSA fluctuations over time in the first year from radical prostatectomy, in an high-risk prostate cancer population: A first report](data:image/gif;base64,R0lGODlhAQABAIAAAP///wAAACH5BAEAAAAALAAAAAABAAEAAAICRAEAOw==)