Please cite this article as: Z. Akbarzadeh, A. H. Safaei Ghadikolaei, M. Madhoushi, H. Aghajani, A hybrid Fuzzy Multi-criteria Decision Making Model based on fuzzy DEMATEL with fuzzy Analytical Network Process and Interpretative Structural Model for Prioritizing LARG Supply Chain Practices, International Journal of Engineering (IJE), IJE TRANSACTIONS C: Aspects Vol. 32, No. 3, (March 2019) 413-423
International Journal of Engineering
J o u r n a l H o m e p a g e : w w w . i j e . i rA Hybrid Fuzzy Multi-criteria Decision Making Model Based on Fuzzy DEMATEL
with Fuzzy Analytical Network Process and Interpretative Structural Model for
Prioritizing LARG Supply Chain Practices
Z. Akbarzadeh, A. H. Safaei Ghadikolaei*, M. Madhoushi, H. Aghajani
Department of Industrial Management, University of Mazandaran, Babolsar, Iran
P A P E R I N F O
Paper history:
Received 02 January 2018
Received in revised form 29 March 2018 Accepted 27 May 2018
Keywords:
LARG Supply Chain LARG Practices FDANP Technique
Interpretative Structural Model Dairy Industries
A B S T R A C T
In recent years, taking advantage of LARG supply chain (SC) paradigm, a combination of four paradigms (clean, agile, resilience and green) has been increasingly employed. For capturing the advantages of LARG in SC, companies needed to recognize proper practices and implement them with appropriate planning and infrastructure. However, one of its deficiencies is lack of proper method in the prioritization of the LARG paradigms and practices as well as explanation of their relationship. Hence, the main contribution of this paper is to present a comprehensive approach to deal with inherent vagueness and uncertainty of the human decision process using fuzzy set theory, it aims to provide a quantitative basis via a hybrid fuzzy multi-criteria decision making (FMCDM) model that will make easy data collection and shall decrease the calculation. This model combines fuzzy decision making trial and evaluation laboratory (DEMATEL) with fuzzy analytical network process (ANP), i.e. FDANP, to determine the global weights of paradigms and practices and develop their impact relation map. Finally, the implementation of practice was prioritized by using interpretative structural model (ISM). It should be noted that, to measure the efficiency of this method, Iranian dairy industries as a case study was considered. With the help of obtained results, it can be determined the most and the least important practices and paradigms and prioritization of their implementation.
doi: 10.5829/ije.2019.32.03c.09
1. INTRODUCTION1
Supply Chain Management (SCM) utilizes some special methods for the planning of manufacturing and distribution activities in various decision making levels in order to have flow of materials, money and information in an effective way to meet the business requirements [1, 2]. Today, Supply Chain (SC) and logistics' operations have been identified as the most important activities in companies [3]; based on literature, its most frequently benefits are cost saving, inventory reduction, visibility increase and reduction in bullwhip effect [4]. In this regards, many researchers believe that applying appropriate paradigm in supply chain usually impacts on the company’s performance directly, especially for the main players [5]. In past two decades, four paradigms of lean, agile, resilient and green were the key paradigms of SC in the business and industrial fields.
*Corresponding Author Email: [email protected] (A. H. Safaei Ghadikolaei)
These changes necessitate the adoption of paradigm in the dairy industry SC that can reduce these concerns. The present study is seeking to use the LARG SC paradigm; because it is considered as the foundation of a competitive SC that could improve SC performance by eliminating processes that add no value, responding rapidly to changes in demand (in terms of both volume and variety), responding effectively to unexpected disturbances and reducing environmental risks and impacts. Given the above cases, the structuring of impact relations and determining the priority practice implementation to move towards LARG paradigm is of the great importance. Since, it provides the SC super-entity with the opportunity to take advantage of the LARG paradigm by using important practices in the SC domain.
Based on the above mentioned problem, a computational model is needed, which can fulfill the gap, increase the accuracy of decisions and reduce the required time. In this respect, the main purpose of the present research is to develop a functional decision making model, hybrid fuzzy multi-criteria decision making (FMCDM), that can improve the performance of LARG paradigm in dairy industries SC. Therefore, an efficient method for analyzing and identifying the relationship between LARG SC practices in dairy industry by using a novel application of combined fuzzy decision making trial and evaluation laboratory (FDEMATEL) with fuzzy analytic network process (FANP), FDANP, and interpretative structural model (ISM) can be considered as the main contributions of this paper.
In recent years, there are increasing applications of FMCDM in order to make an appropriate decision. One of the efficient FMCDM methods is novel combination of FDEMATEL with FANP, FDANP, as a powerful tool that reduces the number of pair wise comparison matrices and simplifies the calculating process [20]. In this novel approach, the total relation matrix of DEMATEL is converted to an initial super matrix with a joint process, which in DEMATEL is considered as a main system and ANP is sub-system [21]. In the traditional combined approach of ANP and DEMATEL, however, the ANP is considered as the main system of decision making and DEMATEL is applied as a sub–system, so that the inner dependence matrix of DEMATEL was part of the initial super matrix in ANP.
ISM is a qualitative and interpretive method in which the effect of each factor on other factors was studied [22]. It analyzes the relations with factor through decomposing them into several different levels [23]. ISM as an interactive learning process, constructs a set of various connected variables directly and indirectly as a comprehensive systematic model [24]. The model has formed the structure of a complex subject in an appropriate pattern using graphics as well as words. The
method helps recognition of the complex relationships between the variables of a system so the influence can be analyzed between the variables [25].
The structure of the rest of the paper will be as follows. In the next section a research on LARG practices will be extracted and localized in dairy industries SC. Followed by the importance of SC practices in dairy industries is determined and impact relations are structured among them. Finally, the priority of practice implementation will be conducted so that dairy companies can take advantage of the sustainable competitive advantage in today's turbulent markets.
2. LARG SUPPLY CHAIN
performance of the SC from three operational, economic, and environmental perspectives. Cruz et al. (2012a) provided a conceptual diagram to support the implementation of consistent practices in LARG SC management. Cruz et al. [16] provided a framework for assessing the compatibility of in practices to enhance the competitiveness of LARG SC. Cabral et al. [9, 28] used the network analysis process technique to select the best SC practices in the automotive industry. Cabral et al. [10] provided an information model to support the operation of integrated paradigms in automotive SC management. Maleki et al. [29] conducted an empirical-theoretical comparison of four lean, agile, resilient and green paradigms. Carvalho et al. [11] examined the divergences and commonalities among LARG paradigms and also examined the effect of SC practices on the functional characteristics of the SC. Azevedo et al. [6, 7] proposed a conceptual model for LARG SC paradigms aimed at improving the economic, operational and environmental performance of the SC.
3. RESEARCH METHODOLOGY
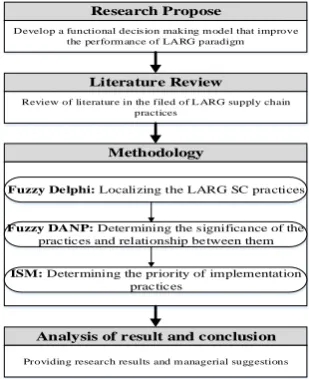
In this paper, a hybrid FMCDM approach based on FDANP and ISM for examining the situation of LARG SC practices in Iranian dairy industry has been suggested. The main data of the research were collected by field method and through the distribution of the questionnaire among experts, i.e. the faculty members and top managers of dairy industries with adequate knowledge and understanding of the concept of LARG SC. The first questionnaire was distributed among experts for localizing of lean, agile, resilient and green practices in dairy industries using of fuzzy Saaty Delphi’s method. The second questionnaire was distributed to determine the significance of the practices using a combination approach of FDANP that was distributed among industry experts. The third questionnaire used to determine the priority of implementation practices using ISM. A total of six questionnaires were distributed and collected that two of them were faculty members and four senior managers of dairy companies. Here the structure of the study (Figure1) and step by step stages are presented to achieve aim. The method is used to explain LARG SC practices and the relationships among them in dairy industry in the form of 10 steps as is described below.
3. 1. Identification of Lean, Agile, Resilient and Green Paradigms Practices Initially, according to literature review of the research a set of practices were related to the SC paradigms, i.e. lean, agile, resilient and green, are extracted and by conducting fuzzy Saaty Delphi’s method were localized. In order to localize, the experts specify the suitability of the practices by using linguistic variables in Table 1, in which we have L̃ki=
(aki, bki, cki), which represents the opinion of the kth expert to practice ith.
Then using Equation (1), the opinion of the experts is combined in which for ith practice we have L̃i=
(ai, bi, ci).
ai= min {aki}
(1) Number of experts 𝑘 = 1, 2, … , 𝑒
Number of practices𝑖 = 1, 2, … , 𝑛 bi=
1
e∑ bki
e k=1
ci= max {cki}
Experts' opinion is integrated by taking advantage of Equation (2), consequently, the fuzzy number will be changed to the crisp number. If the value Si is greater than eight [30], the corresponding practice is selected.
(2)
Si=
(ai+4 bi+ci)
6 , i = 1, 2, … , n
3. 2. Generating the Fuzzy Direct Relation Matrix In this step, the experts initially perform paired comparisons in terms of influencing and effectiveness of practices on each other using the linguistic variables of Table 2 [21]. Then, the expert's opinions are integrated with the mean arithmetic method and the fuzzy direct-relation matrix of the practices (Ãpr.) in which an n × n matrix is obtained (Equation (3)).
(3)
Ãpr.= [
0 ã12 ⋯ ã1n
ã21 0 0 ã2n
⋮ ⋮ ⋱ ⋮
ãn1 ãn2 ⋯ 0
]
3. 3. Normalizing the Fuzzy Direct-Relation Matrix The normalized fuzzy direct relation matrix of practices (X̃pr.) can be calculated using Equations (4)-(6).
Research Propose
Develop a functional decis ion making m odel that improve the perform ance of LARG paradigm
Literature Review
Review of literature in the filed of L ARG supply chain practices
Methodology
Fuzzy Delphi: Localizing the LARG SC practices
Fuzzy DANP: Determining the significance of the practices and relationship between them
ISM: Determining the priority of implementation
practices
Analysis of result and conclusion
Providing research results and m anagerial suggestions
TABLE 1. Fuzzy Delphi triangular numbers [30]
Linguistic variables Fuzzy triangular numbers
Absolutely inappropriate (1, 0,0)
Inappropriate (3, 1,0)
Fairly inappropriate (5, 3,1)
Indifferent (7, 5,3)
Fairly appropriate (9, 7,5)
Appropriate (10, 9,7)
Absolutely appropriate (10, 10,9)
TABLE 2. Triangular numbers of the practices interactions [31]
Linguistic Variables Fuzzy triangular numbers
No influence (1, 0,0)
Very low influence (2, 1,0)
Low influence (3, 2,1)
High influence (4, 3,2)
Very high influence (4, 3,3)
3. 4. Attaining the Fuzzy Total-Relation Matrix of Practices and Paradigms After obtaining the
X
̃pr.matrix, the fuzzy relation matrix of the practices (T̃pr.) can be calculated employing Equation (7), where I is an identity matrix.
X ̃pr.= [
x̃11 x̃12 ⋯ x̃1n
x̃21 x̃22 ⋯ x̃2n
⋮ ⋮ ⋱ ⋮
x̃n1 x̃n2 ⋯ x̃nn
] (4)
where:
x̃ij=
ãij
r̃ = ( lij
r, mij
r , uij
r) (5)
𝑟 = 𝑚𝑎𝑥𝑖,𝑗(𝑚𝑎𝑥1≤𝑖≤𝑛∑𝑛𝑗=1𝑢𝑖𝑗, 𝑚𝑎𝑥1≤𝑗≤𝑛∑𝑛𝑖=1a)
, 𝑖, 𝑗𝜖 (1, 2, ⋯ , 𝑛)
(6)
T̃pr.= X̃pr.(I − X̃pr.)−1 (7)
It is worth mentioning that fuzzy total relation matrix of the paradigms T̃Pa. (Equation (8)) is obtained by enforcing the arithmetic mean of each block in fuzzy total relation matrix of practices T̃pr..
(8)
𝑇̃𝑃𝑎.=
[
𝑡̃𝑃𝑎.11 … 𝑡̃𝑃𝑎. 1𝑗
… 𝑡̃𝑃𝑎.1𝑛
⋮ ⋮ ⋮
𝑡̃𝑃𝑎.𝑖1 … 𝑡̃𝑃𝑎. 𝑖𝑗
… 𝑡̃𝑃𝑎.𝑖𝑛
⋮ ⋮ ⋮
𝑡̃𝑃𝑎.𝑛1 … 𝑡̃𝑃𝑎. 𝑛𝑗
… 𝑡̃𝑃𝑎.𝑛𝑛]
3. 5. Drawing the Cause-Effect Diagram of Paradigms and Practices After estimating the fuzzy total relation, matrices of paradigms (T̃Pa.) and practices (T̃pr.), D̃i+ R̃i and D̃i− R̃i are calculated for paradigms and practices. D̃iand R̃iare equal to the sum of rows and columns elements of the fuzzy total relation matrix of paradigms and practices (Equations 9-10).
D̃i= ∑nj=1t̃ij , i = 1,2, … , n (9)
R̃i= ∑ni=1t̃ij , j = 1,2, … , n (10)
In order to form the cause-effect diagram of paradigms and practices, each of the above components is defuzzified by the mean method. (D̃i+ R̃i)defconstitutes the horizontal axis of the diagram and (D̃i− R̃i)def the vertical axis of the diagram. In general, when (D̃i− R̃i)
def
is positive, it will be categorized as cause group and effective group otherwise.
3. 6. Forming the Initial Super Matrix In this step, fuzzy total relation matrix of practices (T̃pr.) is normalized in the row in which the components of each row (in each block) of practices fuzzy total relation matrix are divided into the sum of the related row elements. For example, 𝑇̃𝑝𝑟.𝛼11, which is related to the first block, as shown in Equation (11). Equation (12) shows the normalized fuzzy total relation matrix of practices (𝑇̃𝑝𝑟.𝛼 ). The matrix T̃pr.α will be defuzzified by the mean method and then transposed. The resulting matrix is called the initial super-matrix (unweight) (Equation 13). i.e.: 𝑊 = (𝑇𝑝𝑟.𝛼)
′
.
3. 7. Obtaining the Weighted Super Matrix In this step, at first, the fuzzy total relation matrix of paradigms (T̃Pa.) is normalized in the row and the matrix T̃Paα is calculated (Equation 14). Then, the matrix T̃Pa α is defuzzified with the mean method and transposed, i.e.
(TPa.α )′. Finally, using Equation (15), the weighted supermatrix is obtained.
𝑑̃11𝑝𝑟.𝑖= (∑𝑚1𝑗=1𝑢𝑖𝑗11,∑𝑚1𝑗=1𝑢11𝑖𝑗,∑𝑚1𝑗=1𝑢𝑖𝑗11); 𝑖 = 1,2, … 𝑚1
𝑇̃𝑝𝑟.𝛼11=
[
𝑡̃𝑝𝑟.1111 ⁄𝑑̃𝑝𝑟.111 … 𝑡̃𝑝𝑟.1𝑗11 ⁄𝑑̃𝑝𝑟.111 … 𝑡̃𝑝𝑟.1𝑚1
11 𝑑̃
𝑝𝑟.1 11
⁄
⋮ ⋮ ⋮
𝑡̃𝑝𝑟.𝑖111 ⁄𝑑̃𝑝𝑟.𝑖11 … 𝑡̃𝑝𝑟.𝑖𝑗11 ⁄𝑑̃𝑝𝑟.𝑖11 … 𝑡̃𝑝𝑟.𝑖𝑚1
11 𝑑̃
𝑝𝑟.𝑖 11
⁄
⋮ ⋮ ⋮
𝑡̃𝑝𝑟.𝑚11
11 𝑑̃
𝑝𝑟.𝑚1
11
⁄ … 𝑡̃𝑝𝑟.𝑚1𝑗
11 𝑑̃
𝑝𝑟.𝑚1
11
⁄ … 𝑡̃𝑝𝑟.𝑚1
11 𝑑̃
𝑝𝑟.𝑚1
11
⁄ ]
=
[
𝑡̃𝑝𝑟.11𝛼11 … 𝑡̃𝑝𝑟.1𝑗𝛼11 … 𝑡̃𝑝𝑟.1𝑚1
𝛼11
⋮ ⋮ ⋮
𝑡̃𝑝𝑟.𝑖1𝛼11 … 𝑡̃𝑝𝑟.𝑖𝑗𝛼11 … 𝑡̃𝑝𝑟.𝑖𝑚1
𝛼11
⋮ ⋮ ⋮
𝑡̃𝑝𝑟.𝑚11
𝛼11 … 𝑡̃
𝑝𝑟.𝑚𝛼111𝑗 … 𝑡̃𝑝𝑟.𝑚1
𝛼11
]
(12 )
𝑇̃𝑝𝑟.𝛼 =
𝑝𝑟.11 𝑃𝑎.1 𝑃𝑎.𝑖 𝑃𝑎.1
𝑃𝑎.1 𝑝𝑟.12 𝑝𝑟.11. . 𝑝𝑟.1𝑚1 𝑝𝑟.𝑖1. . 𝑝𝑟.𝑖𝑚𝑖 𝑝𝑟.𝑛1. . 𝑝𝑟.𝑛𝑚𝑛
⋮ 𝑃𝑎.𝑗 ⋮ 𝑃𝑎.𝑛 ⋮ 𝑝𝑟.1𝑚1 𝑝𝑟.𝑗1 𝑝𝑟.𝑗2 ⋮ 𝑝𝑟.𝑗𝑚 𝑖 𝑝𝑟.𝑛1 𝑝𝑟.𝑛1
𝑝𝑟.𝑗𝑚𝑛 [
𝑇𝛼11 …
⋮
𝑇𝛼1𝑗 …
⋮
𝑇𝛼1𝑛
⋮
𝑇𝛼𝑖1 … 𝑇𝛼𝑖𝑗 … 𝑇𝛼𝑖𝑛
⋮ ⋮ ⋮
𝑇𝛼𝑛1 … 𝑇𝛼𝑛𝑗 … 𝑇𝛼𝑛𝑛]
𝑤 = (𝑇𝑝𝑟.𝛼) ′
=
𝑝𝑟.11 𝑃𝑎.1 𝑃𝑎.𝑖 𝑃𝑎.1
𝑃𝑎.1 𝑝𝑟.12 𝑝𝑟.11. . 𝑝𝑟.1𝑚1 𝑝𝑟.𝑖1. . 𝑝𝑟.𝑖𝑚𝑖 𝑝𝑟.𝑛1. . 𝑝𝑟.𝑛𝑚𝑛
⋮ 𝑃𝑎.𝑗 ⋮ 𝑃𝑎.𝑛 ⋮ 𝑝𝑟.1𝑚1 𝑝𝑟.𝑗1 𝑠𝑗2 ⋮ 𝑝𝑟.𝑗𝑚𝑖
𝑝𝑟.𝑛1 𝑝𝑟.𝑛1
𝑝𝑟.𝑗𝑚𝑛 [
𝑊11 …
⋮
𝑊𝑖1 …
⋮
𝑊𝑛1
⋮
𝑊1𝑗 … 𝑊𝑖𝑗 … 𝑊𝑛𝑗
⋮ ⋮ ⋮
𝑊1𝑛 … 𝑊𝑖𝑛 … 𝑊𝑛𝑛]
(13 )
𝑇̃𝑃𝑎.𝛼 =
[
𝑡̃𝑃𝑎.𝛼11 … 𝑡̃𝑃𝑎. 𝛼1𝑗
… 𝑡̃𝑃𝑎.𝛼1𝑛
⋮ ⋮ ⋮
𝑡̃𝑃𝑎.𝛼𝑖1 … 𝑡̃𝑃𝑎. 𝛼𝑖𝑗
… 𝑡̃𝑃𝑎.𝛼𝑖𝑛
⋮ ⋮ ⋮
𝑡̃𝑃𝑎.𝛼𝑛1 … 𝑡̃𝑃𝑎. 𝛼𝑛𝑗
… 𝑡̃𝑃𝑎.𝛼𝑛𝑛]
(14(
𝑊𝛼= (𝑇 𝑃𝑎.𝛼)′. 𝑊
=
[
(𝑡𝑃𝑎.𝛼11) × 𝑊11 … (𝑡𝑃𝑎.𝛼𝑖1) × 𝑊𝑖1 … (𝑡𝑃𝑎.𝛼𝑛1) × 𝑊𝑛1
⋮ ⋮ ⋮
(𝑡𝑃𝑎.𝛼1𝑗) × 𝑊1𝑗 … (𝑡
𝑃𝑎.𝛼𝑖𝑗) × 𝑊𝑖𝑗 … (𝑡𝑃𝑎.𝛼𝑛𝑗) × 𝑊𝑛𝑗
⋮ ⋮ ⋮
(𝑡𝑃𝑎.𝛼1𝑛) × 𝑊1𝑛 … (𝑡𝑃𝑎.𝛼𝑖𝑛) × 𝑊𝑖𝑛 … (𝑡𝑃𝑎.𝛼𝑛𝑛) × 𝑊𝑛𝑛]
(15)
3. 8. Limiting the Weighted Super Matrix This matrix is calculated by Equation (16), which shows the final weight of each practice (wxi).
2 k + 1
The final super matrix = (weighted supermatrix) (16)
3. 9. Calculating Paradigm's Weight The significance of each paradigm i.e. the lean, agile, resilient and green paradigms (Wx) is computed by using Equations (17 and 18) [32].
(17)
wx= {(D̃idef+ R̃defi ) 2
+ (D̃idef− R̃defi ) 2
}
1 2
(18)
Wx=∑wxw
x G x=L
3. 10. Determining the Priority of Practice Implementation The priority of the LARG practice
implementation is determined based on the effective strength and degree of dependence using the ISM method as below [22]:
3. 10. 1. Establishing Contextual Relationship A contextual relationship is established out of mentioned practices to identify the practice pairs which should be examined.
3. 10. 2. Attaining Self-Interaction Matrix (SSIM) A structural self-interaction matrix (SSIM) is developed for practices, indicating pair-wise relationships among the practices of the system under consideration.
3. 10. 3. Attaining Reachability Matrix Reachability matrix is obtained from SSIM and the matrix is checked for transitivity. Transitivity of contextual relation is a fundamental assumption in ISM. It states that if variable A is related to B and B to C, then A is necessarily related to C. Then, the reachability matrix is partitioned into different levels.
3. 10. 4. Developing Digraph Based on relationships stated in the reachability matrix, a directed graph is drawn and transitive links removed. The resultant digraph is converted into an ISM, by replacing variable nodes with statements. Then, the developed ISM model is checked for conceptual inconsistency and necessary modifications are made. This model can be used for analyzing and identifying the implementation priority of practices.
4. RESEARCH FINDINGS
In the first step, 166 practices were extracted from the literature review of the research, of which 52 practices (32%) are lean SC, 32 practices (19%), agile SC, 42 practices (25%) resilient SC, and 40 practices (24%) green SC. After localization, 21 practices were selected, which 5 practices (24%) are lean, agile and green SC and 6 practices (28%) are resilient SC (Table 3).
In the second step, fuzzy direct relation matrix of practices was performed by experts using paired comparisons (Table 4). The reliability of the fuzzy direct-relation matrix of practices is 97.83%, which indicates the high validity of this table. In step 3, the fuzzy direct-relation matrix of practices was normalized, and in step 4, the fuzzy total relation matrix of the practices and paradigms was calculated. The fuzzy total relation matrix of paradigms is shown in Table 5.
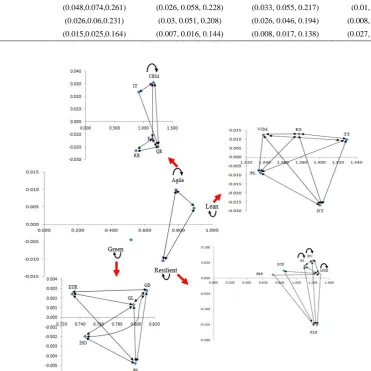
According to Figure 2, CRM and IT were in the cause group and F, QR and RR in effect group. Information technology has a direct impact on quick responsiveness to customer's needs.
Therefore, the creation of the necessary infrastructure for the use of information technology can play a significant role in response acceleration to customers need. Therefore, the creation of the necessary infrastructure for the use of information technology can play a significant
role in increasing the quickness of responsiveness to customers.
Regarding the cause-effect diagram of resilient SC practices (Figure 2), just RLR was in the effect group and other practices were found in the cause group. DV is considered to be the most effective practice. It should be noted that minimum level of service while undergoing disruptions has the greatest interaction with other resilient practices, which is very important.
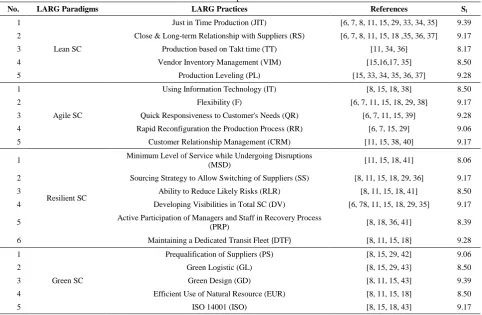
TABLE 3. Selected practices of LARG SC
No. LARG Paradigms LARG Practices References Si
1
Lean SC
Just in Time Production (JIT) [6, 7, 8, 11, 15, 29, 33, 34, 35] 9.39
2 Close & Long-term Relationship with Suppliers (RS) [6, 7, 8, 11, 15, 18 ,35, 36, 37] 9.17
3 Production based on Takt time (TT) [11, 34, 36] 8.17
4 Vendor Inventory Management (VIM) [15,16,17, 35] 8.50
5 Production Leveling (PL) [15, 33, 34, 35, 36, 37] 9.28
1
Agile SC
Using Information Technology (IT) [8, 15, 18, 38] 8.50
2 Flexibility (F) [6, 7, 11, 15, 18, 29, 38] 9.17
3 Quick Responsiveness to Customer's Needs (QR) [6, 7, 11, 15, 39] 9.28
4 Rapid Reconfiguration the Production Process (RR) [6, 7, 15, 29] 9.06
5 Customer Relationship Management (CRM) [11, 15, 38, 40] 9.17
1
Resilient SC
Minimum Level of Service while Undergoing Disruptions
(MSD) [11, 15, 18, 41] 8.06
2 Sourcing Strategy to Allow Switching of Suppliers (SS) [8, 11, 15, 18, 29, 36] 9.17
3 Ability to Reduce Likely Risks (RLR) [8, 11, 15, 18, 41] 8.50
4 Developing Visibilities in Total SC (DV) [6, 78, 11, 15, 18, 29, 35] 9.17
5 Active Participation of Managers and Staff in Recovery Process
(PRP) [8, 18, 36, 41] 8.39
6 Maintaining a Dedicated Transit Fleet (DTF) [8, 11, 15, 18] 9.28
1
Green SC
Prequalification of Suppliers (PS) [8, 15, 29, 42] 9.06
2 Green Logistic (GL) [8, 15, 29, 43] 8.50
3 Green Design (GD) [8, 11, 15, 43] 9.39
4 Efficient Use of Natural Resource (EUR) [8, 11, 15, 18] 8.50
5 ISO 14001 (ISO) [8, 15, 18, 43] 9.17
TABLE 4. The Fuzzy Direct Relation Matrix of Practices (Ãpr.)
JIT RS TT VIM PL … PS GL GD EUR ISO
JIT (0,0,1) (2.17,2.83,3.
83) (3,3,4) (3,3,4) (3,3,4) … (0,0,1) (0,0,1) (0,0,1) (0,0,1) (0,0,1)
RS (2.67,3,
4) (0,0,1)
(2.83,3 ,4)
(2.17,2.83,3 .83)
(2.67,3
,4) … (2.67,3,4)
(2.17,2.83,3 .83)
(1.83,2.67,3
.67) (0,0,1)
(1.83,2.67,3. 67)
TT (3,3,4) (2.67,3,4) (0,0,1) (2.83,3,4) (2.83,3
,4) … (0,0,1) (0,0,1) (0,0,1) (0,0,1) (0,0,1)
… … … … …
GD (0,0,1) (2,2.67,3.67
) (0,0,1) (0,0,1) (0,0,1) … (3,3,4) (2.33,3,4) (0,0,1) (2.5,3,4) (2.33,3,4)
EUR (0,0,1) (0,0,1) (2.5,3,
4) (0,0,1)
(2.67,3
,4) … (2.5,3,4)
(1.86,2.67,3
.67) (2.33,3,4) (0,0,1)
(1.86,2.67,3. 67)
ISO (0,0,1) (2.5,3,4) (0,0,1) (0,0,1) (0,0,1) … (3,3,4) (2.5,3,4) (2.33,3,4) (1.33,2.33,3
.33) (0,0,1)
Inconsistent rate (%)= 1
n(n−1)∑ ∑ [(aij
6− a
ij
5) a
ij 6
⁄ ]
n
j=1 × 100% =
n
TABLE 5. The fuzzy total relation matrix of paradigms (𝑇̃𝑝𝑎.)
Lean Agile Resilient Green
Lean (0.055, 0.078,0.28) (0.048,0.074,0.258) (0.04, 0.063, 0.238) (0.015, 0.025, 0.167)
Agile (0.048,0.074,0.261) (0.026, 0.058, 0.228) (0.033, 0.055, 0.217) (0.01, 0.019, 0.15)
Resilient (0.026,0.06,0.231) (0.03, 0.051, 0.208) (0.026, 0.046, 0.194) (0.008, 0.017, 0.137)
Green (0.015,0.025,0.164) (0.007, 0.016, 0.144) (0.008, 0.017, 0.138) (0.027, 0.049, 0.147)
Figure 2. The cause-effect diagram of paradigms and practices
As shown in Figure 2, GD, EUR and GL were in cause group and the ISO certification and PS in the effect group. Green design is both the most influential practice and has the most interaction with other practices, which indicates the high importance of this practice.
In step six, using the fuzzy total relation matrix of practices (T̃pr.), the initial super-matrix was formed (Table 6) and then weighted super matrix was calculated (Table 7). In step eight, the weighted super matrix was converged in 15th power and limited super matrix was computed that shows the global weight of practices. As shown in Table 8, just in time (JIT, 0.0657) and production based on Takt time (TT, 06.051) are considered the most important practices and active participation of managers and staff in the recovery process (PRP, 0.0219) the least important practices in dairy industries SC.
In the ninth step, the significance of paradigms was calculated and prioritized using the fuzzy DEMATEL method. The importance of lean SC paradigm is 0.307, agile SC 0.270, the resilient SC 0.244 and the green SC 0.178. Lean and green paradigms are the most important and the least important paradigms in the dairy industries SC, respectively.
the relationship with suppliers, and developing visibility, have the highest priority in the deployment of dairy industries SC and serve as the basis for the deployment
of other practices, because they affect all the practices. Interestingly, green SC practices have the lowest priority for deployment due to their effectiveness.
TABLE 6. Initial Super Matrix W = (Tpr.α ) ′
JIT RS TT VIM PL … PS GL GD EUR ISO
JIT 0.079 0.105 0.109 0.109 0.108 … 0.071 0.073 0.073 0.068 0.07
RS 0.101 0.078 0.104 0.100 0.105 … 0.132 0.121 0.121 0.076 0.131
TT 0.108 0.105 0.079 0.108 0.108 … 0.072 0.074 0.075 0.117 0.071
… … … …
GD 0.078 0.104 0.076 0.079 0.076 … 0.125 0.121 0.067 0.119 0.122
EUR 0.076 0.068 0.122 0.077 0.124 … 0.113 0.106 0.113 0.064 0.099
ISO 0.067 0.094 0.065 0.067 0.065 … 0.119 0.114 0.111 0.105 0.059
TABLE 7. Weighted Super Matrix
JIT RS TT VIM PL … PS GL GD EUR ISO
JIT 0.011 0.015 0.016 0.016 0.016 … 0.008 0.008 0.008 0.008 0.008
RS 0.015 0.011 0.015 0.015 0.015 … 0.015 0.014 0.014 0.009 0.015
TT 0.016 0.015 0.012 0.016 0.016 … 0.008 0.009 0.009 0.013 0.008
… … … …
GD 0.006 0.008 0.006 0.006 0.006 … 0.016 0.016 0.009 0.016 0.016
EUR 0.006 0.005 0.009 0.006 0.009 … 0.015 0.014 0.015 0.008 0.013
ISO 0.005 0.007 0.005 0.005 0.005 … 0.016 0.015 0.015 0.014 0.008
TABLE 8. Degree of importance and rank of practices
JIT RS TT VIM PL IT F QR RR CRM
Degree of
importance 0.0657 0.0644 0.0651 0.0605 0.0602 0.045 0.0589 0.0617 0.045 0.0597
Rank 1 3 2 5 6 13 8 4 14 7
MSD SS RLR DV PRP DTF PS GL GD EUR ISO
Degree of
importance 0.0477 0.0474 0.0503 0.0478 0.0219 0.0317 0.0333 0.0347 0.0349 0.0338 0.300
Rank 11 12 9 10 21 19 18 16 15 17 20
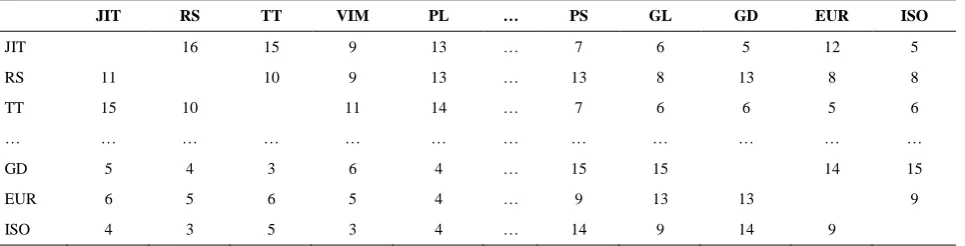
TABLE 9. Results from questionnaires
JIT RS TT VIM PL … PS GL GD EUR ISO
JIT 16 15 9 13 … 7 6 5 12 5
RS 11 10 9 13 … 13 8 13 8 8
TT 15 10 11 14 … 7 6 6 5 6
… … … …
GD 5 4 3 6 4 … 15 15 14 15
EUR 6 5 6 5 4 … 9 13 13 9
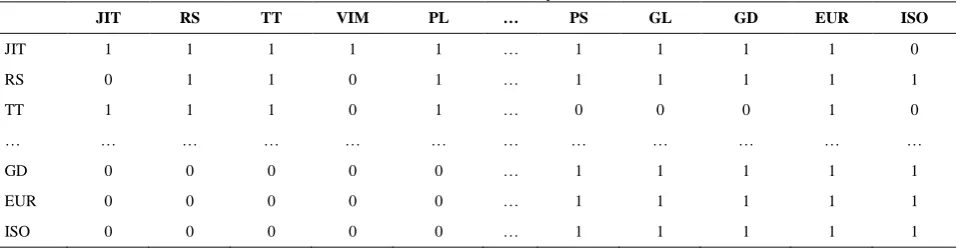
TABLE 10. Reachability matrix
JIT RS TT VIM PL … PS GL GD EUR ISO
JIT 1 1 1 1 1 … 1 1 1 1 0
RS 0 1 1 0 1 … 1 1 1 1 1
TT 1 1 1 0 1 … 0 0 0 1 0
… … … …
GD 0 0 0 0 0 … 1 1 1 1 1
EUR 0 0 0 0 0 … 1 1 1 1 1
ISO 0 0 0 0 0 … 1 1 1 1 1
Figure 3. Interpretative Structural Model
5. CONCLUSION AND SUGGESTION
ARG SC management is a social-technical system that its main purpose is to reduce waste, respond effectively to changing customers' requirements, adapt to new environmental risks and adopt environment-friendly policies and practices. The LARG SC, as a new paradigm, plays an important role in gaining the sustainable competitive advantage, which has attracted much attention from the researchers in recent years. However, many researchers focused solely on the impact of LARG paradigm on the strength of competitiveness and SC performance or examined the extent to which the SC practices were consistent, and less attention was paid to introducing practices and clarifying the relationships between them in order to move towards LARG. Therefore, the present research has provided a coherent approach to identify LARG practices, structure effectiveness relationships and determine the priority of their deployment so that companies active in the SC of dairy industries create the necessary infrastructures to apply the most important practices to gain competitive advantage. It should be noted that the approach employed in the present study will significantly reduce the volume of computations so that only using a paired comparisons matrix can determine the significance of the paradigms and practices, and draw the map of cause-effect relationships of the paradigms and practices. The results
indicate that, lean and green are the most and the least important SC paradigms, respectively. Also, the most effective and the most affected paradigms are agile and resilient. Just in time and production based on takt time are considered the most important practices and active participation of managers and staff in the recovery process is the least important practices. In addition, just in time, takt time, relationships with suppliers and developing visibility in SC have the highest priority in order to implement in dairy SC.
According to the results, being lean is one of the most important paradigms in the SC, on the one hand, and has the most interaction with other paradigms, on the other hand. Since researchers believe that being lean is a pre-requisite for agility [44, 45]; therefore companies active in dairy industries SC should be more focused on implementing and employing lean principles, so that they can provide an appropriate infrastructure to implement the agility paradigm, and subsequently the resilient and green paradigms.
According to the findings of the present research, it is suggested that companies active in the dairy industries SC have replaced the close relationship and win-win trust with suppliers with win-loss and develop cooperative and sustainable relationships with them. In addition, it improves relationships with customer by more interaction with customers, collecting and analyzing data on company’s customers, and generally focusing on customers keeping and maintaining. Active companies in the chain supply should share information on the ordering and transportation of products and logistics activities with other actors of SC with the accurate planning and reciprocal trust-based approach in order to provide the correct decision by increasing the accuracy and velocity of information transmission.
Despite the contributions of this paper, limitations of the study should be noted. First, the proposed practices have focused on dairy industry and may not be applicable to different sector. Second, the research's data are connected to the Iranian case study, we cannot be sure that these results will be usable for another geographical area. It is suggested that in further researches, other FMCDM techniques such as FTOPSIS, FELECTRE, and FPROMETHEE be used for ranking companies based on their performance in term of implementation level of these practices.
6. REFERENCES
1. Fard, A. M. F., Gholian-Jouybari, F., Paydar, M. M., & Hajiaghaei-Keshteli, M., “A Bi-Objective Stochastic Closed-loop Supply Chain Network Design Problem Considering Downside Risk”, Industrial Engineering and Management System, Vol. 16, (2017), 342-362.
2. Nourmohamadi Shalke, P., Paydar, M. M., & Hajiaghaei-Keshteli, M., “Sustainable supplier selection and order allocation through quantity discounts”, International Journal of
Management Science and Engineering Management, (2017),
2-13.
3. Sahraeian, R., Bashiri, M., & Moghadam, A. T., “Capacitated multimodal structure of a green supply chain network considering multiple objectives”, International Journal of
Engineering-Transactions C: Aspects, Vol. 26, No. 9, (2013), 963-974.
4. Moubed, M., & Mehrjerdi Zare, Y., “A hybrid dynamic programming for inventory routing problem in collaborative reverse supply chains”, International Journal of Engineering,
Transactions A: Basics, Vol. 29, No. 10, (2016), 1412-1420.
5. Fard, A. M. F., & Hajaghaei-Keshteli, M., “A tri-level location-allocation model for forward/reverse supply chain”, Applied Soft
Computing, Vol. 62, (2018), 328-346.
6. Azevedo, S. G., Carvalho, H., & Machado, V. C. “The influence of LARG supply chain management practices on manufacturing supply chain performance”, In Proceedings of International Conference on Economics, Business and Marketing Management, (2011), 1-6.
7. Azevedo, S. G., Carvalho, H., & Machado, V. C., “A proposal of LARG supply chain management practices and a performance measurement system”,International Journal of Education,
e-Business, e-Management and e-Learning, Vol. 1, (2011), 7-14.
8. Azevedo, S., Carvalho, H., & Cruz-Machado, V., “Proposal of a conceptual model to analyse the influence of LARG practices on manufacturing supply chain performance”, Journal of Modern Accounting & Auditing, Vol. 8, (2012), 174-184.
9. Cabral, I., Espadinha-Cruz, P., Grilo, A., Puga-Leal, R., & Cruz-:Machado, V., “Decision-Making Models for Interoperable Lean, Agile, Resilient and Green Supply Chains”, In Proceedings of the International Symposium on the Analytic Hierarchy Process, (2011), 1-6.
10. Cabral, I., Grilo, A., Leal, R. P., & Machado, V. C., “Modeling Lean, Agile, Resilient, and Green Supply Chain Management”, Information Technology Interfaces (ITI), Proceedings of the ITI 2011 33rd International Conference on IEEE, (2011), 365-370. 11. Carvalho, H., Duarte, S., & Cruz Machado, V., “Lean, agile,
resilient and green: divergencies and synergies”, International
Journal of Lean Six Sigma, Vol. 2, (2011), 151-179.
12. Maleki, M., Shevtshenko, E. & Machado, V. C., “Development of Supply Chain Integration model through application of Analytic Network Process and Bayesian Network”, International
Journal of Integrated Supply Management, Vol. 8,
(2013),67-89.
13. Maleki, M., & Machado, V. C., “Generic integration of lean, agile, resilient, and green practices in automotive supply chain”, Revista de Management Comparat International, Vol. 14, (2013), 237-248.
14. Carvalho, H., Azevedo, S. & Cruz-Machado, V., “Trade-offs among lean, agile, resilient and green paradigms in supply chain management: a case study approach”, In Proceedings of the Seventh International Conference on Management Science and Engineering Management, (2014), 953-968.
15. Cruz, E. P., Cabral, I., & Grilo, A., “LARG Interoperable Supply Chains: from Cooperation Analysis to Design”, In Intelligent Decision Technologies: Proceedings of the 5th KES
International Conference on Intelligent Decision Technologies,
Vol. 255, (2013), 255.
16. Cruz, E. P., Cabral, I., Grilo, A., & Cruz-Machado, V., “Information model for LARGeSCM interoperable practices”, In Information Technology Interfaces (ITI), Proceedings of the ITI 34th International Conference on IEEE, (2012a), 23-28. 17. Cruz, E. P., Grilo, A., & Cruz-Machado, V., “Fuzzy evaluation
model to assess interoperability in LARG Supply Chains”, In Fuzzy Systems and Knowledge Discovery (FSKD), 9th International Conference on IEEE, (2012b), 75-79.
18. Santos, J. P. P. D. “A simulation model for Lean, Agile, Resilient and Green Supply Chain Management: practices and interoperability assessment”, Doctoral dissertation, Faculdade de Ciências e Tecnologia, (2013).
19. Donk, P. V. D., Akkerman, R., & Van der Vaart, T., “Opportunities and realities of supply chain integration: the case of food manufacturers”, British Food Journal, Vol. 110, (2008), 218-235.
20. Gölcük, İ., & Baykasoğlu, A. “An analysis of DEMATEL approaches for criteria interaction handling within ANP” Expert
Systems with Applications, Vol. 46, (2016). 346-366.
21. Ghadikolaei, A. H. S., Akbarzadeh, Z., Ahmadi, A., & Geshniani, Y. V., “Applying hybrid FMADM model for analysing SWOT strategies at the Iranian industrial engines manufacturing firm (a case study)”, International Journal of Productivity and Quality
Management, Vol. 20, (2017), 462-487.
22. Beikkhakhian, Y., Javanmardi, M., Karbasian, M. & Khayambashi, B., “The application of ISM model in evaluating agile supplier's selection criteria and ranking suppliers using fuzzy TOPSIS-AHP methods”, Expert Systems with
Applications, Vol. 42, no. 15-16 (2015), 6224-6236.
23. Kannan, G., Pokharel, S., & Sasi Kumar, P., “A hybrid approach using ISM and fuzzy TOPSIS for the selection of reverse logistics provider. Resources”, Conservation and Recycling, Vol. 54, (2009), 28–36.
24. Attri, R., Dev, N., & Sharma, V., “Interpretive structural modeling (ISM) approach: an overview”, Research Journal of
Management Sciences, 2319, (2013), 1171.
25. Pfohl, H. C., Gallus, P., & Thomas, D.,“Interpretive structural modeling of supply chain risks”, International Journal of
Physical Distribution & Logistics Management, Vol. 41, No. 9,
(2011). 839-859.
26. Cheraghalipour, A., Paydar, M. M., & Hajiaghaei-Keshteli, M., “An integrated approach for collection center selection in reverse logistics”, International Journal of Engineering, Transactions
A: Basics, Vol. 30, (2017), 1005-1016.
27. Carvalho, Helena; Cruz Machado, V, “Lean, agile, resilient and green supply chain: a review”, Proceedings of the Third International Conference on Management Science and Engineering Management, Thailand, (2009), 3–14.
management”, International Journal of Production
Research, Vol. 50, (2012), 4830-4845.
29. Maleki, M., da Cruz, P. E., Valente, R. P., & Machado, V. C., “Supply Chain Integration Methodology: LARGe Supply Chain”, Encontro Nacional de Engenharia e Gestão Industrial, (2011), 57-66.
30. Jassbi, A., Jassbi, J., Akhavan, P., Chu, M. T., & Piri, M., “An empirical investigation for alignment of communities of practice with organization using fuzzy Delphi panel”, VINE, Vol. 45, (2015), 322-343.
31. Liou, J. J., Yen, L., & Tzeng, G. H., “Building an effective safety management system for airlines”, Journal of Air Transport
Management, Vol. 14, (2008), 20-26.
32. Dalalah, D., Hayajneh, M., & Batieha, F., “A fuzzy multi-criteria decision making model for supplier selection”, Expert systems
with applications, Vol. 38, (2011), 8384-8391.
33. Büyüközkan, G., Kayakutlu, G., & Karakadılar, İ. S., “Assessment of lean manufacturing effect on business performance using Bayesian Belief Networks”, Expert Systems
with Applications, Vol. 42, No. 19, (2015), 6539-6551.
34. Netland, T. H., Schloetzer, J. D., & Ferdows, K, “Implementing corporate lean programs: the effect of management control practices”, Journal of Operations Management, Vol. 36, (2015), 90-102.
35. Sharma, V., Dixit, A. R., & Qadri, M. A., “Impact of lean practices on performance measures in context to Indian machine tool industry”, Journal of Manufacturing Technology
Management, Vol. 26, No. 8, (2015), 1218-1242.
36. Birkie, S. E., “Operational resilience and lean: In search of synergies and tradeoffs”, International Journal of
Manufacturing Technology and Management (IJMTM), Vol.
27, No. 2, (2016), 185-207.
37. Nawanir, G., Nawanir, G., Lim, K. T., Lim, K. T., Othman, S. N., & Othman, S. N., “Lean manufacturing practices in Indonesian
manufacturing firms: Are there business performance effects?”, International Journal of Lean Six Sigma, Vol. 7, No. 2, (2016), 149-170.
38. Mehralian, G., Zarenezhad, F., & Rajabzadeh Ghatari, A., “Developing a model for an agile supply chain in pharmaceutical industry”, International Journal of Pharmaceutical and
Healthcare Marketing, Vol. 9, No. 1, (2015), 74-91.
39. Tse, Y. K., Zhang, M., Akhtar, P., & MacBryde, J., “Embracing supply chain agility: an investigation in the electronics industry”, Supply Chain Management: An International
Journal, Vol. 21, No. 1, (2016), 140-156.
40. Durrani, U. K., Pita, Z., & Richardson, J., “Coexistence of agile and SCM practices: an exploratory study of Australian agile software development organizations”, Journal of Systems and
Information Technology, Vol. 16, No. 1, (2014), 20-39.
41. Francis, R., & Bekera, B, “A metric and frameworks for resilience analysis of engineered and infrastructure systems”, Reliability
Engineering & System Safety, Vol. 121, (2014), 90-103.
42. Hoejmose, S. U., Grosvold, J., & Millington, A., “The effect of institutional pressure on cooperative and coercive ‘green’supply chain practices”, Journal of Purchasing and Supply
Management, Vol. 20, No. 4, (2014), 215-224.
43. Govindan, K., Khodaverdi, R., & Vafadarnikjoo, A., “Intuitionist fuzzy based DEMATEL method for developing green practices and performances in a green supply chain”, Expert Systems with
Applications, Vol. 42, No. 20, (2015), 7207-7220.
44. rishnamurthy, R. and Yauch, C.A., “Leagile manufacturing: a proposed corporate infrastructure”, International Journal of
Operations and Production Management, Vol. 27, (2007),
588-604.
45. Wan, H.D., “Measuring Leanness of Manufacturing Systems and Identifying Leanness Target by Considering Agility”, PhD Thesis, The Virginia Polytechnic Institute and State University, (2006).
A Hybrid Fuzzy Multi-criteria Decision Making Model Based on Fuzzy DEMATEL
with Fuzzy Analytical Network Process and Interpretative Structural Model for
Prioritizing LARG Supply Chain Practices
Z. Akbarzadeh, A. H. Safaei Ghadikolaei, M. Madhoushi, H. Aghajani
Department of Industrial Management, University of Mazandaran, Babolsar, Iran.
P A P E R I N F O
Paper history:
Received 02 January 2018
Received in revised form 29 March 2018 Accepted 27 May 2018
Keywords:
LARG Supply Chain LARG Practices FDANP Technique
Interpretative Structural Model Dairy Industries
هدیکچ
لاس یط یریگراکب ،ریخا یاه بات ،کباچ ،بان میاداراپ راهچ زا یبیکرت( جرلا نیمأت هریجنز میاداراپ
)زبس و روآ هب
روط
هدنیازف تهج .تسا شیازفا لاح رد ی هرهب
بسانم تامادقا دیاب ادتبا ،نیمأت هریجنز رد جرلا میاداراپ یایازم زا یرادرب
همانرب اب و دنوش ییاسانش .ددرگ مهارف اهنآ نتخاس یراج یارب مزلا رتسب حیحص یزیر
نیا فعض طاقن زا یکی ،لاح نیا اب
تیولوا یارب بسانم یشور نادقف هزوح میادراپ و تامادقا یدنب
و جرلا یاه ،اتسار نیمه رد .تسا اهنآ نیب طباور نییبت
میمصت لدم یانبم رب عماج درکیور کی تسا ددصرد رضاح شهوژپ هلباقم نمض هکیروطب دهد هئارا یزاف هرایعم دنچ یریگ
میمصت دنیآرف رد دوجوم نانیمطا مدع و ماهبا اب عمج ،یریگ
.دهد شهاک ار تابساحم مجح و هدرک لیهست ار هداد یروآ اب
ا زا هدافتس نیا کیکت زا یبیکرت هک ،یمک لدم راصتخا هب ای یزاف هکبش لیلحت دنیآرف و یزاف لتمید یاه
FDANP
تسا
میاداراپ و تامادقا تیمها هجرد یم میسرت ار اهنآ نیب یلع طباور و نییعت جرلا نیمأت هریجنز یاه
هدافتسا اب تیاهن رد.دوش
رجا تیولوا یریسفت یراتخاس لدم شور زا نینچمه .دش دهاوخ نییعت تامادقا زا کی ره یا
هب روظنم ییاراک رتهب شجنس
یداهنشیپ درکیور هب ناریا ینبل عیانص ،
.دیدرگ یسررب یدروم هعلاطم ناونع ،لدم جیاتن هب هجوت اب
مهااب تی مک و نیرت تیمها
اهنآ یارجا تیولوا زین و تامادقا و میاداراپ نیرت .دش نییعت
![TABLE 1. Fuzzy Delphi triangular numbers [30]](https://thumb-us.123doks.com/thumbv2/123dok_us/21298.2002284/4.595.58.285.110.232/table-fuzzy-delphi-triangular-numbers.webp)