303
Available online at http://ijdea.srbiau.ac.ir
Int. J. Data Envelopment Analysis (ISSN 2345-458X)
Vol.2, No.1, Year 2014 Article ID IJDEA-00212, 12 pages
Research Article
International Journal of Data Envelopment Analysis
Prioritizing Potential Risks based on Failure Mode
and Effects Analysis Using Data Envelopment
Analysis: a case study
B. Nasr Esfahania*, H. Shirouyehzada, F. Mokhatab Rafiei b
(a)Department of Industrial Engineering, Najafabad Branch, Islamic Azad University, Isfahan, Iran
(b)Department of Industrial Engineering, Isfahan University of Technology, Esfahan, Iran
Received 19 September 2013, Revised 18 December 2013, Accepted 12 January 2014
Abstract
The need to establish power plants to supply the required electricity of the country has been rising due to increasing demand levels as well as the lack of governmental resources. Furthermore, the available traditional attitude in performing and conducting power plant projects has made government seek a modern attitude. This paper tries to use the topics that have been employed in automotive industry of the company for many years to detect and analyse failure reasons as well as the solutions that are suggested to prevent and improve them. The present study has used Failure Mode & Effects Analysis along with Data Envelopment Analysis to evaluate 17 failure modes of South Esfahan Power Plant. Severity, Occurrence and Detection are 3 failure factors considered in this study. Failure mode dealing with Scaling on rotor and diaphragms blades has the highest importance with the highest Risk Priority Number, Severity and its first grade.
Keywords: Evaluation, Risk, Failure Mode and Effects Analysis (FMEA), Data Envelopment Analysis (DEA)
* Corresponding author E-mail addresses: [email protected]
1. Introduction
Nowadays, all professions have been willing toward risk management to be protected against various dangers surrounding them, and also to keep their competitive condition in modern era [18]. Risk Management provides the ability of detecting factors leading to risks. On the other hand, it results in risk analyzing and proper solution selecting to control and remove them [3, 12]. Due to this fact that failure priority of an organization differ in case of effect and importance, it is important to specify indicators
through which importance degree of each factor is defined and they can be ranked. Thus, Failure Mode and Effects Analysis (FMEA) can be employed to rank failure modes and specify
protective steps to remove them. Through a protective and forward looking approach, this technique can help the organization detect potential problems and remove them before they would affect system, services and customers [14]. Failure Mode and Effects Analysis is a systematic method to detect and prevent problem Occurrence in product and its process. This technique focuses on avoiding defect emergence, Severity increase and customers’ satisfaction increase [19]. Also, this technique is to provide information to make risky management decisions. During years, some various FMEA versions have been developed; many of them include a quantative concept that deals with prediction of similarities among certain types of system failure [20].
Analysing failure factors in production process and their effects is an analytical and principal technique that detects either potential or clear defects and makes modification decisions before beginning by production line. This is done by production lines. This analysis is done for new processes or the processes that include any kind of change in their initial status. This technique focuses on security increase and customers’ satisfaction increase to prevent defects. Moreover, it is regarded as a tool with the lowest risk
to predict problems and defects in production processes in an organization [25]. The effect of these failures on organizations’ performances are different and it is possible to detect highly
important failures by a number of methods. Data Envelopment Analysis (DEA) is one of these methods in evaluating organizational performance. In fact, this technique is a border non-parametric evaluation model that is used to measure the relative efficiency. It is also regarded as a system of comparable items (which is called Decision Making Unit (DMU)) in converting inputs to outputs. Using related data to the amount of real inputs and outputs of Decision Making Units, this technique studies a border function surrounding input and output factors. This border contains linear sections that present not only the most
efficient current units, but also inefficient unit analysis [13]. Taking the undeniable importance of modifying steps and recognizing the failures in an organization.
This study tries to highlight the evaluation of failure modes based on FMEA; therefore, Data Envelopment Analysis is employed. Accordingly, first all failure mode are detected. Then, triple factors (Severity, Occurrence and Detection) are specified and RPN (Risk Priority Number) is found out of multiplying these 3 numbers. In next phase, DEA model is formed through specifying related inputs and outputs. In fourth phase, Unit efficiencies will be found by using output-oriented modified CCR model. In
the end, ranking is done. In this research, South Esfahan Power Plant is selected as the case study.
2. Literature review
Employing Failure Mode and Effect Analysis and Data Envelopment Analysis, Abadian et al. evaluate service quality of DSL. First, they have detected qualitative failures in the systems and have collected the opinions of members of failure analysis team. Then, fuzzy risk priority importance in each failure mode is found in geometrical mean relation. Data Envelopment Analysis for both minimum and maximum failure modes is found in the model proposed by Chin et al. [6], is finally ranking is done by doing related statistical operation and solving DEA models [1]. Garcia et al., use both fuzzy DEA and FMEA in their research. The employed fuzzy model is taken from Lertworasirikul et al. s’ article [15]. Risk factors of S, O and D are considered as fuzzy values and a special fuzzy model is used to rank factors among failure modes [11]. Chin et al., have suggested DEA approach based on FMEA that calculated relative weights of risk factor. Weights are specified in DEA models and change from a failure mode to another one. The suggested MEA measures the maximum and minimum errors of each failure mode. These minimum and maximum, measured through geometrical mean, are regarded as a based to rank failure modes. In this process, with two CCR models, the best and worst conditions for each Decision Making Units will be found as failure
modes. This is what exactly ideal and non-ideal options in TOPSIS1 do [6]. In another research conducted by Dong and Kuo, a new approach was proposed to boost evaluation
capabilities along with FMEA detection. This approach supports this hypothesis that DEA not only completes traditional FMEA, but also provides correct information for failure parameters (Severity, Occurrence and Detection). This information reduces failure probability. Findings reveal that this method is useful to manage resource dedication and risks [9]. In order to improve the validity of pure systems, Sawhney et al., have looked for using a modification FMEA. This research aims at intensifying validity unification of pure principle in a long-term period, and suggests a modified FMEA that lets experts grasp the validity of pure systems and improve it. According to this approach, 4 critical sources are needed to help us retain pure systems including staff (personnel), equipment, ingredients and time-table [23]. In a study in an automotive organization, Vinodh and Santhosh use FMEA as a decision-making and ranking tool. Modification steps of this research result in raising system efficiency and product number along with failure rate decrease. Results show the activities that bring design and process improvement about lean to the increasing production quality [24].
3. Failure Mode and Effects Analysis (FMEA)
Failure Mode and Effects Analysis is an important technique to detect potential failure modes which was employed in air and space industry as an official design method in 1960 [4]. Afterwards, it was used a powerful and useful method to evaluate potential errors and failures as well as prevent them [22]. In recent years, FMEA has been noticed more because of developing automotive industry in the US and QS9000 Standards for part manufacturers. Nowadays, this technique is regarded as an efficient tool in not only selection of equipment and machinery, but also selection of production technology of a product [2]. The aim of FMEA in a production process is to avoid a disaster occurrence. In other words, FMEA leads to decreasing costs by optimizing processes of products. Since cost reduction happens in first steps of process development. Changes are often simple and low-cost [21].
First, all potential failure modes are detected in a systematic brainstorming session; then, risk triple factors (Occurrence (O), Severity (S) and Detection (D)) are found which are put in 1-10 range. Failure Ranking is done to reduce and modify based on Risk Priority Number (RPN) which is the result of 3
factor multiplying [16].
RPN = O * S * D
4. Data Envelopment Analysis (DEA)
Efficiency measurement has been highlighted by researchers due to its significance in performance evaluation of a company or an organization. Using a technique similar to efficiency measurement in engineering discussion, Farrell in 1957 measured the efficiency for a production unit [10]. Charnes, Cooper and Rhodes developed Farrell’s approach and suggested a model that was able to measure the efficiency with some inputs and outputs. This model was called Data Envelopment Analysis [5]. This technique used mathematical decision making techniques to evaluate the performance of a system of similar decision making units with some inputs and outputs. Coeli has shown that among various performance evaluation methods, Data Envelopment Analysis has 2 main advantages in measuring efficiency:
First, it does not need to make a function among data and inputs; it means that researcher can avoid limiting conditions of form selection of production function or cost function that can affect efficiency analysis results. Second, it does not mean statistical distribution for efficiency details [5, 7, 8]. Charnes, Cooper and Rhodes presented CCR model with efficiency on stable scale whose modified version is stated as follow:
Max 𝑍 = 𝜃 − 𝜀(∑𝑚𝑖=1𝑆𝑖−+ ∑𝑆𝑟=1𝑆𝑟+)
𝑠. 𝑡
∑ 𝜆𝑗𝑥𝑖𝑗+ 𝑆𝑖− 𝑛
𝑗=1
= 𝜃𝑥𝑖𝑝
∑ 𝜆𝑗𝑦𝑟𝑝− 𝑆𝑟+ 𝑛
𝑗=1
= 𝑦𝑟𝑝
𝜆𝑗≥ 0 𝑗 = 1, … , 𝑛
𝑆𝑟+,𝑆𝑖− ≥ 0 i=1,..., m , r=1,…, s
Here, Xij, Yij and Ѳ are the value of i th input, the value of i th output and efficiency, respectively. Si- and Sr+ are lack variables of input and output and ƛ
a number of models have been introduced that rank DMUs. One of them is Makui et al. s’ [17]. In this research DMUs are ranked by using ideal planning and efficiency evaluation. The difference of this DMU model with the common ones is that it finds same input and output values for all DEAs. In this technique, CCR is used to find Ѳ value for each DMU:
𝑀𝑎𝑥 𝑍 = ∑ 𝑢𝑟𝑦𝑟𝑝 𝑠
𝑟=1
(1)
𝑆𝑡
∑ 𝑣𝑖𝑥𝑖𝑝= 1 𝑚
𝑖=1
∑ 𝑢𝑟𝑦𝑟𝑗− ∑ 𝑣𝑖𝑥𝑖𝑗 𝑚
𝑖=0
≤ 0 𝑗 = 1, … , 𝑛
𝑠
𝑟=1
𝑈𝑟 ≥ 𝜀 𝑟 = 1, … , 𝑠
𝑉𝑖 ≥ 𝜀 𝑖 = 1, … , 𝑚
Then, in next level, ѲCCR helps to solve the relation 2 to calculate common u and v numbers for each input and output.
𝑀𝑖𝑛 ∑(𝑑𝑗−+ 𝑑𝑗+)
𝑛
𝑗=1
(2)
St.
∑ 𝑢𝑟𝑦𝑟𝑗− ∑ 𝑣𝑖Ѳ𝑗∗ 𝑚
𝑖=1
𝑥𝑖𝑗 ≤ 0 j = 1, 2, … , n 𝑠
𝑟=1
∑ 𝑢𝑟𝑦𝑟𝑗− ∑ 𝑣𝑖Ѳ𝑗∗ 𝑚
𝑖=1
𝑥𝑖𝑗+ 𝑑𝑗−− 𝑑𝑗+= 0 j = 1, 2, … , n 𝑠
𝑟=1
∑ 𝑢𝑟+ ∑ 𝑣𝑖= 1 𝑚
𝑖=1 𝑠
𝑟=1
𝑑𝑗−, 𝑑𝑗+≥ 0 𝑗 = 1,2, … , 𝑛 𝑢𝑟 ≥ 0 𝑟 = 1,2, … , 𝑠
𝑣𝑖 ≥ 0 𝑖 = 1,2, … , 𝑚
Solving equation 2 results in finding the common u and v for all DMUs. Next, efficiency value of DMUj (j = 1, 2,…,n) is calculated through using relation 3:
θ =∑ 𝑢𝑟
∗𝑦 𝑟𝑗 𝑠
𝑟=1
∑𝑚𝑖=1𝑣𝑖∗𝑥𝑖𝑗
(3)
If through using (u*, v*), efficiency equals 1, it is possible to DMUp efficient. It is worth mentioning that if DMUp of relation 3 is efficient, input-oriented CCR will be efficient as well. Finally, efficiency number can be used to rank DMUs and ranking will be done accordingly.
5. Methodology
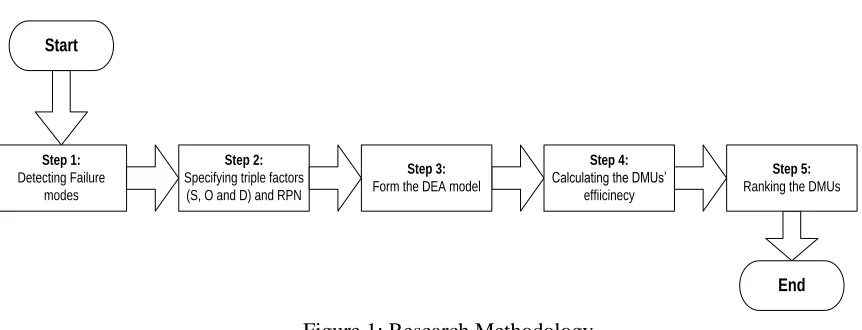
Due to the vast association between modifying activities and organizational performance, companies need to adopt appropriate methods of risk analysis to boost their efficiency. The present study deals with risk ranking in South Esfahan Power Plant. A five steps process is required in this research based of Failure Mode and Effects Analysis, which is a protection technique and Data Envelopment Analysis. As shown in figure 1, first failure modes are specified.
Figure 1: Research Methodology
In next phase, failure triple factors (Severity, Occurrence and Detection) are specified, and consequently RPN is found out of multiplying these 3 numbers. Furthermore, DEA model will be determined by specifying inputs and outputs. In the fourth step, relative efficiency of failure modes is calculated in
output-oriented covering modified CCR. Finally, DMUs are ranked through Makui et al. s’ method. First step: The first step to specify failure modes to analyse potential risks of South Esfahan Power Plant
by using Failure Mode and Effects Analysis. According to the library research and experts’ opinions, as well as considering related literature and surrounding status, 17 failure modes were selected which are shown in table 1.
Start
Step 1:
Detecting Failure modes
Step 2:
Specifying triple factors (S, O and D) and RPN
Step 3:
Form the DEA model
Step 4:
Calculating the DMUs’ effiicinecy
Step 5:
Ranking the DMUs
Table 1: Failure Modes Number of Failure mode Failure mode Number of Failure mode Failure mode 1 Scaling on rotor and diaphragms
blades 10
Wrong control signal
2 Wear and corrosion
11 Failure of protective relay
3 Sticking of valves
12 CO2
4 Rotor vibration of turbine
13 failure in waters pumps
5 Rotor vibration of generator
14 Failure in Firefighting system
6 Loose stator coils
15 Failure of diesel generator
7 Arcing of switches
16 Failure in switch gears
8 Failure of motors
17 Failure in control system of
emergency power Failure of transformers 9
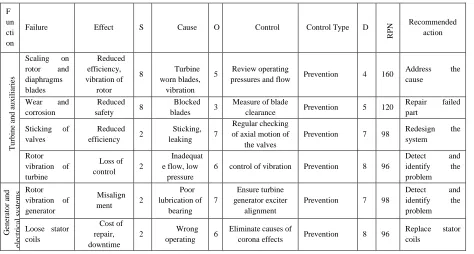
Second step: After specifying failure modes, failure triple factors (Severity, Occurrence and Detection) will be found by considering experts’ opinions in range of 1-10. The bigger numbers and closer to 10, the higher the importance and Vice Versa. However, detection works differently. Smaller values and numbers indicate the better detection of that failure mode to other ones. Failure analysis is done based on risk priority number (RPN) which is the outcome of multiplying 3 factors to decrease failure and modify them. (Table2)
Table 2:
FMEA worksheet of South Esfahan Power Plant
F un cti on
Failure Effect S Cause O Control Control Type D
RP N Recommended action Tu rb in e an d a u x il ia ri es
Scaling on rotor and diaphragms blades Reduced efficiency, vibration of rotor
8 Turbine worn blades, vibration
5 Review operating
pressures and flow Prevention 4 160
Address the cause
Wear and corrosion
Reduced safety 8
Blocked blades 3
Measure of blade
clearance Prevention 5 120
Repair failed part
Sticking of valves
Reduced efficiency 2
Sticking, leaking 7
Regular checking of axial motion of
the valves
Prevention 7 98 Redesign the system
Rotor vibration of turbine
Loss of control 2
Inadequat e flow, low
pressure
6 control of vibration Prevention 8 96
Detect and identify the problem G en er at o r an d el ec tr ic al s y st ems Rotor
vibration of generator
Misalign ment 2
Poor lubrication of bearing 7 Ensure turbine generator exciter alignment
Prevention 7 98
Detect and identify the problem
Loose stator coils
Cost of repair, downtime
2 Wrong operating 6
Eliminate causes of
corona effects Prevention 8 96
Arcing of switches
Poor cooling, corona effect
4 Wrong operating 3
Maintain correct switch gear operations and
contacts
Prevention 7 84 Address the cause
Failure of
motors Downtime 1 0
Excitatio n under voltage
2 Monitor all motors
performance Prevention 4 80
Redesign the system
Failure of
transformers Downtime 9
Excitatio n under voltage 2 Regular test transformer oil, Contacts and temperatures
Prevention 3 54 Redesign the system C o n tr o l sy st em Wrong control signal Inefficien cy, downtime 8
Damage cables 6
Install backup
safety Prevention 2 96
Calibrate equipment Failure of protective relay Inefficien cy, downtime 2
Wrong calibration 5
Install backup
control circuits Prevention 5 50
Repair or replace damaged parts F ir ef ig h ti n g s y st em CO2 Failure in fire extinguish 6
Empty of the capsule 3
Control pressure
gauge Prevention 1 18
Eliminate of defect
failure in waters pumps
Reduced efficiency 5
Failure of
motors 2 Periodic start Prevention 5 50
Repair of motor s’ defect and auxiliary circuit Failure in Firefighting system No alarm for system 3
Failure of
relays 3 Check the circuits Prevention 4 24
Identify the problems and repair Emerg en cy P o w er Failure of diesel generator Reduced efficiency, problem in starting
2 Failure of battery 2
Control of battery
voltage Prevention 2 8
Charge or replace the batteries Failure in switch gears Problem in power supply
3 Failure of
switches 4 Periodic start Prevention 5 60
Replace of switches Failure in control system start circuits disconnected
3 Failure of
power supply 4 Control of alarms Prevention 2 24
Connect the power supply
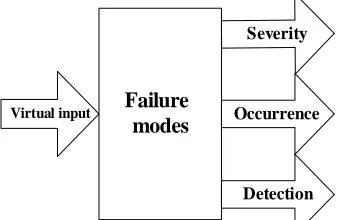
Third step: In order to rank failure modes of South Esfahan Power plant, one of the most common evaluation techniques (DEA) is employed. To form DEA model, specifying inputs and outputs is the first requirement shown in figure 2.
Figure 2: inputs and outputs of DEA model
Failure modes
Severity
Virtual input Occurrence
According to the library research, experts’ opinions and reviewing previous literature, the same input is considered for all modes which is called “virtual input”. Moreover, 3 outputs of (Severity, Occurrence and Detection) are taken into account to form DEA model, shown in table 3.
Table 3:
The numbers of inputs and outputs
DMU
input outputs
DMU
input Outputs
virtual S O D virtual S O D
1 1 8 5 4 10 1 8 6 2
2 1 8 3 5 11 1 2 5 5
3 1 2 7 7 12 1 6 3 1
4 1 2 6 8 13 1 5 2 5
5 1 2 7 7 14 1 3 3 4
6 1 2 6 8 15 1 2 2 2
7 1 4 3 7 16 1 3 4 5
8 1 10 2 4
17 1 3 4 2
9 1 9 2 3
Fourth step: CCR model is employed to calculate the efficiency of 17 failure modes of South Esfahan Power Plant. Due to this fact, evaluation is done based on failure triple factors (Severity, Occurrence and Detection), these three are considered as outputs of DEA model. According to this issue and stable efficiency on unit scale, modified version of output-oriented covering CCR has been chosen which was described in theoretical parts. DMUs with relative efficiency of 1 are efficient; those whose efficiency is bigger than 1 are inefficient. After calculation, these modes have been recognized as efficient ones, shown in table 4: Scaling on rotor and diaphragms blades, Wear and corrosion, Sticking of valves, Rotor vibration of turbine, Rotor vibration of generator, Loose stator coils, Failure of motors and Wrong control signal.
Table 4:
Objective Values of potential failure modes
θ(CCR) Failure
mode θ(CCR)
Failure mode
1 10
1 1
1.34286 11
1 2
1.46747 12
1 3
1.20096 13
1 4
1.61290 14
1 5
2.76471 15
1 6
1.35135 16
1.00120 7
1.63043 17
1 8
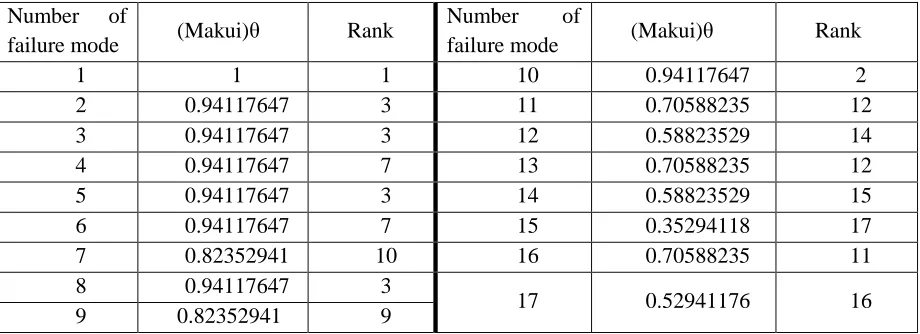
Fifth step: Makui et al. s’ model is used to evaluate the performance and rank potential failure modes. Thus, first related data to each input and output was normalized through a linear technique. Then, failure performance is evaluated in next phase. The results are displayed in table 5.
Table 5:
Efficiency rate and ranking
According to the findings of table 5, as well as Makui’s model, the only efficient DMU, is “failure mode of Scaling on rotor and diaphragms blades”. Additionally, efficiency number was used to rank organizational units leading to this point that two failure modes “failure mode of Scaling on rotor and diaphragms blades” and “wrong control signal” are in the first and second place with the highest value of efficiency number. Furthermore, “failure mode of control system of emergency power” is put in the last place.
6. Conclusion
Protective steps before occurrence for projects that have not been started yet as well as modifying steps for projects that are being implemented can be really significant resulting in delay prevention or reduction in power plant projects. The main objective of this study is to prioritize potential failure modes of South Esfahan Power Plant based on Failure Mode and Effects Analysis along DEA. DEA was selected to rank and evaluate because of high significance of Severity and Occurrence rather than Detection and also not complete RPN number. In comparison with other performance evaluation techniques, DEA has plenty of functions due to great relation between various inputs and outputs. In this research, after detecting failure modes and specifying severity, occurrence and detection. RPN is calculated. According to having a stable efficiency on scale of all units and outputs along with considering occurrence, severity and detection, modified version of output-oriented covering CCR has been selected for this research.
CCR findings reveal that modes of Scaling on rotor and diaphragms blades, Wear and corrosion, sticking of valves, Rotor vibration of turbine, Rotor vibration of generator, Loose stator coils, Failure of motors and Wrong control signal are efficient because of an efficiency number of 1. Therefore, some activities are needed to avoid or modify then. On the other hand, Arcing of switches, Failure of protective relay,
Rank (Makui)θ
Number of
failure mode Rank
(Makui)θ
Number of
failure mode
2 0.94117647
10 1
1 1
12 0.70588235
11 3
0.94117647 2
14 0.58823529
12 3
0.94117647 3
12 0.70588235
13 7
0.94117647 4
15 0.58823529
14 3
0.94117647 5
17 0.35294118
15 7
0.94117647 6
11 0.70588235
16 10
0.82352941 7
16 0.52941176
17 3
0.94117647 8
9 0.82352941
CO2, failure in waters pumps, control system of emergency power, diesel generator, switch gears, Firefighting system and failure of motors are inefficient. Findings of last phases which was DMU evaluation showed that failure modes of Scaling on rotor and diaphragms blades, Wear and corrosion, Sticking of valves, Rotor vibration of turbine, Rotor vibration of generator, Loose stator coils, Failure of motors and Wrong control signal have the highest importance, whereas failure of diesel generator had the lowest significance.
Based on findings of DEA model, Makui et al.s’ model and RPN, in second step of methodology, it is possible to analyze 8 failure modes with the highest significance. Failure mode of Scaling on rotor and diaphragms blades was still efficient in Makui et al., model. This failure mode has the highest significance in evaluation and modification with RPN of 160 and Severity of 8. Also, the engine failure with RPN of 80 is put in next level but its high Severity requires great attention. It is worth stating that in regulated inefficient mode, it is possible to mention failure mode of transformers with very high severity
which needs prevention & modification. Finding count in both attitudes of scientific and theoretical. Organizations need to find some techniques to reduce their prominent failures. This study tries to make a
new perspective for managers and researches to make then know that an organization needs not only materials, equipment and capital, but also an appropriate approach to avoid & modify failure modes. These findings reveal that which sections are the related to o the neediest modes and management can focus and plan on failure modes to save time and money. The challenges expressed for these investigations are just a part of managers’ problems. Making some of these factors active needs high time and maintenance. This research is limited to one organizations and can be replicated for other organizations as well. Another limitation deals with lack of unit ranking. It is possible to have a more optimum mode through considering weight control of failure triple factors. Also, we can have a more precise analysis on failure mode ranking by drawing an area RPN diagram. Other ranking methods can be applied in future studies.
References
[1] Abadian, M., Zanjirchi, M., Asa’adi, M., (2013), “Evaluation of DSL Service Quality Using FMEA
and Fuzzy DEA”, Production and Operantion Management, Vol.3, No. 2, pp. 61-78. (In Persian) [2] Almannai B, Greenough R, Kay J. (2008). “A decision support tool based on QFD and FMEA for the
selection of manufacturing automation technologies”, Robotics and Computer- Integrated Manufacturing,
Vol. 24, No. 4, pp. [3] Babaei, A., Javaher dashti, F. and Hashemi, S. (1997), “Risk Management: Prediction or Risk
sharing”, Tadbir Magazine, Vol. 8, No. 73, pp. 66-71. (In Persian) [4] Bowles, J. B., and Pelaez, C. E.(1995). “Fuzzy logic prioritization of failures in a system failure mode,
effects and criticality analysis”,Reliability Engineering & System Safety, Vol.50, No.1, pp.203–213. [5] Charnes A.W., Cooper W., and Rhodes D (1978). “Measuring the efficiency of decision making
unit”.Eur. J. O. R. Vol. 2, No. 1, pp.429-444. [6] Chin, K. S., Wang, Y. M., Poon, G. K. K., & Yang, J. B. (2009a). “Failure mode and effects analysis
by data envelopment analysis”, Decision Support Systems, Vol. 48, No. 1, pp. 246–256. [7] Coeli T. (1996). “A guide to DEAP version 2.1,a data envelopment analysis computer program”, CEPA working paper 96/08 Department of Econometrics, Universtiy of New England, Armidale,
[8] Coeli T., Parsada R., and Battese E. (1998). “An introduction to efficiency and productivity analysis”,
Bostone, Kluwer Academic Pub. [9] Dong, S.C. and Kuo, L.P. (2009), “Applying DEA to enhance assessment capability of FMEA”,
International Journal of Quality & Reliability Management, Vol.26, No. 6, pp. 629-643. [10] Farrell, M.J. (1957), “The measurement of productive efficiency”, Journal of the Royal Statistical Society, Series A, General, Vol. 120, No. 3, pp. 253–281. [11] Garcia, P. A. A., Schirru, R., and Frutuoso Emelo, P. F. (2005). “A fuzzy data envelopment analysis approach for FMEA”. Progress in Nuclear Energy, Vol. 46, No. 1, pp. 359–373.
[12] Gharachorloo, N. (2005), Evaluation and Risk Management, Tehran: olum-fonun publishing Co. [13] Kabnurkar, A. (2001), “Mathematical Modeling for Data Envelopment Analysis with Fuzzy
Restrictions on Weights”, Thesis Submitted for the Degree of Masters of Science in Industrial and
Systems Engineering, Faculty of the Virginia Polytechnic Institute. [14] Kusler-Jensen J, Weinfurter A. (2003), “FMEA An idea whose time has come”. SSM -DENVER.
Vol. 9, No. 3, pp. 30-37. [15] Lertworasirikul, S., Fang, S. C., Joines, A. J., and LwNuttle, H. (2003). “Fuzzy data envelopment
analysis (DEA): A possibility approach”. Fuzzy Sets and Systems, Vol. 139, No. 1, pp. 379–394 [16] Liu, H., Liu, L. & Liu, N. (2013). “Risk evaluation approaches in failure mode and effects analysis:
A literature review”. Expert Systems with Applications, Vol. 40, No. 1, pp. 828–838
[17] Makui A, Alinezhad.A, Kiani Mavi.R. and Zohreh bandian.M, (2008). “A Goal Programming Method for Finding Common Weights in DEA with an Improved Discriminating Power for Efficiency”. Journal of Industrial and Systems Engineering.Vol. 1, No. 4, pp. 293-303. [18] Mohammad hossein Yar mohammadian, Shahram Tofighi, Sekineh Saghaiannejad Esfahani, Tahereh Naseri booriabadi (2007), Risks involved in medical records processes of Al-Zahra hospital, Health Information Management, Vol. 4, No. 1, pp. 51-59. (In Persian) [19] Mottaghi, H. (2011), Production and Operantion Management, Tehran: Avaye Shervin Publishing
Co. (In Persian) [20] Pillay, Anand, Wang, jin. (2002), “Modified failure Mode and Effect Analysis Using Approximate
Reasonning”, Reliability Engineering and System Safety, Vol.79, No. 1, pp 69-85. [21] Robin E. McDermott, Raymond J. Mikulak, Michael R. Beauregard (1996), The basics of FMEA, Translated to by Haghighi, M., Tehran: Sapco Publishing Co. (In Persian) [22] Sankar, N. R., and Prabhu, B. S. (2001). “Modified approach for prioritization of failures in a system failure mode and effects analysis”. International Journal of Quality & Reliability Management, Vol. 18, No. 1, pp. 324–336
[23] Sawhney, R. Subburaman, K. Sonntag, C. Capizzi, C. (2010), “A modified FMEA approach to enhance reliability of lean systems”. International Journal of Quality & Reliability Management, Vol. 27,
No. 7, pp. 832-855. [24] Sekar Vinodh, and D. Santhosh (2012), “Application of FMEA to an automotive leaf spring