International Journal of Transportation Engineering,
Identifying and
Analyzing Stop and Go Traffic based
on Asymmetric Theory of Driving Behavior in
Acceleration and Deceleration
Ali Abdi1, Mahmoud Saffarzadeh2, Arsalan Salehikalam3
Received: 03.03.2014 Accepted: 03.03.2015
Abstract:
Stop and go traffic that leads to oscillate traffic flow frequently is observed on congestion flow. Unexpected reasons such as lane – changing maneuvers, lower speeds of leader vehicle and moving bottleneck cause stop and go traffic and amplifying delay and environment impacts. Stop and go traffic exactly can’t be modeled by traffic models, and also car following models based on kinematic flow theory can’t be implied correct perception of stop and go traffic. Based on asymmetric microscopic theory and trajectory data of NGSIM, traffic flow can be classified into five phases according to speed and movement of the vehicle: Free flow, acceleration and deceleration, stationary and coasting phases. Analyzing stop and go traffic based on asymmetric theory of acceleration and deceleration phase will result to classify them into three cases: generation, growth and dissipation of traffic waves. Analyzing of traffic oscillation implies that stop-and-go traffic is relatively small and can’t be propagated upstream unless the following traffic is also near D-curve; while the effect on lane changes are greater, and can propagate even the following traffic is not near the D-curve. In this paper, using time window in trajectory data clarify relation between the total number of lane changes and stop-and-go waves for congestion traffic. Analyzing net lane changes inside the searching window for incoming and outgoing lane changes about growth and dissipation of traffic waves indicate how characteristics of stop-and-go waves are intimately related to driver’s asymmetric behavior of acceleration and deceleration. The comparison result on the growth and dissipation indicated that under the same net lane changes, growth wave case occupy the regions in fundamental diagram, flow – density diagram, deceleration curve, and dissipation wave case occupy the regions of flow – density, acceleration curve.
Keywords:
Traffic oscillation, stop-and-go traffic, asymmetric theory, lane-changing maneuver, acceleration and deceleration waveCorresponding author e-mail: [email protected]
1.
Introduction
Stop-and-go driving, or simply traffic oscillation, has raised much concern in the literature due to its severe negative impacts: increased fuel consumption, green- house emissions and safety risks [Bilbao-Ubillos, 2008 Zheng, et al, 2011a Zheng,et al, 2011b]. Unfortunately, our understanding of this type of the oscillations in con- gested traffic is still limited. On the one hand, detailed vehicle trajectories data are very scarce, and aggre- gated sensor data are often noisy and insufficient. On the other hand, few attempts have been made to vali- date the oscillations predicted by existing traffic flow models, which are often a result of mathematical cu- riosities rather than driving behavior. A traffic oscilla- tion has two components, formation and propagation. It is known that the formation can be caused by lane- changing activity (Laval and Daganzo, 2006, Ahn and Cassidy, 2006, Laval, 2005) or in general any kind of moving bottleneck (Koshi et al., 1992, Laval, 2006). LWR (Lighthill and Whitham, 1955; Richards, 1956) theory is the first order model for traffic dynamics. It has shown good agreements with experimental observa- tions in congested traffic, but as a coarse representation of traffic, it cannot satisfactorily explain the mechanism of some traffic phenomena such as stop-and-go traffic [Richards, 1956 , Lighthill, Whitham,1955]. Daganzo (1997) pointed out the limitations of LWR model: (1) driver difference, (2) vehicular motion through shock, and (3) traffic instability. Recently, Nagel and Nelson (2005) pointed out the limitations of LWR theory in ad- dressing 1) unstable flow, 2) spontaneous breakdown, 3) two-capacity phenomenon (or “capacity drop”; Banks, 1991). Analyzing aggregate detector data, Kern- er (Kerner and Rehborn, 1996a, 1996b, 1999; Kerner, 2004) has developed a three-phase traffic theory. He classified traffic into 3 phases: free flow, synchronized flow, and wide moving jam. He tried to explain spatial- temporal traffic patterns using transitions between these three phases. Although he was not the first, he pointed out two empirical phenomena: (1) synchronization of average speed between different freeway lanes and (2) wide spreading of empirical data in flow-density plane. From these perspectives, Kerner concluded that there does not exist any fundamental relationship in congest- ed region. Furthermore, diverse situation of traffic such
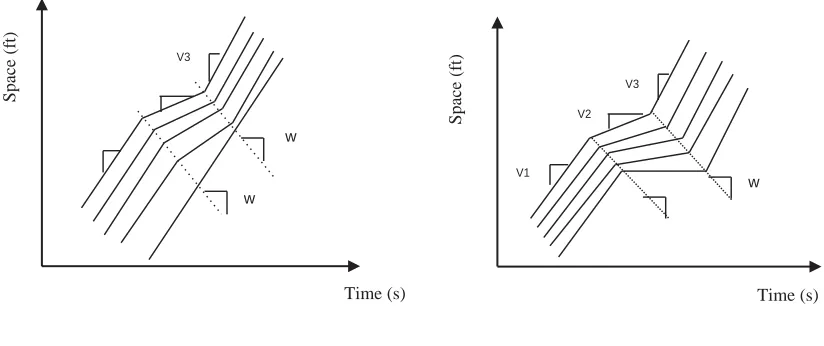
as lane changing, merging and diverging also contrib- ute to the wide scattering. For example, in multilane freeway, lane changes can cause speed synchronization. Therefore, the two phenomena Kerner pointed are not unique features of three-phase theory, and can also be understood in fundamental diagram perspectives. Ahn presented that lane change maneuvers create stop and go traffic. Sudden braking effect results in stop and go traffic [Ahn, Cassidy, 2007 , Daganzo, 2006 , Daganzo, 1997]. Applying Newell’s (2002) simplified car-follow- ing theory, the trajectory of the following vehicle is al- ways parallel to the lead vehicle, and the wave speeds of stop-and-go traffic are same for both deceleration and acceleration for the same vehicle. In reality, it can be easily found that the trajectories in the stop-and-go traffic are not parallel, and the wave speeds for acceler- ation and deceleration are not same [Newell, 2002]. In Del Castillo’s model (2001), vehicle trajectories do not need to be parallel, but wave speeds are same (figure 1). However, waves grow in dense traffic flow and decay in low density flow.
Re-International Journal of Transportation Engineering,
1.Wave decays 2. Wave growth
Figure1. Dell Castillo’s Model (Del Castillo’s, 2001(
sponse time and flow show negative relationship. With higher response time, accelerating vehicles recovering from a slowdown have lower flow.
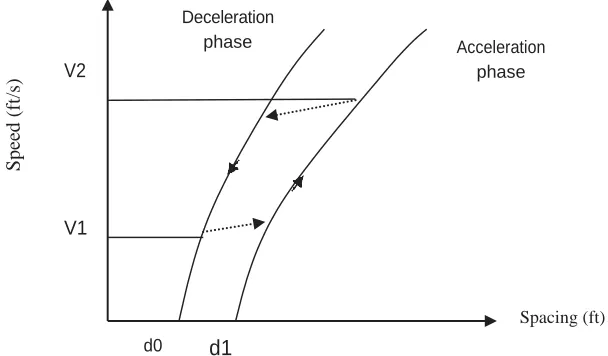
Foote (1965) observed traffic data obtained in tunnels. Dividing platoons into three types: constant speed, ac- celerating and decelerating, he traced the platoons, and found that decelerating vehicles have higher flow for given speed than the other types of platoon. Edie (1965) investigated platoon behaviors using analyzed data from aerial photos taken in 6 seconds interval. His study site is one lane of the George Washington Bridge which was not affected by lane changing behaviors. Based on the observations showing asymmetric be- havior by Forbes, Foote, and Edie, Newell suggested two separate curves for acceleration and deceleration in congested traffic as shown in figure 3. As illustrated in the figure, the spacing in acceleration is always larger than the one in deceleration for the same speed. This
asymmetry in acceleration - deceleration forms a clock- wise loop in flow-density plane like Edie’s (1965) re- sults shown. Different from Forbes (1965) who noticed only response time change and assumed same jam den- sity, Newell used different jam spacing d0, d1 for decel- eration and acceleration respectively. He also ascribed the cause of traffic instability allowing the growth of a small perturbation, to the wave speed difference inher- ent from the asymmetry.
Laval and Leclercq (2010) conjectured that the forma- tion and propagation of traffic oscillations were due to the aggressive or timid driver behavior. This study suggests a new perspective to explain the mechanism of formation and propagation for traffic oscillations. However, the behavioral model assumed in this mod- el has not been verified empirically. Additionally, this model assumed that drivers behave homogeneously in equilibrium (i.e., following the same fundamental
dia-Density (ve/m)
Figure 2. Response time )Forbes, 1965)
Time (s) Time (s)
V3
V2
V1
w
V3
w
w
V=50 mph
V=40 mph V=30 mph
V=20 mph
��=0.5(s)
��=1
��=2
Space
(f
t)
Flo
w (
v
e/h
r)
Space
(f
Deceleration phase
V2
Acceleration phase
V1
d0 d1
Figure 3. Newell’s two-curve theory in congested traffic (Newell, 1965)
gram) and consistently before and after traffic oscilla- tions. These assumptions, however, were not validated by empirical observations. Zielke’s researches indicate that wave speed divides into three different regions without regarding different properties. They founded that lane change maneuvers result in developing stop and go traffic waves in platoon [Zielke, Bertini, Treiber, 2008]. In this research, stop and go traffic properties are compared based on asymmetric theory. Also, traffic oscillation is classified into two cases, growth and dis- sipation case. These cases are compared according to lane change maneuvers.
2.
Methodology
First stop and go wave in platoon is presented based on asymmetric theory, in order to determine differ- ence between stop and go wave based on asymmetric theory and Newell’s car following model. Then there is a comparison between both two theory and between traffic instability and lane change diffusion wave based on asymmetric theory.
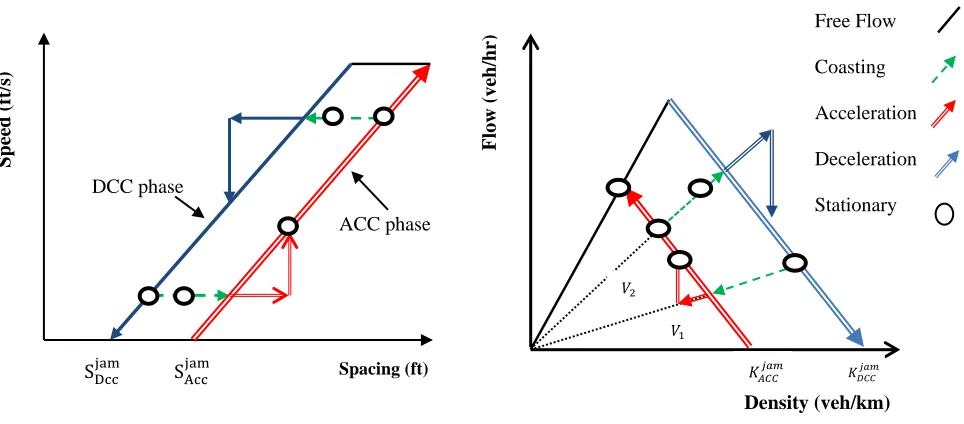
2.1 Asymmetric Driving Behavior Theory Asymmetric behavior theory is based on different re- actions of drivers during deceleration and acceleration phase. It results in asymmetric spacing in two phases. Figure 4 shows an individual vehicle’s traffic state of NGSIM data can be classified into five phases: free flow, acceleration, deceleration, stationary and
coast-ing. According to figure 5, flow-density and spacing – speed planes present based on this theory. It is able to explain phase transitions between two phases and de- scribe traffic equilibrium that exists as two dimensional area bounded by A-curve and D-curve. And also, that theory is able to explain several complex traffic phe- nomena of driver behavior in congested traffic [Yeo, H. 2008, Jonghae, S., Hwasoo,Y. Alexander,S. 2012].
2.1.1Free Flow
Free flow is a traffic state in which a small disturbance doesn’t affect upstream traffic. In other words, if a vehicle is in free flow phase, a small speed change or spacing change from leader vehicle doesn’t trigger a deceleration action of the subject vehicle. In free flow, drivers run at their desired speed which is usually a maximum speed.
2.1.2Deceleration and Acceleration Phase Acceleration phase is a state in which a vehicle is speed- ing up to catch up with the speed of the leader vehicle or reduce spacing. Deceleration (acceleration) curve for one vehicle obtains with connecting points that values less (larger) than -1 (+1) ft /sec2 in speed and spacing plane. In a microscopic view, stationary phase is a traf- fic state in which the speed and spacing between two adjacent vehicles are constant. But, in traffic situation it is almost impossible for these two values to be kept constant for long time because human perception and reaction are not perfect. Flow can be defined in
speed-Spacing (ft)
Sp
ee
d (f
t/
International Journal of Transportation Engineering,
Figure 4. Phases in speed-spacing plane Figure 5. Phases in flow-density plane
Figure 4, 5. Traffic phases based on asymmetric theory (Yeo & Skabaronis, 2009)
spacing plane when the following conditions are satis- fied:
|
d𝑆dtn|≤𝑇𝐻
𝑠, |
𝑑𝑉𝑑𝑇𝑛|≤𝑇𝐻
𝑣(1)
THs: The spacing thresholds is 5 m.
THv: The speed thresholds is within 3 km/h ~ 5km/h. d𝑆n
dt :
change of vehicle’s spacing
dVn
:
change of vehicle’s speeddT
2.1.3 Coasting Phase
In coasting phase vehicle keeps constant both speed and spacing and acceleration value ranges from -1 to 1 ft/ sec2. Coasting is defined as a phase in which a vehicle
keeps its speed but spacing is being reduced or enlarged by the leader vehicle’s deceleration or acceleration be- tween A/D curve. Every car-following model is used to explain the dependency of the follower vehicle trajec- tory, and its position at time t, to leader vehicle. Ac- cording to figure.6, if leader vehicle (n-1), moves with constant speed (v), the follower vehicle must move with constant speed (v), too. Spacing between follower and leader vehicles at the time (t) can be changed, but if the freeway was homogenous, the spacing must be constant
at approximately Sn; however, it can be varied for dif- ferent types of vehicles. In this case, all the vehicles are considered as the same type. According to figure 7.1, in the Newell`s model, when a leader vehicle changes its speed from v to v', the disturbance wave by speed of di/τi
, will be sent to follower vehicle. This process results in an increase in acceleration of follower vehicle. In this model, di, τi are considered constant and independent
of speed. According to figure 7.2, these characteristics result in linear relationship between speed and spacing si
=di+τi
v.
2.2 Stop-and-Go traffic Based on Asymmetric Theory
2.2.1. Generating stop-and-Go Wave
According to figure.8, instability of traffic flow and lane change maneuvers stop-and-go waves can be generated in unstable traffic which is near D-curve in congested traffic; also lane changing may cause stop-and-go waves as illustrated in figure 8. But, the instability in- voked in stop-and-go traffic is relatively small and can- not be propagated upstream unless the following traffic is also near D-curve; while the effect by lane changes are greater, and can propagate even the following traffic is not near the D-curve.
Figure 9 shows vehicle trajectories in congested traf-SDccjam SAccjam
DCC phase
ACC phase
Spacing (ft)
Speed
(ft/s)
𝑉2
𝑉1
Flow
(veh/hr
)
Density (veh/km)
𝐾𝐴𝐶𝐶𝑗𝑎𝑚 𝐾𝐷𝐶𝐶𝑗𝑎𝑚
Free Flow
Coasting
Acceleration
Deceleration
Figure 6. Vehicle trajectory with speed (v) (Newell, 1965)
Figure 7.1. Figure 7.2.
Linear approximate for vehicle trajectory The relationship between spacing and speed
Figure 7. Newell’s car following model (Newell, 1965)
1. Generated wave by traffic instability 2. Generated wave by lane changing
Figure 8. Vehicle movement in lane changing case and traffic instability (Yeo, 2008)
Speed
(ft/s)
Spacing (ft)
V
Decreasing spacing by lane change
Follower Vehicle
V
Decreasing spacing by instability
Follower Vehicle
Spacing (ft)
Speed (
ft/s)
v
𝑣′
di
τi
𝑠i
𝑠i′
Time(s)
Distan
ce
(ft)
di
τi
Time(s)
Sp
aci
ng(ft)
spacing
𝑋n−2 (t)
𝑋n−1 (t)
𝑋n (t)
Time (s)
Distan
ce
International Journal of Transportation Engineering, fic and illustrates the generation of stop-and go waves.
Figure 8.1 shows the example of stop-and-go genera- tion by instability in congestion. In this case, the waves generated are short-lived with minimal impact. Figure
8.2 shows the generation of waves due to lane chang- ing. Before and immediately after the incoming lane changes, following drivers have to decelerate to yield space to the lane changing vehicle generating stop-and- go waves. This is the reason why stop-and-go waves are frequently observed to be formed near on-ramp merg- ing areas.
2.2.2 Growth
The mechanism of the growth that focuses on the am- plification of the waves is basically same with the one of generation. According to figure 10, when stop and go traffic is near D-curve, driving in small spacing and speed drop, a small disturbance can propagate more speed drop to upstream. As long as the upstream traffic is near D curve, stop and go traffic grow and propagate to upstream. In other words, stop and go traffic waves, ACC – DCC, diverge from others. According to figure 11, the mechanism of the dissipation is shown that it is similar to the growth stop-and-go traffic, but stop and go traffic waves, ACC DCC, converge from others.
2.3Lane Changing Maneuvers
When a vehicle has lane changing maneuver in conges- tion traffic, decreasing safe spacing results in
absorb-ing stop and go wave effect by follower vehicle and decreasing speed drop. When safe spacing is enough, vehicle platoon increases its speed that results in devel- oping traffic oscillation toward traffic upstream.
2.3.1 Determine platoon size
Based on Suh’s researches, if platoon size becomes big- ger, it may be possible to include heterogeneous traffic in one platoon and traffic variables extracted from the program represent average value of mixed traffic state. In order to find lane change maneuvers and grow stop and go waves, we should select platoon size from 1 to 9 vehicles. For these reasons, we selected a proper pla- toon size of three vehicles per platoon for NGSIM data.
2.3.2Draw Trajectory Line
Based on Ahn’s researches, the driver has 12-second anticipation period in a lane change. If a lane change occurs before the stop-and-go wave, the driver can be affected by the perturbation. According figure 12, fol- lower trajectory determines during 12 sec prior and posterior to the point.
2.3.3Draw an Imaginary Trajectory on the Down- stream
Based on Ahan’s researches, lane change maneuvers of follower driver is during 12-second anticipation pe- riod. If lane change maneuvers occur in downstream, downstream wave influences follower vehicle behavior.
1.stop-and-go generation by instability 2 The generation by lane changes.
Figure 10. Life cycle of growth stop-and-go traffic (Yeo, 2008)
Figure 11. Life cycle of dissipation stop-and-go traffic (Yeo, 2008)
Based on these reasons, imaginary trajectory is deter- mined by shifting the trajectory line as much as the an- ticipation period. Also, average wave speed is applied about 16kph.
2.3.4Separate the Time Window
Based on Ahan’s researches, incoming and outgoing lane change effects are different each other in the time window. Once the driver enters a stop-and-go wave, his/her driving behavior is independent of whether the outgoing lane changes occur or not. Hence, the time window is divided into two regions due to the separa- tion of the affected area of incoming and outgoing lane changes.
2.3.5Assign a Value to Lane Changes
It is assigned a positive value (+1) to an incoming lane changes, whereas the outgoing lane changing vehicle is assigned as a negative value (-1). Finally, it is founded that count all lane changes and sum up to find the net lane changes inside the searching window.
1.
Analysis of Results
3.1 Comparing Acceleration and Deceleration Wave Speed Based on Two Theories
According to figure 13, acceleration and deceleration phases are analyzed based on Newell’s and asymmet- ric theory in space-time curve. It shows both accel-A state
Time (s)
Sp
ace
(f
t)
Generation
Growth
D-state Jam
افرس هلص ناکم ی ب ه لیلد دیاپان یرا یفارت ک
A-state
Time (s)
Sp
ace
(f
International Journal of Transportation Engineering,
Figure 12. Influencing period of lane changing maneuvers (36sec time window) (Suh and Yeo, 2011)
eration and deceleration processes. There is a com- parison between the trajectories of the new theory (solid lines) with the ones (dotted lines) from New- ell’s simplified car-following theory (2002) which conforms to LWR theory. If vehicle starts from state ‘1’ on D-curve with short spacing and the leader ve- hicle accelerates, the spacing will be enlarged until the vehicle reaches to point ‘3’ on A-curve. From this point, the follower vehicle will change driving mode to acceleration. After securing sufficient spacing for
the new speed, it will speed up and reach state ‘4’. The vehicle can stay on state ‘4’ until the lead vehicle changes its speed, so state ‘4’ can be an equilibrium point on A-curve. If the lead vehicle starts braking, the subject vehicle will not start deceleration until it reaches D-curve. Passing D-curve, it will start decel- eration and find a new equilibrium at point ‘1’. As shown in figure 13.1, in phase transition, the wave speed w is slower than the one in LWR theory de- noted as w’.
1.Expected time-space plot of example 2. Speed-spacing relation of example
Figure 13. Transition between traffic phases(Yeo, 2008)
3 6
1,2 DC C
𝑉1
𝑉2
𝑆jam 𝑆jam(A) Spacing (ft)
Sp
eed (f
t/s)
ACC 5
4
Curve A curve
D
W
𝑤′
1
1 2 3
4
6
5
AC C
DEC
Newell’s Trajectory
Sp
ace
(f
t)
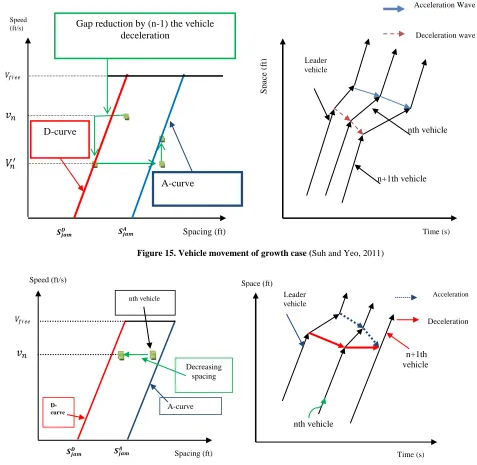
3.2 Stop-and-Go Waves of Traffic Instability According to figure 14, results of analyzing NGSIM data presents based on asymmetric theory traffic state changes before and after meeting a stop-and-go wave. It shows how the traffic state changes in fundamental diagram for two cases of stop-and-go wave; growth and dissipation. In stop-and-go waves’ growth case as shown in figure 14.1, traffic state is near D-curve before the platoons enter the stop-and-go wave. As they cross the wave, traffic state moves to near A-curve in funda- mental diagram. It implies that stop-and-go waves grow when they propagate in D-state traffic (Traffic state near D-curve), and after the passing, the state changes to A- state (Traffic near A-curve). According to figure 14.2, in the other case of stop-and-go wave’s dissipation, traf- fic states move from A-state to D-state. In other words, stop-and-go waves dissipate when they meet the enter- ing A-state traffic, and A-state traffic absorbs impacts from stop-and-go wave and moves to D-state traffic. It is also noticeable that traffic absorbs impacts from stop-and-go wave and moves to D-state traffic. It is also noticeable that after passing dissipating stop-and- go wave, the traffic state again changes to D-state, in which they can foster stop-and-go waves. This can ex- plain the periodic appearance of stop-and-go waves in congested traffic, which is frequently observed. Figure 15 shows a detail mechanism of how this hap-pens. It shows a vehicle movement in growth case in speed-spacing plane and time-space plane. If the traffic state of vehicle n is near D-curve. Then, leader vehicle
(n-1) starts decreasing the vehicle speed, and the fol- lowing driver has a deceleration coasting time. So, dis- tance gap to the leader vehicle is reduced. However, the follower cannot help braking to avoid the collision. If the leader vehicle starts acceleration after passing the wave, the following driver keeps the new speed (vn’) for a period of time (i.e. acceleration coasting time) until the spacing becomes wide enough. When the fol- lower finds that the spacing is big enough to avoid addi- tional braking, he/she also starts accelerating. Through these procedures, the traffic state after passing moves to near A-curve.
According to figure 16, since drivers are near A-curve before meeting a stop and-go wave, they have a mar- gin of gap to absorb impacts (gap reduction) of stop- and-go wave. If possible, people are unwilling to re- duce speed of vehicle, and drivers keep coasting with the same speed. Finally, traffic state moves to D-state, or even if they have to decelerate, the impact (speed drop and the period) is much less than the other case, which results in the dissipation of stop-and-go waves. In spite of a small perturbation of leader vehicle, the nth vehicle does not decrease vehicle speed since he has a large gap to offset the effect of perturbation. He does not brake but accept the small gap. In the speed-spacing plane, vehicle moves to near D-curve due to the leader vehicle’s perturbation. Therefore, in dissipation case, the traffic that passes a stop-and-go wave becomes un- stable. Accordingly, the results obtained coincide with the asymmetric traffic theory.
1.Growth state 2. Dissipation
International Journal of Transportation Engineering, Figure 15. Vehicle movement of growth case(Suh and Yeo, 2011)
Figure 16. Vehicle movement of dissipation case(Suh and Yeo, 2011)
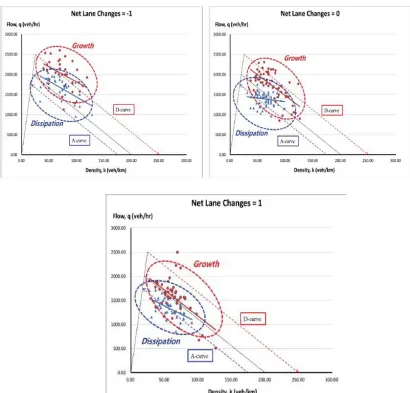
3.3 Stop-and-Go Waves of Lane Changing According to fig.16, lane changing impacts on stop- and-go waves are studied using 36 sec time window. Figure 17 compares the traffic states according to the net lane changes for growth and dissipation case. In all of the net lane changes, wave growth case occupies higher part in the flow-density plane than dissipation case for the same number of net lane changes. It means that if the traffic state is more stable, it is more probable that the wave develops into dissipation than growth. According to figure 18, if a lane changing vehicle come in the target lane as nth vehicle drives a large spacing,
near A curve in speed-spacing plane, the gap has almost halved due to the new incoming vehicle and the fol- lower’s gap suddenly drops. Finally, stop-and-go wave grows in platoon. Consequently, as the net lane changes increases, even a very stable traffic can be developed into growth state of stop-and-go wave. Gap becomes wider as a result of outgoing lane changing vehicles. Then, drivers are able to follow more comfortably. Nevertheless, even if outgoing lane changes occur, a very precarious traffic causes growth of stop-and-go waves. In this situation, stability of traffic gets poor and the positive effects of outgoing lane changes on
follow-nth vehicle
D-curve A-curve
Decreasing spacing (
ft/s ) Speed
Spacing (ft)
𝑉𝑓𝑟𝑒𝑒
𝑣𝑛
𝑺𝒋𝒂𝒎𝑫 𝑺𝒋𝒂𝒎𝑨
nth vehicle
هرامش هلیس n
n+1th vehicle
هرامش هلیس n Leader
vehicle (
ft ) Space
Time (s)
Acceleration
Deceleration Leader
vehicle
n+1th vehicle
Space
(f
t)
Time (s)
nth vehicle
Acceleration Wave
Deceleration wave
Gap reduction by (n-1) the vehicle deceleration
A-curve D-curve
𝑉𝑓𝑟𝑒𝑒
𝑣𝑛
𝑉𝑛′
𝑺𝒋𝒂𝒎𝑫 𝑺
𝒋𝒂𝒎 𝑨
Speed (ft/s)
Figure 17. Lane changes and stop-and-go waves (Suh and Yeo, 2011)
ing traffic are cancelled out. In dissipation case, it has a similar aspect with the growth case. As the net lane changes increase, traffic state developed into dissipa- tion also moves downward in fundamental diagram. About dissipation case, when go out to other lanes, wave in platoon dissipate because of increasing spacing and driv- ing near A curve, free speed. In comparing, when a vehicle comes in target lane, spacing decreases between follower and leader vehicles. But wave effect in platoon absorbs and dissipates because of enough safe spacing. According to results of lane changing movements, because spacing isn’t enough, wave grows in platoon as coming in or going
out target line in congestion traffic condition that results in increasing or decreasing spacing. In free speed condition, because spacing is enough, wave effects absorb and dis- sipate in follower platoon while both coming in and going out target line. According to figure 19, comparing between both growth and dissipation cases in change lane maneu- vers indicate following results. In all of the cases, wave growth case occupies higher flow – density diagram, near D curve and wave dissipation case occupies lower flow – density diagram, A curve. Also, increasing lane chang- ing maneuvers results in trending growth and dissipation wave cases to lower part of fundamental diagram.
Figure 18. Vehicle movement in lane changing case (Suh and Yeo, 2011)
D curve
A curve
Gap reduction by lane change deceleration
𝑺𝒋𝒂𝒎𝑫 𝑺
𝒋𝒂𝒎 𝑨
𝑉𝑓𝑟𝑒𝑒
𝑣𝑛
𝑉𝑛′
Speed ( ft/s)
Spacing (ft)
Lane change vehicle
D curve
A curve
nth vehicle
Space
(f
t)
International Journal of Transportation Engineering,
2.
Conclusions
Figure 19. Comparison of growth and dissipation under same net lane changes (Suh and Yeo, 2011)
is classified into 5 phases: free flow, acceleration, decel-Stop and go traffic commonly observed in congested
freeway traffic results in traffic oscillation. In order to model stop and go traffic phenomena, many traffic theorists have adopted theories from other fields such as fluid mechanics and thermodynamics or car follow- ing models based on kinematic. Because of numerous parameters, their efforts to model the traffic at a micro- scopic level haven’t been successful yet. Also, it isn’t found relation to growth and dissipation of stop-and-go waves and the total number of lane changing maneu- vers. In order to overcome the limitations of the exist- ing theories, a microscopic asymmetric traffic theory is proposed based on analysis of individual vehicle trajec- tories. According to the proposed theory, vehicle traffic
changing maneuvers create a perturbation to congested traffic. Because safe spacing isn’t enough, stop and go wave develops toward upstream traffic. If traffic is near A curve, stop and go wave dissipates because of safe spacing. To reflect the needs in identifying the impacts of the lane changing events on stop-and-go traffic, time window for searching lane changes and the net lane changes have been employed. Finally, the development and evolutionary characteristics of stop-and-go traffic have been observed according to the net lane changes. Moreover, traffic state transition by a stop-and-go wave has been investigated and the comparison between growing and dissipating waves has been conducted. The comparison result in the growth and dissipation indicated that under the same net lane changes, the regions of traffic state occupied in growing and dissi- pating wave are different in fundamental diagram. It is occupied higher fundamental diagram, near D curve, in growth condition. Although vehicle goes out from tar- get lane and increasing safe spacing, but wave devel- ops in platoon because of driving near D curve. Also, dissipation condition occupies the lower fundamental diagram, near A curve. However coming in target line of vehicle results in decreasing safe spacing but safe spacing is enough because of driving near A curve.
3.
References
-Ahn, S. and Cassidy, M. (2007) "Freeway traffic oscil- lations and vehicle lane-change maneuvers", The 17th International Symposium on Transportation and Traffic Theory, Elsevier, New York., pp. 691-710.
-Bilbao-Ubillos, J. (2008) "The costs of urban conges- tion: estimation of welfare losses arising from conges- tion on cross-town link roads", Transportation Research Part A, 42 (8), pp.1098–11082- Authors of the paper, Date, Title of the paper, Conference Title, pp. 256-300.
-Daganzo, C. F. (1997) "Fundamentals of transporta- tion and traffic operations", Transportation Research Part B, Vol. 33, pp. 366-379.
-Del Castillo, J.M. (2001) " Propagation of perturba- tions in dense traffic flow: a model and its implications",
Transportation Research Part B Vol. 35, pp. 367-389.
-Daganzo, C.,F. (2006) “In traffic flow, cellular autom- ata = kinematic waves”, Transportation Research Part B, Vol. 40, pp. 396-403.
- Edie, L.C. (1965) "Discussion of traffic upstream measurements and definitions", Proceedings of The Second International Symposium on The Theory of Road Traffic Flow London, pp. 139-154.
-Forbes, T.W. (1963) "Human factor consideration in traffic flow theory", Highway research Record 15, pp. 60-66.
-Foote, R. S. (1965) "Single lane traffic flow control", Proceedings of The Second International Symposium on The Theory of Road Traffic Flow, London, pp. 84-103.
- Gipps, P. G. (1981) "A behavioural car-following model for computer simulation", Transportation Re- search Part B, Vol. 15, pp. 106-111.
-Jonghae,S., Hwasoo,Y. and Alexander, S. (2012) "A Study on the Wave Development And Evolution Char- acteristics of Stop-and-Go Traffic", The 91th Annual Meeting Transportation Research Board Washington, DC. pp. 176-140
- Koshi, M., Kuwahara, M. and Akahane, H. (1992) "Capacity of sags and tunnels in Japanese motorways", ITE Journal (May issue), pp. 17–22.
-Kerner, B.S. and Rehborn, H. (1996a) "Experimental features and characteristics of traffic jams", Physical Review E Vol. 53, pp. 1297-1300.
-Kerner, B.S. and Rehborn, H. (1999) "Theory of con- gested traffic flow: self-organization without bottle- necks", Proceedings of the 14th International Sympo- sium on Transportation and Traffic Theory, Pergamon, New York, pp.147–171.
International Journal of Transportation Engineering, -Kim, T., Zhang, H.M. (2004) "Gap time and stochastic
wave propagation", 2004 IEEE Intelligent Transporta- tion Systems Conference, pp. 88-93.
-Lighthill, M.J., Whitham, G.B. (1955) "On kinemat- ic waves: II. A theory of traffic flow on long crowded roads", Proceedings of the Royal Society, London, Ser.A 229 1178, pp. 317–345.
- Laval, J. A. (2005) "Linking synchronized flow and kinematic wave theory. In: Schadschneider, A. and Poschel, T., Kuhne, R., Schreckenberg, M., Wolf, D. (Eds.)", Traffic and Granular Flow ’05. Springer, pp. 521–526.
-Laval, J. A. and Daganzo, C. F. (2006) "Lane-chang- ing in traffic streams", Transportation Research Part B, 40 (3), pp. 251–264.
- Laval, J. A.(2006)" Stochastic processes of moving bottlenecks: Approximate formulas for highway capac- ity", Transportation Research Record 1988, pp. 86–91.
- Laval, J.A. and Leclercq, L. (2010) "A Mechanism to describe the formation and propagation of stop-and- go waves in congested freeway traffic", Philosophical Transactions of The Royal Society A., 368(1928), pp. 4519-4541.
- Ma, T. and Ahn, S. (2008) "Comparisons of speed- spacing relations under general car following versus lane changing", Transportation Research Record: Jour- nal of the Transportation Research Board, No. 2088. pp. 138-147.
- Newell, G. F. (2002) "A Simplified car-following theory: a lower order model", Transportation Research Part B, Vol. 36, pp. 196-205.
-Nagel, K. and Nelson, P. (2005) "A critical compari- son of the kinematic wave model with observational data", Transportation and Traffic Theory, Proceedings of the 16th International Symposium on Transportation and Traffic Theory, pp. 145-163.
-Richards, P.I. (1956) "Shock waves on the highway", Operations Research 4, pp.42–51.
-Suh, J. (2009) "A study on the Wave Characteristics of Stop-and-Go Traffic", Master Dissertation, Depart- ment of Civil and Environmental Engineering, KAIST. pp.1325-1334
-Suh, J., & Yeo, H. (2011) “A Study on the Wave Development and Evolution Characteristics of Stop-and-Go Traffic”, In Proceedings of the Eastern Asia Society for Transportation Studies The 9th International Conference of Eastern Asia Society for Transportation Studies, pp. 340-340.
- Yeo, H. (2008) "Asymmetric Microscopic Driving Behavior Theory, Doctoral Dissertation, Department of Civil and Environmental Engineering", University of California, Berkeley, U.S.A. pp.150–31
-Yeo, H. and Skabardonis, A. (2009) "Understanding stop-and-go traffic in view of asymmetric traffic the- ory", Transportation and Traffic theory 2009: Golden Jubilee, Springer, pp. 99-115.
- Zielke, B.A., Bertini, R.L. and Treiber, M. (2008) "Empirical Measurement of Freeway Oscillation Char- acteristics: An International Comparison", Transporta- tion Research Record: Journal of the Transportation Research Board, No. 2088. pp. 57-67.
- Zheng, Z., Ahn, S., Chen, D. and Laval, J. (2010) "Freeway Traffic Oscillations: Microscopic Analysis of Formations and Propagations using Wavelet Trans- form", The 19th International Symposium on Transpor- tation and Traffic Theory, pp. 812-542.
- Zheng, Z., Ahn, S., Chen, D. and Laval, J. (2011a) "Applications of wavelet transform for analysis of free- way traffic: bottlenecks, transient traffic, and traffic os- cillations", Transportation Research Part B 45 (2), pp. 372–384.