Reliability and Availability Improvement in
Economic Data Grid Environment Based On
Clustering Approach (RAG)
Ali Abbasi1 , Amir Masoud Rahmani2 , Esmaeil Zeinali Khasraghi3
Received (2015-02-13) Accepted (2015-03-19)
Abstract - One of the important problems in grid environments is data replication in grid sites. Reliability and availability of data replication in some cases is considered low. To separate sites with high reliability and high availability of sites with low availability and low reliability, clustering can be used. In this study, the data grid dynamically evaluate and predict the condition of the sites. The reliability and availability of sites were calculated and it was used to make decisions to replicate data. With these calculations, we have information on the locations of users in grid with reliability and availability or cost commensurate with the value of the work they did. This information can be downloaded from users who are willing to send them data with suitable reliability and availability. Simulation results show that the addition of the two parameters, reliability and availability, assessment criteria have been improved in certain access patterns.
Keywords - Data Grid, Dynamic Data Replication, Fault Injection, Reliability, Availability
I. INTRODUCTION
C
urrently, Grid computing has emerged as anew field. What distinguishes this technology
than previous distributed computing is to focus on large-scale resource sharing, new applications,
and in most cases the orientation of the efficiency.
Data replication is a well known method for distributing data in distributed systems [1].
In this study, a method to improve the availability and reliability of the data grid environment is introduced. At the beginning of this section, the motivation for this work is examined. Grid system that is all they can by own computer, from any source in the world, and this is no spatial constraints, and user location can be anywhere in the world. Just connect own computer to the grid and then can be use the capacity of the storage and processing of the other computers. Grid will have created a system that everyone can easily use other data and resources.
The purpose of the grid, creating a uniform environment in which computers can communicate with each other, understand each other messages and requests to respond, all users see and feel homogenous environment.
That is, any user or application can specify a method to access the resources they need and use them, and all existing concerns, such as connection problems, the non-homogeneity of the computer, etc., remain hidden from his sight.
Of course, to achieve a homogeneousenvironment, uniform and equal to all computers in the world are not allowed, but the only solution is to use grid technology. Grid connected computers, workstations, servers and storage resources together and it provides the mechanisms needed to connect everyone to that. 1- Student, Islamic Azad University, Science and Research
Branch, Qazvin, Department of Computer, Qazvin, Iran ([email protected])
2- Supervisor, Islamic Azad University, Science and Research Branch, Tehran, Department of Computer, Tehran, Iran ([email protected])
Users no longer have to worry about the location of resources and applications, the grid, assigns the most appropriate resource to the user. among the many uses Grid, Data Grid is one of the most important services. Grid data, a data management system. Storage resources that are located in
different parts together. The progress that was
achieved in Grid technology, Grid data needs to be raised. The programs were created large quantities of data and to manage the high volume of data needs to be a management system.
For example, CERN(The world’s largest laboratory for particle physics and nuclear physics, the vast and unique collection is located on the border of France and Switzerland.), one of the world’s largest science project is to annually produce large quantities of data[2]. If the volume of data to be concentrated in a single place, the performance was extremely low, because access to a place may be a bottleneck at that point. On the other hand, if the data is corrupted, there was not another version to replace it and it was very dangerous.
To solve this problem, one of the main data Grid services is used as data replication. By using data replication, data replicate within the
system, and replicas placed in different locations.
As a result, the user or application can go to the nearest replica and use it. So the problem will not be the bottleneck and a single point of failure. Because in case of failure of one version can be used in other versions. In addition, the access speed is too high because any user who has the closest version.
Another advantage of replication is that less bandwidth is occupied and fault tolerant forms. There are several techniques for performing replication according to need, one of the methods chosen.
The dynamic behavior of grid users make
difficult the decision on data replication to
achieve maximum access. many suggestions on improving the response time of the system or data consistency have been proposed, however, little attention has been on the reliability of the system. Therefore, the dynamic calculation of reliability, availability and clustering them based on calculated values will be examined, so that the reliability and availability of users data at locations corresponding to the value of work (pay) their takes. This data can be downloaded to users who want to send them, with adequate reliability and availability to other users.
Clustering is a useful technique for improving high availability. In the physical cluster, a set of servers are physically connected, and in virtual clustering, logical servers are connected. In economic data grid, should be paid for the use of shared resources. Also in economic data grid, each user determine own budget and get space with availability and reliability appropriate with own payment requested.
Therefore, it is necessary to provide the reliability and availability of places that are dynamically computed to be used when needed.
In researches, the reliability of the system is under consideration and considering need for users to access reliable and fast needed data, is necessary to explored further in this area. Thus improving the reliability and availability of data in a distributed grid environment are the goals of this research. Furthermore, history of previous related work to research, such as data replication techniques, comparison with other techniques,
some activities are defined in terms of availability
and reliability.
In the next section, the proposed method which includes the dynamic calculation of the reliability and availability with algorithms and architecture
are described. The final section contains the
results of simulation, simulation supplyment implementation, evaluation criteria, comparing
the proposed method with five of the optorsim
simulator. Finally a conclusion or summary of the results of the research, limitations and future work are described.
II. RELATED WORKS
In this section we introduce and study some of the algorithms presented about the reliability and availability of dynamic data replication in data grid will be discussed. Performance of replication techniques is highly dependent on
data grid architectures. Different architectural
models, have been proposed. The most basic models, Hierarchical data model (multi-layer). This model has a 5-layer structure, layer 0 is known as CERN, in which all the layers have been produced. In tier 1 national centers, regional centers at layer 2, layer 3 working groups, and in layer 4 desktops are displayed.
storing the replica on the site, as long as the user does not have to manually delete the copy, the copy will not go away. Static methods can not be synchronized with the user’s behavior. Therefore not suitable for high volume and high number of
users [9]. The benefits of static are high tolerance
forms, no overhead (in a dynamic way there), Scheduling tasks quickly, the number of replica and host nodes that at the start of its life cycle, static elected and after that, no replica is created or removed [5,6].
In the dynamic method, data replication is dependent on the needs and requests. Also, create, delete and manage the replica is done automatically. Dynamic method, can be coordinated with changing user behavior. And create a new replica for the data that are frequently requested. Since the Data Grid is a dynamic system and user needs are changing, dynamic replication techniques are suitable for these systems. Because according to the pattern of the user request, storage capacity, bandwidth, and the possibility of creating a replica of the new node will change. If the replica does not request for long term, be smart, by replica removing algorithm, disappears [3,4,7,8].
Khanly proposed PHFS (Predictive Hierarchal Fast Spread) to reduce data access latency [13]. This proposal is developed from Ranganathan (Fast Spread) proposal. PHFS, predictive techniques are proposed for immediate use of
files and to pre replicate them in the hierarchical
data grid, the path from the source to the customer. PHFS works in two phases. proposed PHFS (predictive hierarchal fast spread), which is a replication technique designed to decrease the access latency of data access. This is an extension of fast spread presented by Ranganthan et al. PHFS uses predictive techniques to predict
the future usage of files and then prereplicates
them in hierarchal data grid on a path from source to client. It works in two phases, in phase one it
makes the file access log files by collecting the
access information from all over the system. In the next phase it applies data mining techniques like clustering and association rule mining
to find useful knowledge like clusters of files
that are accessed together or most frequent sequential access patterns. In this way PHFS
finds the relationship between the files for future predictions. The relationship of files is assigned a value α which is between 0 and 1, 0 representing no relationship between two files and 1, representing
that the two files are completely related.
Rahmani and Saadt in 2012 A new Pre-fetching based Dynamic Data Replication Algorithm were proposed [14]. This method does predict the future needs of the Grid sites and before receiving the request, the pre-replication them. These predictions, according to the
sequence in the file access history of grid sites, done. When the grid sites require a set of files, the files are available locally. Therefore, response
time, access latency and bandwidth consumption
is significantly reduced.
In this method, a general database for all virtual
organization to track all file access sequences of Grid sites, is defined. Thus, the prediction models
are available to suit all access patterns, from the current virtual organization can be done. The
received requests from the different sites are
separated. Because requests are not sequences of
different sites.
A virtual organization, including several grid site, and for each virtual organization is a local server, The replica list on the local server, Access
to files in the current virtual, is faster than from
other organizations. PDDRA consists of three
phases: storing file access patterns, requesting a file and performing replication and pre-fetching
and replacement.
In 2010, Sashy are considered network
topology in different clusters, Sites are enclosed within the cluster, This algorithm is modified file availability by replicating inside the cluster
[10]. Data produced in larger clusters, and then distributed throughout the cluster headers. All
file access frequency is determined, and most files to sites that have been repeatedly requested,
with considerations of geographical and temporal locations are replicated.
The metric used to evaluate the performance of this algorithm are the Mean Job Execution time, and mean storage. The algorithm for the simulation were compared with the Simple, LRU, LFU algorithms. The results showed that, compared to the DRA (Dynamic Replication Algorithm) [12] much better.
Ming Cheng Lee in 2012, proposed an adaptive algorithm for data replication (Popular File Replication First) called PFRF [16]. The
popular files, are replicated at appropriate sites.
To evaluate the PFRF algorithm, distributions of Zipf-like, Geometric, Uniform have used.
The algorithm is simulated by Gridsim. The
results show that, PFRF can effectively improve
the Turnaround time, bandwidth for data delivery and availability of data in comparison with other algorithms. Data grid functions such as scalability
are main grid service to manage data files and
replicas scattered across the world.
Replica selection is an essential high -level
service that selects a Grid location which verifies
the shortest response time for the users jobs
among numerous different locations. In the grid
environment, estimating response time precisely is not a simple task. Existing replica selection algorithms consume high response time to retrieve replicas because of miss-estimating replicas transfer times.
Patel and jerradat in 2013 proposes a novel replica selection algorithm that considers site availability in addition to data transfer time. Site availability has not been addressed in previous
efforts in the same context this paper does.
Site availability is a new factor that can be utilized to estimate response time more accurately. Selecting an unavailable site or selecting a
site with insufficient time will likely lead to
disconnection. This in turn will require shifting to another site to resume the download or to start the download from scratch depending on the fault tolerance mechanism. Simulation results demonstrate that the performance of the new algorithm is proved to be better than the existing algorithms mentioned in literature. The purpose of estimating the best site, a site that is closest (quality gap) to be the ideal. The simulation is done by optorsim simulator [15].
Bkhta, Meroufel In 2012, were combined together the replication algorithm based on popularity and replication algorithm based on availability [18]. In this approach, the minimum number of replicas for each data element is the number of replica that the director wants the availability to that appropriate point. In this approach, the primary replica should not be deleted even if it is not popular because it reduces the availability of the desired action. This approach is based on semi-centralized hierarchical topology. This topology minimizes the receipt of the message, such as management and communication that are created in each cluster. Also, minimized the number of messages
that exchanged through the tree architecture. Decisions are taken on the basis of data availability and popularity. The simulation results show the
effectiveness of our replication strategy in terms
of response time, the unavailability of requests, and availability. This technique improves the damage tolerance.
Brent Rood Michael J. Lewis in 2010 says availability predictors can forecast unavailability, and can provide schedulers with information about reliability, which helps them make better scheduling decisions when combined with inform ation about speed and load [19]. This paper studies using this prediction information for deciding when to replicate jobs. In particular, their predictors forecast the probability that a job will complete uninterrupted, and their schedulers replicate those jobs that are least likely to do so. This technique is better than the improved
makespan. makespan means the difference
between the start and end of the sequence of
tasks. They define a new “replication efficiency”
metric, and demonstrate that our availability predictor can provide information that allows
our schedulers to be more efficient than the most
closely related replication strategy for a variety of loads in a trace-based grid simulation.
Replication Efficiency = Makespan Improvement/ReplicasPerJob
Check pointing and replication are the two primary tools that grids can use to mitigate the
effect of this resource volatility.
According to a survey of previous work, a small percentage of the portfolio, consider the reliability of the data. The incentive attention to reliability and availability of the site and the
file will be involved in data replication. The
parameters of reliability and availability, are dependability elements.
III. PROPOSED METHOD
In this section, the methods and algorithms of research proposed. The main objective of the proposed method to improve the availability and reliability of economic data grid, which acts by clustering sites. The proposed method, check the computation of reliability and availability
of the site and file. The proposed method can be
implemented in several phases.
clustering the sites based on value obtained in the
first phase.
Phase III, get file, and file cost from user, and assign value of work to files on a user pay
basis, and assign reliability and availability
of user files according to the value of work.
and the fourth phase, the decision to replicate
or delete files based on the calculated values.
Furthermore, the implementation of above steps
are followed. In the first phase, the method for
calculating the availability and reliability of site will be explained. Reliability means how long the system has been continuously active, and availability is the percentage of time that a system is in operational mode. Availability is amount of time that a system or component to perform own function. Availability is related to
reliability but it is different.Reliability, measure
the time between failures occurring in the system. Failure of hardware and software components
have different characteristics. In this way, in
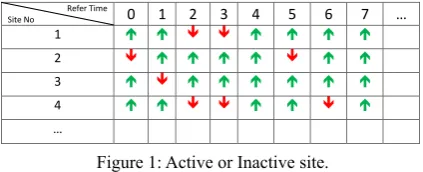
certain and pre-determined time, sites visited and active or inactive status of sites is recorded. For
example, in Figure 1, the first row represents a refer time to sites and the first column represents
the ID or name of the site. Upward arrows represent the active site, and downward arrows represent inactive site, when refer to site.
… 7 6 5 4 3 2 1 0
Refer Time Site No
1
2
3
4
…
Figure 1: Active or Inactive site.
As we know, the availability of equation (1) is obtained.
𝐀𝐀𝐀𝐀=𝐄𝐄𝐄𝐄[𝐔𝐔𝐔𝐔𝐔𝐔𝐔𝐔𝐔𝐔𝐔𝐔𝐔𝐔𝐔𝐔𝐔𝐔𝐔𝐔𝐔𝐔𝐔𝐔𝐄𝐄𝐄𝐄[] +𝐔𝐔𝐔𝐔𝐔𝐔𝐔𝐔𝐔𝐔𝐔𝐔𝐔𝐔𝐔𝐔𝐔𝐔𝐔𝐔𝐔𝐔𝐔𝐔𝐄𝐄𝐄𝐄[𝐃𝐃𝐃𝐃𝐃𝐃𝐃𝐃𝐃𝐃𝐃𝐃𝐃𝐃𝐃𝐃𝐔𝐔𝐔𝐔𝐔𝐔𝐔𝐔𝐔𝐔𝐔𝐔𝐔𝐔𝐔𝐔] ] (1)
Thus, the availability of the site is the result of dividing the number of active sites by the total number of sites. Also, the reliability of the site, the number of last continuesly times that site is active. The site is constantly active during the visit.
𝑅𝑅𝑅𝑅(𝑡𝑡𝑡𝑡) =𝑛𝑛𝑛𝑛𝑛𝑛𝑛𝑛(𝑡𝑡𝑡𝑡)
0 (2)
In formula (2) n0, the number of active systems in the experiment. And the n(t) the number of systems that after a time t is still working properly. For example, levels of availability and reliability of the four sites (Figure 1) is calculated as shown in Table 1.
Table 1: Calculated values of reliability and availability
Site Availability Reliability Reliability (%)
1 6
8 × 100 = 75% 4
4
8 × 100 = 50%
2 75 % 2 25 %
3 7
8 × 100 = 87/5% 6 75 %
4 5
8 × 100 = 62/5 % 1 12/5 %
Optorsim simulator can not calculate the availability and reliability, it must be generated supplement simulator. How to produce complementary simulator, are described in simulation results section. If the number of sites
are available and n times at different times, the
sites to be visited and the number of active and inactive sites counted after each visit, Availability and reliability of their content can be dynamically calculated, and After any number of refers, both the availability and reliability can be achieved. In the second phase, after the calculation, clustering should be based on both the availability and reliability of the site is done.
Clustering is one of the important methods in data mining, due to the proximity of the natural problems in many ways is considered. One of the most widely used clustering algorithms is the k-means algorithm. K-means algorithm has
many applications in various fields of science and
technology.
Despite its simplicity, this method is a basic method for many other clustering methods (such as fuzzy clustering) is [6]. This is an exclusive
and flat.
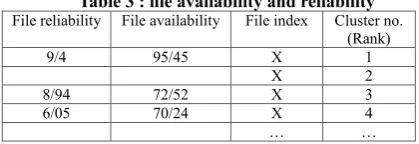
In the third phase, to classify files, calculation
and allocation of availability and reliability
for each file, the values in Table 2 should be
considered. Given the value of work, the degree to which allocated according to Table 2. Degree (clustered index) is proportional to the cost paid by the user.
The user specified data and cost, then assign
Table 2: value of work
Value of Work
Level Degree(Rank)
Scope of Availability Value (%) Scope of Reliability
Value
A 1
91-100 9-10
B 2
81-90 8-10
C 3
71-80 7-10
D 4
61-70 6-10
In this study we have defined four levels value
of work. each level has a predicted values. It is assumed that the lower the value of work, the low availability, and reliability may be reduced. Of
course, there may be a high level of file reliability
at the lowest level of the value of work.
The following steps should be taken. Initially
allocated to each file a random value of work.
This level is an integer value that is randomly generated between the numbers one through four. Then, from table 2 ranges associated with each value of work is extracted, and a random number is generated in the area, and the availability and reliability values are determined.
For example, if the value of work obtained number three, get a random number between
71 and 80 for the availability of the file, and a
random number between seven and ten to obtain
the reliability of files. Values obtained are shown
in Table 3.
Table 3 : file availability and reliability
File reliability File availability File index Cluster no.
(Rank)
9/4 95/45 X 1
X 2
8/94 72/52 X 3
6/05 70/24 X 4
… …
Table 3, is the resulting output of the calculation and allocation of the availability and
reliability of the file. Index file, the field has been added to filetable, in job configuration file. In the
fourth phase, based on the outputs of Phase I, II and III made the decision to replicate or delete
files.
1- RAG Architecture
The proposed architecture is shown in Figure
2. As can be inferred from the figure, the proposed architecture is composed of two parts. The first
part of changes to the optorsim simulator (the dotted), and the second part is not covered by the optorsim simulator. The separate parts as shown in Figure 2, the outside of the dotted, and is known for producing simulations and calculations.
Figure 2 : RAG Architecture
2- RAG Architectural descriptions
In this section the main components of the architecture of the proposed method are presented. The architecture of the proposed method consists of two parts: database and operating modules and computational modules is shown in Figure 2. It is a software-based architecture.
Grid Configuration File Data Base (GCF– DB): Grid configuration file, the entries required
on sites in the grid with traits are kept in the database.
Site Status History Data Base (SSH–DB): At
each refer to site at a given time, active or inactive status was evaluated, and stored in SSH-DB.
New Grid Configuration File Data base (New GCF–DB): After clustering, clusters are
produced, each cluster has a new Grid site. These sites are delivered to simulator.
Job Configuration File Data Base (JCF–DB ) : nformation about the files and jobs are stored in the job configuration file database.
File Status History Data Base (FSH–DB): The results of the WVA, ARA in this section is
maintained.
New Job Configuration File: JCF and JCFS,
have created a new driver.
subsequent steps.
Availability calculator module: The module calculates the percentage of availability of sites according to the recorded information in the FSH database.
Reliability calculator module: Module to calculate the reliability of the sites, according to the information recorded in the FSH database.
Clustering module: The task of this section, Clustering sites based on both the availability and reliability of the site. By Kmeans clustering algorithm is performed.
RAG Decision Making Module: Select a file
to replication is make decisions in this module, and according to the availability and reliability of
the site’s values and files a decision is made.
Grid Site Supplement Module: Grid Site
supplement, add two fields to GridSite structure
of optorsim simulator and initialized them.
JCF Supplement Module: Supplements JCF, a
field as the index files adds to the JCF in filetable
to be used in the next stage.
Data File Supplement Module: This section
that namly data file supplement, adds two fields, availability and reliability to data file structure in the optorsim simulator. The fields in decision making to replicate or delete the files is used.
Work Value Assignment Module: Assign a numerical value to each file as the value of the
work, in this study, four level of work value is intended (integer between one and four).
Availability and Reliability Assignment
Module: Due to the work value of the WVA, both the availability and reliability for each file will be
considered.
RAG File Remover: Decided to exclude files based on the availability of files, to free space as
needed to be done.
Reports: Reports and statistics needed at this stage is visible.
3- RAG Algorithms
Ensuring the reliability of systems and engineering design, is one of the main concerns of designers and developers of these systems, because the reliability of a system means continuity of service. Therefore, evaluation of system reliability and fault tolerance are important to them. A method for quantitative analysis of failure is using fault injection, which forms deliberately injected into the system, and then the output of the injection in system can be traced [[11]. Injection forms can be used to assess Dependability. Reliability and availability are subsets of Dependability. The algorithms of the proposed method are explained in separate site
and file.
Site Availability and Reliability Calculation To calculate the following steps must be
performed. Firstly, at specified times, be must
inactive randomly number of sites, or in simpler forms must be injected fault into system. At this stage, there are two important questions.
- What percentage of sites should be
considered failure or inactive.
- Which sites should be considered failure
or inactive.
Destruction sites should be subject to a failure rate. That is when and how the site should be inactive, so that the calculations can performed by collecting records of each site. If assume that the maximum sf percent of sites are inaccessible, we can calculate the number of them. For example, if sf = 30 is assumed. Table 1 shows the total number of sites is four, then 30 percent is the 1.2 sites, or one site at any one time should be out of access. Secondly, the size of the value obtained in
the first stage, a random number between one and
the number of sites to be produced. For example,
if the number of first stage was number two, two
random number between one and four (of the site) is produced, which is the number of sites, so the status of selected sites at any given time are inactive. Finally, the current status of the site, with values of zero and one in an array (of the
site) are recorded. In the third stage, in specific
site, a random number between one and the number of sites is obtained, and that number will be recorded as an index of the site. Therefore, the indexed sites should not be repeated. After generating a random number, site with obtained ID is inactive. Finally, after determining the sites ststus, the availability and reliability of the site is to be calculated.
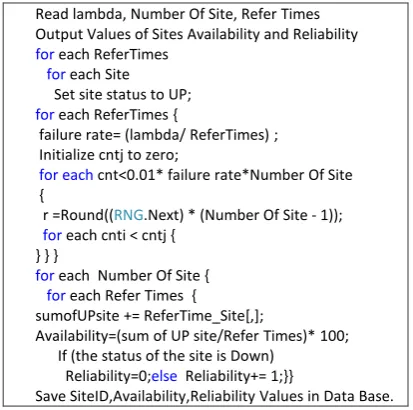
Read lambda, Number Of Site, Refer Times Output Values of Sites Availability and Reliability for each ReferTimes
for each Site Set site status to UP; for each ReferTimes {
failure rate= (lambda/ ReferTimes) ; Initialize cntj to zero;
for each cnt<0.01* failure rate*Number Of Site {
r =Round((RNG.Next) * (Number Of Site - 1)); for each cnti < cntj {
} } }
for each Number Of Site { for each Refer Times {
sumofUPsite += ReferTime_Site[,];
Availability=(sum of UP site/Refer Times)* 100; If (the status of the site is Down)
Reliability=0;else Reliability+= 1;}}
Save SiteID,Availability,Reliability Values in Data Base. Figure 3: Site availability and Reliability Calculation
Algorithm
For the calculation of availability and
reliability, first the number of active sites on the
SSH database extract, and calculated percentage of them, and dividing by the sum of the number of active and inactive sites, site availability is calculated. To calculate the reliability of sites, the number of active sites that are consistently in recent times, extraction, counting and calculation is performed. Finally, three values such as site number, availability and reliability of the site is stored in the database.
File Availability and Reliability Calculation In this section, calculation and allocation of work value, means availability and reliability of
the files described.
Input Minimum and Maximum Availability of each Work Value , Number of files
Output Availability and Reliability of Files
for each Number Of File {
WorkValue= z.nextInt(4);
File Reliability =((WorkValue+1)*random()) + (10.0f- WorkValue - 1);
File Availability = z.nextFloat() * (wvAv2[WV] - wvAv1[WV] + 1.0f) + wvAv1[WV];
Save WorkValue + 1 , File Availability, File Reliability of files in Data Base }
Figure 4 : File Availability and Reliability Calculation Algorithms
Figure 4 shows the algorithm for each file it
generates a random number as a work value, then
the random float number between the minimum
and maximum availability and reliability (Table 2) according to the value of the work produced. These values are the availability and reliability
of files. Finally, these three values are stored in
the database to be used in the optorsim simulator.
Make decision to select file for replication In this section, the replication detection algorithm is checked. The algorithm in Figure
5, the principle that if a condition is satisfied, it is possible to add files to the list of replica. The algorithm first checks whether the file exists
or not to replicate. If there were, the algorithm checks if the destination site availability was greater than the source site. Or, reliability of destination site greater than the source site. Or, availability, source site is smaller than the source
file availability. Or reliability of the source site was smaller than the reliability of the source file.
File replication process continues.
if (file to replicate not null) then{
if ((Destination Site Availability > source Site Availability) or (Destination Site Reliability > source Site Reliability) or
(source Site Availability < source file availability) or (source Site Reliability < source file reliability)) then { Add file to Replica Catalog;}}
Figure 5 : Make decision to select file for replication
File Deletion
In this section, we describe the algorithm for
file deletion. In Figure 6, the background color
indicates the changes in the LFU algorithm.
File deletion by changing the LFU algorithm, the proposed algorithm achieved. in LFU
algorithm, number of refer to file, and in proposed algorithm availability of file is important. in LFU algorithm, the file is deleted when the number of
requests is the lowest. In the proposed method,
the file is deleted with the lowest availability.
If there is a similar condition, accidentally
deleted files. In the proposed algorithm, the file is deleted when its availability is minimal.
for each item in recentHistory { RaiFiles = ((DataFile) i.next());
float historyFileAvf = RaiFiles.availability(); String historyFile = RaiFiles.lfn().toString();
int historyFileAv = Math.round(historyFileAvf);
if (if fileCount not in historyFile ) then
fileCount.put(historyFile, historyFileAv); }
for each Files elements {
DataFile file = (DataFile) e.nextElement();
if (file is Deleteable && file name not in fileCount )
{nonAHFiles.add(file); }} while (nonAHFiles isn’t Empty) {
DataFile file = (DataFile) nonAHFiles.get(Math.random*nonAHFiles.size());
filesToDelete.add(file); nonAHFiles.remove(file);
deleteable File Size = deleteable File Size+ file size;
if (NewFileSize<= deleteable File Size) {
return files To Delete; }}
do { int minCount = 100;
for each item in fileCount {
DataFile file = requestFile((String) i.next());
if (file not null and file is removable) then{
accesses = fileCount.get(logical file name .intValue();
if (file availability < minCount) then{
chosenFile = file; minCount = accesses; }}} filesToDelete.add(chosenFile); deleteableFileSize += chosenFile.size();
if (fileCount.remove(chosenFile.lfn()) is null) then {
System.out.println("couldn't delete enough files to
replicate "); returnnull; }
}while (removable File Size < new File size); return filesToDelete;}
Figure 6 : File deletion Algorithm
Changes in optorsim simulator
To implement the proposed approach, we need for changes in the optorsim simulator code. Since optorsim simulator is open source, we can apply the necessary changes. To achieve this, two new classes in the directory \optor caused. These classes are RAGOptimiser and RAGStorageElement, that in order to implement the algorithm for optimized data replication, and implementation of how to add and remove in storage element are used. The classes includes two important functions getBestFile () of class
RAGOptimiser, and the filesToDelete () of class
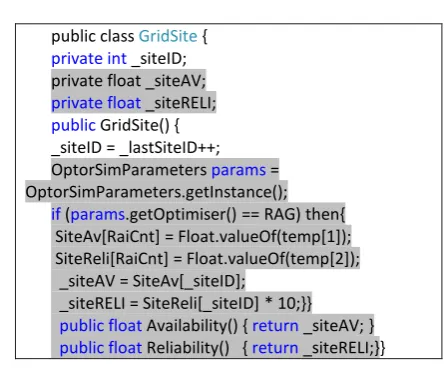
RAGStorageElement. These two functions were implemented based on the requirements and assumptions of the proposed method. To consider the availability and reliability of sites, these parameters added to GridSite classes of optorsim simulator. Additions items are marked gray area in Figure 7.
public class GridSite {
privateint _siteID; private float _siteAV;
privatefloat _siteRELI;
public GridSite() { _siteID = _lastSiteID++; OptorSimParameters params = OptorSimParameters.getInstance();
if (params.getOptimiser() == RAG) then{ SiteAv[RaiCnt] = Float.valueOf(temp[1]); SiteReli[RaiCnt] = Float.valueOf(temp[2]); _siteAV = SiteAv[_siteID];
_siteRELI = SiteReli[_siteID] * 10;}} publicfloat Availability() { return _siteAV; } publicfloat Reliability() { return _siteRELI;}}
Figure 7: features added to the site Grid
Initialize done by the results of previos method
are entrance. When a grid site is created, its variables are initialized. Select a file to replicate it
in the replicateFile function of ReplicaManager.
java file done, and if the terms of availability and reliability of the site and file will correct, the file
is added to the replica list. If the availability or reliability of the destination site, most of source, or, availability or reliability of the source site
less than the source file then Operations are
performed.
if ((toSE.getGridSite().Availability() > source.se().getGridSite().Availability()) || (toSE.getGridSite().Reliability() > source.se().getGridSite().Reliability()) || (source.se().getGridSite().Availability() < source.availability()) ||
(source.se().getGridSite().Reliability() < source.reliability()))
Delete files mechanism based on availability of files in the filesToDelete function of RAGStorageElement.java file done. So that each file has the lowest availability in the current record,
has been selected for removal. The change in parts of the LFU removal mechanism, this mechanism has become RAG removal mechanism. Instead of
the number of requested file, the availability of the file, is used. To consider the availability and reliability to files, first in DataFile.java file two float variable, as shown in Figure 8 is added to
the DataFile structure, then apply the necessary changes in other parts of the code. Gray areas are
public DataFile(String lfn,int size,int fileIndex, float availability, float reliability, boolean pin, boolean master) {
_lfn = new String(lfn); _master = master; _size = size; _fileIndex = fileIndex; _availability=availability; _reliability=reliability; _timestamp = _time.getDate(); _se = null;
_pin = pin ? 1 : 0;}
public float availability() {return _availability; } public float reliability() {return _reliability; }
Figure 8: Changes in the structure of data file
Then at file JobConfFileReader.java, the
code required to initialize variables, availability
and reliability of the file are added as shown in
Figure 9.
Read "..\\FileAvReli.txt"; temp = strLine.split(",");
FileAv[RaiCnt] = Float.valueOf(temp[1]); FileReli[RaiCnt] = Float.valueOf(temp[2]); Figure 9: read the file containing values of files reliability
and availability
Int Cms_testbed_jobs.conf file in FileTable
section, an additional column (fourth column), which is equivalent to the number of rows or
index file, as shown in Figure 10 will be added.
Figure 10 : Job Configuration File
The obtained values are added to DataFile
according to Figure 11. Variable fileindex the
fourth column is added.
int fileindex = (int) st.nval;
float availability = (float) FileAv[fileindex]; float reliability = (float) FileReli[fileindex];
_fileCollection.put(name,new DataFile(name, size, index,availability,reliability,false, true));
Figure 11 : initialize of data file variables
IV. Simulation Results
As mentioned before, the architecture and topology used in simulation is CMS Data Challenge 2002 [17]. This architecture is shown in Figure 12. Grid simulation consists of 20 sites, 18 sites with a storage element and a computing element, and 2 sites have just storage elements. These two sites are CERN (site 14) and FNAL (Site No. 19).
Moscow Russia
155 M USA2
USA1
USA3 France UK
Switzerland Italy 155 M
2.5 G 10 G
10 G 2.5 G
2.5 G 10 G
10 G 155 M
Padova/legamo Bari Perugia Catania Roma
Frinze Bologna Pisa
Torino
155 M 45M 100 M 100 M 45 M 100 M 155 M 100 M 45 M Lyon CERN
1G 2.5 G
1 G UFL
622 M Caltech
UCSD 622 M
622 M Wisconsin FNAL 622 M
2.5 G RAL IC Bristol
622 M 155 M 622 M
CMS testbed site Router
Figure 12 : The CMS Data Challenge (2002)[17]
Storage capacity of Site no 14 and Site 19 is 100 GB, and at the beginning of the simulation,
all the files are on them, and as needed during the simulation grid sites, files are replicated to other
sites. The storage capacity of 18 other sites are 50 GB, and have a computational element with one worker node. system also has eight routers, that are used only for routing and binding sites, and have not a storage and computing elements. The general parameters of the simulation are shown in Table 4.
These parameters include the number of sites, the number of sites with a computational element, the number of sites with storage element, the number of routers, storage capacity, number of jobs, the number of kinds of work, work delays,
file access patterns, file size, minimum and
data are read-only.
Table 4 : simulation parameters value parameter
20 Site
18 CE
20 SE
8 Router
2*100+18*50 Storage(GB)
100 Job
6 Job Type
Sequential,random, unique random walk, Gaussian random walk and
random Zipf Access Pattern
1 File Size (GB)
97 Total File Size
(GB)
106 ms
Access History Len
45 MB/S Minimum
bandwidth between 2 site
10000 MB/S Maximum
bandwidth between 2 site
10 repeat
As noted, the proposed method with five
algorithms Simple, LRU, LFU, EcoModel Binomial Distribution, EcoModel Zipf-like Distribution been compared.
Performance evaluation criterias
The proposed method, two parameters, reliability and availability features to be added to the existing collection. As it is, as research suggests, this method does not claim to compete with other existing algorithms, but rather a complementary approach. The proposed method, the fault tolerance of the previous methods. Therefore, the results do not have any competition, and only shows the output of the system after implementation of this method. Therefore, performance evaluation criterias used in the simulation to compare algorithms are:
Mean Job Execution Time, Effective Network
Usage (ENU), Total Number of Replications,
Percentage of storage filled, Total Number of
Local File Accesses, Total Number of Remote File Accesses.
In this simulation, six types of work, to run a hundred times, for accurate simulation algorithms for each of the ten steps is repeated until obtained values are satisfactory. In the end, for each of criteria, the results of the algorithm are considered.
Mean Job Execution Time
Mean Job Execution Time calculated from divided the total execution time of all jobs (in milliseconds) by a number of jobs. This value is much lower, the algorithm is better, because it executes jobs in less time. These criteria can be considered the most important performance evaluate criteria to an replication algorithm. The results of proposed method will be compared
with five algorithms, according to mean job
execution time. The results comparison of mean job execution time of the six algorithm for the
different access patterns, as shown in Figure13,14.
Figure 13 : Mean job execution time vs optimization algorithm
In random access patterns, including random, unique random walk, Gaussian random walk and random Zipf distribution. Sites most requested
a specific set of files. Therefore, these files due
to high demand, for Grid sites are replicated and
thus a large percentage of requested files exposed
locally on sites. For this reason, in these access
patterns, some files requested several times and some may not request. So, jobs can get their files
locally. As a result, random access patterns have further improving in jobs execution time.
Figure 14 : Access Pattern vs Mean Job Execution Time
earned. Because the proposed method is not the
best, refused replicated requests to file. Where
the situation is repeated with the addition of 2 parameters are not established. In Figures 13 and
14, the effect of each of the access patterns are
evident on each algorithm.
Effective Network Usage (ENU)
This criteria is the ratio of files transferred to files requested, so a low value indicates that
the optimization strategy used is better at putting
files in the right places. It ranges from 0 to 1. It
can be measured by using Eq(3).
𝐸𝐸𝐸𝐸𝐸𝐸𝐸𝐸𝐸𝐸𝐸𝐸=NNremote file accesses + Nfile replication
remote file accesses + Nlocal file accesses (3)
Figure 15 : Access Pattern vs Effective Network Usage
As shown in Figure 15, the RAG algorithm further access patterns, ENU lowest compared with other algorithms, as this method does not
access remote files, therefore, the jobs in required time, access the files will be locally. Therefore,
the number of local access increases, and the number of replicas are reduced, resulting in a ratio of ENU and the amount of bandwidth used, decreases.
Total Number of Replications
The next evaluation criteria, total number of replication have been done. The number of replication is less, ie, better optimization algorithms, and better acted, and replica replica correctly, and put it in properly place, therefore,
need to replication the files is reduced. Reduce
the number of replication can reduce the network load, and reduce the occupied bandwidth. On the other hand, if the number of replication is large,
it means that most of the files were not on the site
locally.
Figure 16 : Access Pattern vs Total Number of Replications
According to the diagram in Figure 16, the total number of replication of the proposed method, the random access pattern Zipf best results, and access to walking Gaussian model, and a unique, almost the worst result, or have the most replicate. In other models, the results are average. Some reasons of replication increasing in the frequency of access patterns are: Rejected
replication requests files, because not available necessary conditions to replication or delete files,
with low availability, by remove algorithm, from storage resources noted.
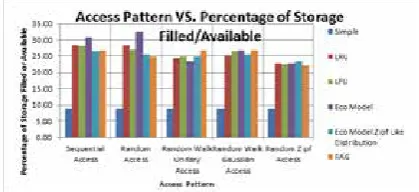
Percentage of storage filled
Evaluation criteria in this section, is the occupation of the storage element. If the occupancy rate is less storage capacity, algorithms is better, and systems fewer faces a shortage of storage space. Since the no-replication
algorithm are access required file remotely and never replicate a file. This algorithm has lowest
occupancy of storage capacity to be allocated. According to Figure 17, the proposed method to access walking Gaussian model, and unique have highest occupied storage capacity due to the increased number of replication. In other access patterns have almost the best results.
Figure 17 : Access Pattern vs Percentage of Storage
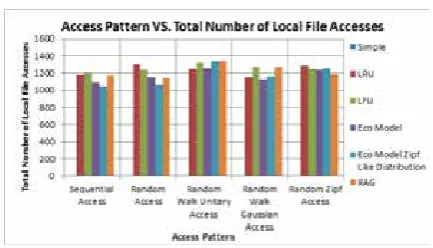
Total Number of Local File Accesses
efficient use of the network is low, that is, the used
optimization algorithm due to replica replications in the right place, better and Suitable, has acted. Figure 18 shows the total number of local access
file.
Figure 18 : Access Pattern vs Total Number of Local File Accesses
In random access patterns including random, unique random walk, Gaussian random walk, and
the random Zipf, Sites, a specific set of files, most
requests. For example, a Gaussian random access
patterns, some files are requested more than once. While, others do not request, so do in most cases, their requirment files to be provided locally, as previously requested these files, and replication
operation, for they have taken.
Total Number of Remote File Accesses Increase remote access, increased use of the
network and efficient use of network is high, that
is, the used optimization algorithm, not replicate the replications in the right and suitable place or replication failed to provide suitble space. Figure 19 shows the total number of remote access to
files.
Figure 19 : Access Pattern vs Total Number of Remote Accesses
As mentioned previously, because, remote
file access, could be due to improper placement
of replications or do not provide suitble space to be replication. It should be noted that the used
remove algorithm is also effective. If removal is not possible, was forced to remotely access files.
The proposed method file deletion algorithm, delete the file with the lowest availability. Therefore, there is always files with a minimum
availability to delete. Therefore, the probability of a lack of storage space in this method is zero
and so this method does not remote access files,
and its value is zero.
V. Conclusion
In this section, the conclusions of this study will be discussed. Purpose of data replication, create replicas of the same data, and placing
them in different sites, also, data replication is a well-defined technique for improving data access
in distributed computing and or fault tolerant systems are used.
Each replication strategies with respect to the architecture used in their decision-making data replication, using a subset of parameters such as reducing access latency, reduce bandwidth consumption, workload, the lowest maintenance costs, replacement replica, job execution time, increased fault tolerance forms, and quality assurance. It should be noted that the dynamic behavior of the Grid users make the decision on data replication to achieve maximum availability
difficult. Many suggestions on improving the
response time of the system, or data consistency, have been proposed, but little attention has been on the reliability of the system.
Therefore, in this study, the dynamic calculation of reliability and availability and virtual clustering them based on calculated values were examined, note that the actual grid access was not possible, therefore, to provide simulation program separately from the simulator optorsim, the calculations were carried out, which is essentially complementary optorsim simulator.
The information, data received from users who want to send them, with appropriate reliability and availability of, be shared with
others. Clustering, an effective technique is to
ensure high availability. Therefore this technique, the clustering of sites based on the reliability and availability parameters are used. The results show that, with the addition of the parameters of reliability and availability, the issue of data replication is not only not a problem, but also increase the fault tolerance, in some access patterns have also been improved.
Limitations of method
Collecting the data needed to calculate the reliability and availability of a focal point, the limitations of this method is that if it is defective, it will cause disruption.
Future Work
Implement the computation of reliability
and availability of the site and file as a module
within the simulator optorsim done. And Create redundancy for the focal point for its tolerant forms.
Acknowledgement
Thanks to the efforts of Mr. DR. Amir Hossein
Forouzan Member of the Faculty of Biomedical Engineering, Shahed University, Tehran.
References
[1] Y. Yuan, Y. Wu, G. Yang, F. Yu, Dynamic data
replicat anatomy of the grid: Enabling scalable virtual
organizations”, International Journal of Supercomputer
Applications, pp. 200-222, 2001.
[2] European Organization for Nuclear Research (CERN), http://public.web.cern.ch/public/
[3] http://ceit.aut.ac.ir/~shiry/lecture/machine-learning/tutorial/clustering/K_Means.htm
[4] Y. Yuan, Y. Wu, G. Yang, F. Yu, Dynamic data
replication based on local optimization principle in data grid, 2007.
[5] Chervenak A., Foster I., Kesselman C., Salisbury C.
and Tuecke S., “The Data Grid: Towards an Architecture
for the Distributed Management and Analysis of Large
Scientific Datasets”, Journal of Network and Computer
Applications, pp. 187-200, 2001.
[6] Sushant G., Buyya R., “Data replication strategies
in wide-area distributed systems”, Chapter IX of Enterprise
Service Computing: From Concept to Deployment, IGI Global, pp. 211-241, 2006.
[7] Venugopal S., Buyya R., Ramamohanarao K.,
“A taxonomy of Data Grids for distributed data sharing, management, and processing”, ACM Computing Surveys
(CSUR), Volume 38 Issue 1, pp.1-46, 2006 .
[8] CMS Data Challenge, http://www.uscms.org/s&c/ dc04
[9] Foster I., Ranganathan K., “Design and evaluation
of dynamic replication strategies for a high performance
data grid”, In Proceedings of International Conference on
Computing in High Energy and Nuclear Physics, Beijing, China, September 2001.
[10] Tehmina Amjad, Ali Daud and Sher Muhammad. A Survey of Dynamic Replication Strategies for Improving Data Availability in Data Grids. Future Generations Systems. (doi:10.1016/j.future.2011.06.009). SCI (Impact Factor 2.37)
[11] Haissam Ziade, Rafic A. Ayoubi, and Raoul
Velazco. A Survey on Fault Injection Techniques. Int. Arab J. Inf. Technol. 1(2):171-186 (2004)
[12] K. Sashi, A.S. Thanamani, A new dynamic replication algorithm for European data grid, in: Proceedings of the Third Annual ACM Bangalore Conference,2010.
[13] Khanli L.M., Isazadeh A., Shishavanc T.N.,
“PHFS: A dynamic Replication method, to decrease access latency in multi tier data grid”, Future GenerationComputer
Systems 27, pp. 233-244, 2011.
[14] Nazanin Saadat, Amir Masoud Rahmani: PDDRA: A new pre-fetching based dynamic data replication algorithm in data grids. Future Generation Comp. Syst. 28(4): (2012)
[15] Jaradat, A., Patel, A., Zakaria, M., Amina, A. M.: Accessibility Algorithm Based on Site Availability to Enhance Replica Selection in a Data Grid Environment. Computer Science and Information Systems, Vol. 10, No. 1, 105-132. (2013)
[16] Brent Rood Michael J. Lewis. Availability Prediction Based Replication Strategies for Grid Environments. CGRID ‘10 Proceedings of the 2010 10th IEEE/ACM International Conference on Cluster, Cloud and Grid Computing. Pages 25-33
[17] Najme Mansouri. An Effective Weighted Data
Replication Strategy for Data Grid. Australian Journal of Basic and Applied Sciences, 2012, 6(10): Pages 336-346
[18] Bakhta Meroufel,Ghalem Belalem. Dynamic Replication Based on Availability and Popularity in the Presence of Failures. Journal of Information Processing Systems, June 2012, Vol.8, No.2, page 263-278
![Figure 12 : The CMS Data Challenge (2002)[17]](https://thumb-us.123doks.com/thumbv2/123dok_us/35246.2004022/10.595.318.513.329.473/figure-the-cms-data-challenge.webp)