Semnan University
Journal of Heat and Mass Transfer Research
Journal homepage: http://jhmtr.journals.semnan.ac.ir3D Simulation of the Effects of the Plasma Actuator on the
Unsteady, Turbulent and Developing Flow within a Circular
Duct
M. Sefid
*, H.R. Yazdani
Department of Mechanical Engineering, Yazd University, Yazd, 98195/741, Iran.
P A P E R I N F O A B S T R A C T
Paper history:
Received: 2018-07-10 Received: 2019-02-05 Accepted: 2019-02-05
The objective of current paper is 3D simulation of turbulent, developing flow and unsteady within a circular duct in presence of the body force vector persuaded by Dielectric barrier discharge (DBD) plasma actuator inside the surface of geometry for the first time. This article aims at investigating of applying plasma actuator to control separation with special arrangement of electrodes. For this reason, the plasma actuator is modeled in OpenFOAM software and the results are validated.Subesequently, to examine the effect of the presence of the plasma actuator a numerical study is carried out on a 3D flow. The physics of the problem is determined by three phenomena of increasing the flow cross-sectional, developing flow and simultaneous flow in both radial and tangential directions, especially the pressure gradients. As a result of the geometry of the problem, the actuators are arranged differently and the electrodes are arranged in radial direction. The results indicate that plasma actuator delay the separation point.
DOI: 10.22075/jhmtr.2019.15089.1211
Keywords:
Plasma Actuator; Active Flow Control; Flow Separation; Unsteady Flow; Developing Flow.
© 2019 Published by Semnan University Press. All rights reserved.
1.
Introduction
Controlling of flow defines as the manipulation of a flow for obtaining a favorable change. Nowadays, this matter is followed by the researchers so as to achieve techniques with higher performance and less expense for this purpose.
Plasma Actuator is lucrative instruments in active flow control. These kind of actuator, to to their valuable advantages in control of flow, have attracted the attention of many researchers. The significant aspects of it are: not having a moving section, rapid responsiveness, structure simplicity, low power consumption.
Malik et al. [1] applied the jet force deduced from a plasma actuator for reducing of drag on the flat plates for the first time. Following them, many researchers induce the body force with using electrical discharge to control separation of the boundary layer.Moreover, Grundmann et al. [2] performed experimental and numerical study on the result of this technique on the boundary layer of the flat
*Corresponding Author: M. Sefid, Department of Mechanical Engineering, Yazd University, Yazd, 98195/741, Iran
Email: [email protected]
plate. They exhibited that plasma actuator leads to delay the transition and as a result the reduction of boundary layer. Orlov et al. [3] investigated the impacts of plasma actuator on separation control of the airfoil.
Furthermore, Sosa et al. [4] examined the reduction in drag of a cylinder with applying plasma, experimentally and numerically. Their results displayed a 25% drop in drag.
Nowaday, the usage of the plasma in the turbomachines has been focus of attention. In this way, Corke et al. [5-6] considered the influence of plasma on the performance of turbines. Also, Huang [7] has applied the plasma actuator to control separation on blades of turbine. Xu [8], in 2011, applied this instrument in pipe for separation control of boundary layer.
and Jahangirian [10] used multiple DBD plasma actuators for separation control numerically. Results revealed that applying actuators in multiple arrangements can increase the induced body force.
Shen et al. [11] inquired asymmetric and active flow control by a plasma actuator experimentally on a 75 degree swept delta wing at a Re≈ 50,000. The drag coefficient was reduced significantly and the results demonstrated that the plasma actuators can be applied for rolling maneuvers of these wings.
Ashcraft et al. [12] investigated the effectiveness of (ns-DBD) plasma actuators for control of boundary layer separation experimentally. The results manifested that the size of wake is smaller than the initial case.
More recently, Meng et al. [13] for controlling of flow applied a plasma actuator that was combined with the duty-cycled technique over an elliptic airfoil. Their results indicated that this type of plasma can produce periodic sustained.
Ebrahimi and hajipour [14] investigated control of flow separation on an airfoil with applyingDBD plasma actuators thas are called dual excitation numerically. A NACA 4415 airfoil with 0.4m chord at Rec=5.5 ×10⁵ and angle if attack=18◦ was contemplated as the reference case. They subsumed that actuations improve the pathes of wake. The modelling of the plasma actuator's effect is still controversial. In general, the models can be distinguished in two groups: scientific models and phenomenological models [15].
The easiest model belongs to Shyy et al. [16]. In fact, for simulationg of body force vector created by the plasma they apply a linear average time distribution, which its value is determined by the following parameters such as actuator input voltage, frequency, dimensions of electrodes and some specifications of air.
After that, Orlov et al. [17] presented another approach for modelling the plasma actuator. In their approach, the time dependence of body force was simulated with higher accuracy.
Suzen et al. [18], presented a more complicated model, which are defined as a function of geometry, the specifications of dielectric material and actuator input voltage and the body force induced is realistically modelled.
2.
Equations
In general, the plasma actuators are included of two electrodes and a dielectric material that separates them. When a voltage which is alternative is applied to the electrodes, the air, above the electrode connected to the ground, is ionized. The air that is ionized, because of electric field, is influenced by a body force that can produce unsteady or steady components of velocity. This induced force is represented in terms of the charge density and voltage and also incorporated into equations that are called the Navier-Stokes. In the present study, the model of Suzen for modelling has been applied. If magnetic force
is neglected therefore the electrohydrodynamic force can be derived:
𝑓𝐵
⃗⃗⃗ = 𝜌𝑐 𝐸⃗ (1)
In Eq. (1), 𝑓⃗⃗⃗ 𝐵 is the induced body force, 𝜌𝑐 𝑎𝑛𝑑 𝐸⃗ are the net charge density and the electric field, respectively. Due to time variation ignorable, the Maxwell equation can be simplified as ∇ × 𝐸⃗ = 0 [18]. As a result, according to Eq.(2):
𝐸⃗ = −∇Φ (2)
With using of law of Gauss:
∇. (𝜀∇Φ) = −𝜌𝑐 𝑜𝑟 ∇. (𝜀𝐸⃗ ) = 𝜌𝑐 (3) Ɛ, In Eq. (3), is electrical permittivity constant that is calculated from Eq. (4):
𝜀 = 𝜀0𝜀𝑟 (4)
In which, the relative permittivity of the medium is specified by ɛr, and is the free space permittivity is specified by ɛ0 that its value is 8.854×10⁻¹² C2/N.m2.
However, the way plasma actuator affects on its surrounding flow.
Recently, measurements in laboratory proved that these problems will not happen [19-20] and the role of plasma region in momentum equation would be as a source term:
𝜕𝑈⃗⃗
𝜕𝑡+ ∇. (𝑈⃗⃗ 𝑈⃗⃗ ) − ∇. (𝜐∇𝑈⃗⃗ ) = − 1
𝜌(∇𝑃 − 𝑓⃗⃗⃗ )𝐵 (5)
it is obvious in Eq. (5) that both pressure gradient and the electrodynamics force behave as source terms in Eq. (5).
3.
The Computational Geometry
Figure 1 depicts the computational geometry. The flow enters the duct which has a radius of r3 and then exhausts the area which has a radius of r4 monotonously and quite radially.
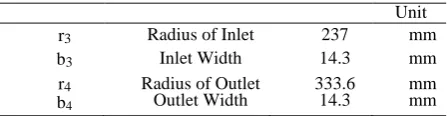
The dimensions of the computational geometry are shown in the table 1.
Figure 1.The Geometry
Table 1. Specifications of the geometry
Unit
r3 Radius of Inlet 237 mm
b3 Inlet Width 14.3 mm
r4
b4
Radius of Outlet
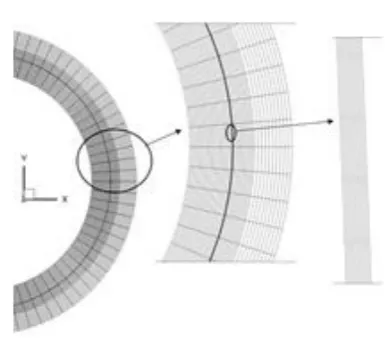
Figure 2.The studied geometry
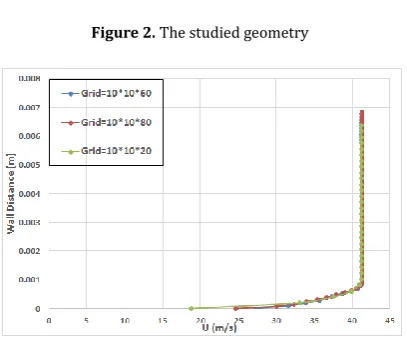
Figure 3.Grid- independence
The flow on the Z axis has symmetry, figure 2, therefore the half of field is solved on this axis.
Also, with applying a coefficient of expansion that is equal to 0.25 on the Z axis, computational grid in the near-wall is fine enough therefore reducing the cost of the calculations along with more accurate answers can be obtained. The space between the center of the first near-wall in cell and the near-wall is calculated as follow [21]:
∆𝑆 ≈ 5.06𝑦+ 𝐷
ℎ𝑅𝑒ℎ−7.8× 𝑒 (6)
𝑦+=𝑦𝑢𝜏
𝜐 (7)
In which, y+ is the number which with using friction velocity has been made dimensionless:
𝑢𝜏= √𝜏𝑤⁄𝜌 (8)
The coefficient of expansion, e, in Eq. (6) is equal to 0.25. In this equation, y+ can take its average values. Generally, for current study, y+ in range of 30-300 is suggested by researchers [21]. Figure 2 displays the geometry generated by blockMesh function. The value of Y+ around 100 has been selected. Furthermore, the study of grid-independence has been performed (Figure3).
The checkMesh function is applied because for solutions with maximum precision, the grid that was generated should have the criteria of a grid proper.
4.
Fluid Conditions
The fluid in this study is the natural gas and its specifications are given in table 2. The value of density is related to inlet also except the viscosity, other values, has
been calculated in specific pressure and temperature that are 1 atmosphere and 293K, respectively.
It is noteworthy to mention that the angle of the inlet velocity vector and itsmagnitude are selected in such an angle that we have separation [22]. Since the value of Reynolds number is more than 2300 (the standard for flows to become turbulent in the channels), the flow is turbulent.
To compute the development of the flow, the hydrodynamic inlet length should be calculated. For Turbulent flow, this quantity is calculated based on the following equation [21]:
𝐿ℎ𝑑= 1.359 𝐷ℎ 𝑅𝑒ℎ0.25= 1.84 𝑚 (9)
Therefore, based on the Eq. (9), since the value obtained is much higher than the flow length, r4-r3= 0.0966 m, the studied flow is developing.
5.
The Bounday Conditions
Among the RANS or Reynolds-averaged Navier-stokes approaches, in this study, k-ωSST (the Shear Stress Transport) has been selected. In light of this, flow inlet is the most important boundary. The first parameter is the turbulence intensity (I) that is formulated in Eq. (10) [23]:
𝐼 =0.16 𝑅𝑒ℎ−1/8 (10)
If turbulence intensity is 1% or lower therefore, it is low, and if it is above 10% it is high. By assumption of isotropic turbulence, the turbulent kinetic energy is [23]:
𝑘 = 1.5 (𝐼𝑈)2
(11)
The specific dissipation rate is another quantity, which can be calculated as follows [23]:
𝜔 = √𝑘
𝑐𝜇1/4𝐿𝑡 (12)
In which value of Cμ is 0.09 and Lt that is turbulent mixing length that in category of developing flows can be calculated as follows [23]:
𝐿𝑡= 0.4 𝛿99 (13)
For estimating of δ99 we use the following experimental equation on the flat plate:
𝛿99= 0.38𝑥𝑅𝑒𝑥−1/5 (14)
Table 2. Properties of Fluid
Unit
Density 57.504815 kg/m3
Dynamic viscosity 1.573733E-5 µ
Gas Constant 0.5 R
Temperature 337.0518 K
Molecular Weight 19.00 M
Specific Heat Specific heat ratio
2.34 1.27
In which the distance from the beginning of the inlet is x. The turbulent mixing length, in a fully developed flow, is equal to 0.07Dh. Also these parameters are applied through the code is decpited in appendix 1.
The variables’s plasma in the initial condition is equal to zero. The followings have been contemplated for the boundary conditions of the pressure and velocity:
For modelling of velocity in inlet both of the swak4Faom and groovyBC were used.
The zeroGradient boundary condition for the modelling of the pressures on inlet has been applied.
Moreover, no-slip condition has been applied for the wall. The effect of wall roughness is calculated as appendix 3.
The followings have been assumed for the velocity boundary conditions:
The flowRateInletVelocity boundary condition has been utilized for inlet. Another option is utilizing cylindricalInletVelocity.
For modelling the velocity on the outlet, the zeroGradient is applied. Also, in order to calculate the pressure, the zeroGradient condition is applied.
5. 1. Selection of Solvers in OpenFOAM Software
Two solvers can be applied for the flow in an incompressible condition. PisoFoam which with algorithm piso is able to solve transient turbulent and laminar incompressible flow. The other one is the pimpleFoam solver which with algorithms piso and simple is able to solve transient with large time steps for turbulent and laminar incompressible fluid flows. In this study, the pisoFoam solver was selected. Due to Courant number must satisfy criteria of C0<1 and the very small time steps should be selected because the solutions do not diverge. Thus, we will have it:
𝛿𝑡=
𝐶0× 𝛿𝑥
|𝑈| =
0.5 × 96 × 0.001
10 × 50 = 𝑂𝑑. (10−5) (14)
The time step of 0.00001s is applied for preventing the divergence of the problem. Two methods rhoPimpleFoam and rhoCentralFoam for the compressible flow can be applied. In general, for flows with M < 0.7 it has been suggested to use the pressure-based approaches and for numbers above this value density-based approaches. Subsequently, the rhoPimpleFoam has been selected for compressible flow. In appendix 4 due to their importance the settings for controlDict solver have been provided. It is noteworthy to mention that applying adjustTimeStep is to prevent divergence.
6.
The Layout of Electrodes
The layout of electrodes on the examined geometry is depctied in figure 4. It should be noted that both electrodes (connected to the ground and to the voltage source) can be applied either as the primary or terminal electrode.
Figure 4.The layout of electrodes on the channel
Figure 5.Grid produced by OpenFOAM Software
Figure 6a.potential and distributions of the net charge density near electrodes for the present model (right side)
and model of Suzen [18] (left side).
Figure 6b. streamlines for the plasma actuator in quiescent flow for the present model (Bottom) and
model of suzen [18] (up)
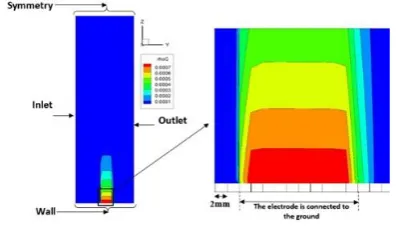
Figure 7.The potential deduced from actuator
Figure 8.The net charge density on a radial yz plate
7.
Code Validation
To validate the performed simulation of plasma actuator, the results were compared with those of Ref. [18] in figure 6.
As it is seen in this figures, the trends of constant density and potential move in a similar path. It should be mentioned that in Suzen's model [18], the boundary condition between the two electrodes is not clear. Besides, this reference has not investigated the grid-independence and it can affect the distribution. As seen in Figure 6, the
simulations manifest a good accordance with the results of Ref. [18]. The maximum velocity is 1m/s that is matched with the value of ref. [18]. The distribution of potential deduced from plasma actuator on a radial yz plate is illustrayed in Fig. 7. Moreover, the region between the two electrodes is magnified.
Obviously, in the region between the electrodes a high gradient of potential has been generated. Also, the selection of symmetry for the boundary condition has caused the lines of constant potential move towards a vertical direction. Moreover, as a result of the selection of value of zero for the potential gradient, the constant potential line to extend with an upright move towards the inlet and outlet. Figure 8 shows the net charge density. The maximum value of net charge density has achieved in the top of area of the electrode.
8.
Results
8.1. Flow simulation results without plasma
actuator
Figure 9 displays the velocity vectors on symmetry plate. As the flow gets to the outlet, the magnitude of velocity will be lower, while velocity vector is increased. As a result, the flow experienced simultaneously increasing its angle and rotating towards the outlet. Subsequently, flow contains radial and tangential movements.
The magnitude of velocity is depictedin figure 10. In the radial direction it is decreasing. Also, when velocity gets the plate of symmetry its value will be higher.
Figure 9.Velocity vectors with an angle of 50.
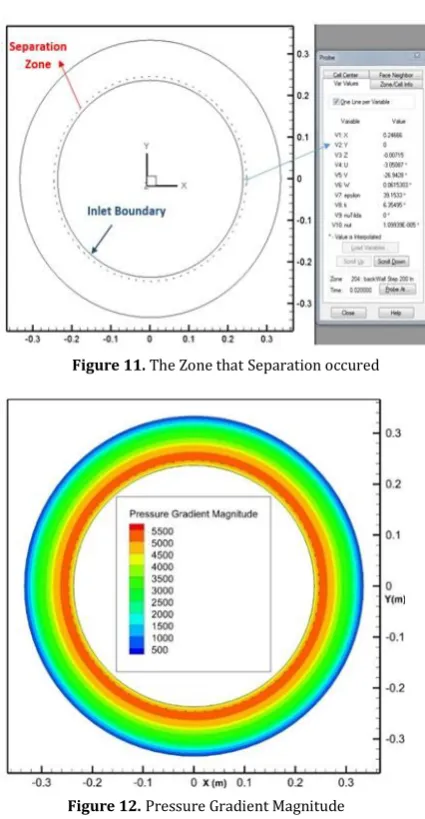
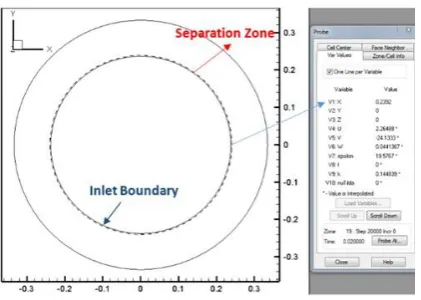
Figure 11. The Zone thatSeparation occured
Figure 12.Pressure Gradient Magnitude
Figure 11 display the regions in which the flow experienced separation. The separation has almost occurred in radius of 246.6mm that is close to inlet. Also, separation occurred at all channel’s surface.
Magnitude of pressure gradient on the channel’s wall is presented in Fig.12. As a result of the changes of pressure gradient in tangential direction are much lower than radial direction, consequently, the modifications in tangential direction can be neglected.Thus, flow movement in radial play an essential role in determination of point of separation. After it occured, the length of the separation area is computed by the flow movement in direction of tangential. Additionally, the developing phenomenon, at beginning of the flow, is superior to the increase in cross-section. It is obvious that reverse pressure gradient is generated on the separation point. This pattern continues up to a radius of 256mm and when this radius is achieved, the cross-sectional increasing of channel is superior. Based on the equation of momentum, in the radial direction, the pressure gradient magnitude, with the increase in radius is rapidly fallen.
The consequences of this research are presented in figure 13. In this figure, the variation of pressure gradient against channel’s radius is displayed. The fall in the rate of
pressure gradient is illustrated in this figure. It is noteworthy to mention that separation at a point has occurred in which the pressure gradient is increasing.
The magnitude of velocity at the separation against the element perpendicular to the wall is illustrayed in Figure.14.
As seen in figure14, at the separation point the gradient of velocity is zero. As mentioned earlier, according to the separation’s radius that was determined in Fig. 11, the arrangement of the electrodes is Computed.In other words, where the potential gradient is maximum. Based on this argument, arrangements of electrodes are decpited in table 3.
Figure 13.Pressure gradient magnitude on wall vs. radius
Figure 14.The magnitude of velocity at the separation point
Table 3. quantitative values of arrangement of electrodes
mm
Wi beginning area without electrode’s Width 1
We1 primary electrode’s Width 6
Xe We2
the area between electrodes’s Width terminal electrode’s Width
Figure 15.The areas on the channel’s wall with separation, after application of the plasma actuator
Figure 16.The contour the pressure gradient magnitude on the wall of channel
Figure 17.The total pressure in the application of actuator and non-application of actuator modes.
8.2. Using of Plasma Actuator to Control of
Separation
Figure 15 presented the region on the wall of channel in which separation has occurred after application of plasma actuator. It stretched out in tangential direction as well.
In the solution that leads to this conclusion, the electrode connected to the ground, has been assumed to be the primary electrode. Also, as a result of the application of plasma actuator, the separation’s radius is transffered from 246.6mm to 239.2mm. In fact, the length of separation area has increased in the direction of tangential.
The explanation of this phenomenon is that, in this radius gradient of pressure is lower.
Figure 16 presents the contour the magnitude of pressure gradient after application of plasma actuator.
In figure 16, terminal electrode is connected to the ground and primary electrode is connected to the voltage source. The different circular regions include the zone no electrode, the primary electrode, the gap between two electrodes, terminal electrode, and the ending zone no electrode, respectively. There is a highly non-uniform distribution of gradient of pressure. Its reason is different zones on the electrodes with different characteristics.
When comparison the figures 12 and 16, it is proved that the maximum of gradient of pressure in the applying mode of the plasma is much more than time that plasma actuator is not applied.
The total pressure (sum of static and dynamic pressure) in the two status of without and with the plasma actuator against channel’s radius is displayed in Fig. 17.
9.
Conclusion
In the current paper, the plasma actuator was modeled In accordance with reference model with radial arrangement of electrodes in OpenFOAM Software. The simulations reveal a good accordance with the results of Suzen model. Then plasma Inserted into geometry for the first time. This study proved that plasma actuator transfers of separation point.
For this purpose, a novel code was contemplated. The code developed for generation of the mesh and the geometry. The followings are obtained from the results:
1. In the studied flow, the three phenomena such as increasing the flow cross-sectional, developing flow, and simultaneous movement of flow in the tangential and radial directions determined the physics of the problem especially the pressure gradient.
2. Variations in pressure gradient magnitude in the tangential direction are lower than radial direction. As a result, the separation point is designated by the move of the flow in radial direction and after its occurrence; the flow movement in the tangential direction determines the length of separation area.
3. It was displayed that after application of the plasma actuator, pressure gradient has a much higher non-uniform distribution.
4. The maximum value of the pressure gradient in actuator application mode is much higher than non-application mode. Besides, this value which is maximum is achieved before point of separation in plasma application status and after separation in non-application status.
5. In addition, the results of simulation proved that the separation can be controlled through plasma actuator. 6. The graph of the total flow pressure on the symmetry
application mode is higher and after it, the graphs are replaced.
Nomenclature
fB Body force per unit volume, N/m3 E Electric field, N/C
e Coefficient of expansion, mm Uτ Friction velocity, m/s I Turbulence Intensity, % Re Reynolds number
K Turbulent kinetic energy, (m2/s2) U Flow velocity, m/s
Lt Turbulent mixing length Dh Hydraulic Diameter, mm C0 Courant number
r3 Inlet radius, mm r4 Outlet radius, mm
Wi Width of beginning area without electrode, mm
We1 Width primary electrode, mm
Xe Width of the area between electrodes, mm We2 Width of terminal electrode, mm
t Time, s x, y, z Coordinates
Greek Symbols
ɸ Total electric potential, Volt ɛ Electrical Permittivity, ɛ=ɛrɛ0 ɛr Relative Permittivity of the Medium ɛ0 Permittivity of free space, 8.854×10⁻¹²
C2/Nm2
τω Wall shear stress, N/m2 ρ Density, kg/m3
ρc Net charge density, C/m3 ω Specific Dissipation rate , s -1 Cµ k–ε model parameter, 0.09
δ99 The thickness of the turbulent boundary layer when the velocity reaches up to 99% of the maximum velocity
Appendix 1
{
type groovyBC;
variables “rhoMax=0.0008; w=4500; r=sqrt(pow(pos().x,2)+pow(pos().y,2));”;
valueExpression “rhoMax*exp(-pow(r-.237-0.041, 2)/0.18)* sin (2*pi*w*time())”;
evaluateDuringConstruction true; }
Appendix 2
Inlet {
type groovyBC;
variables “R=0.237; theta=5*pi/180; V=48.998; COS=pos().x/R; SIN=pos().y/R; u=V*sin(theta)*COS+V*cos(theta)*SIN; v=V*sin(theta)*SIN-V*cos(theta)*COS;”; valueExpression “vector(u,v,0)”;
evaluateDuringConstruction true; }
Appendix 3
backWall {
type nutkRoughWallFunction; value uniform 0; Ks uniform 1e-6; Cs uniform 0.5; }
Appendix 4
application rhoPimpleFoam; startFrom startTime; startTime 0;
stopAt endTime; endTime 0.02; deltaT 1e-4; writeControl timeStep; writeInterval 10; purgeWrite 0; writeFormat ascii; writePrecision 10; writeCompression off; timeFormat general; timePrecision 6; runTimeModifiable true; adjustTimeStep yes; maxCo 0.5; maxDeltaT 1;
References
[1]M. Malik, L. Weinstein, M. Hussani, Ion Wind Drag Reduction, AIAA, 21st Aerospace Sciences Meeting and Exhibit, Reno, NV, U.S.A (1983).
[2]S. Grundmann, S. Klump, C. Tropea, Experimental and Numerical investigations of Boundary-Layer influence using Plasma Actuators, Active Flow Control, 95(3), 56–68, (2007).
[3]D.M. Orlov, A. Apker, C. He, H. Othman, T.C. Corke, Modeling and Experiment of Leading Edge Separation Control Using SDBD Plasma Actuators, AIAA 2007, 45th Aerospace Sciences Meeting, Reno, Nevada, 1– 18 ,(2007).
[4] R. Sosa, G. Artana, E. Moreau, G. Touchard, Stall control at high angle of attack with plasma sheet actuators, Experiments in Fluids, 42(1), 143–167, (2007).
[5] J. Huang, T.C. Corke, F. Thomas, Plasma actuator for separation control of low pressure turbine blades, AIAA Journal, 44(1), 51–57, (2006).
[7] J. Huang, Separation Control over Low Pressure Turbine Blades Using Plasma Actuators, PhD Thesis, University of Notre Dame, (2005).
[8] X. Xu, Plasma Actuators for Boundary Layer Separation Control in Engine Ducts, PhD Thesis, University of École Polytechnique de Montréal, (2011).
[9] M.P. Patel, T.T. Ng, S. Vasudevan, T.C. Corke, M.L. Post, T.E. McLaughlin, C.F. Suchomel, Scaling effects of an aerodynamic plasma actuator, J. Aircraft, 45(1), 223–236, (2008). [10] R. Khoshkhoo, A. Jahangirian, Numerical
simulation of flow separation con-trol using multiple DBD plasma actuators, J. Appl. Fluid Mech. 9(4), 1865–1875, (2016).
[11] L. Shen, C.Y. Wen, H.A. Chen, Asymmetric flow control on a delta wing with dielectric barrier discharge actuators, AIAA J. 54(2), 652–658, (2016).
[12] T. Ashcraft, K. Decker, J. C. Little, Control of boundary layer separation and the wake of an airfoil using ns-DBD plasma actuators, in: 54th AIAA Aerospace Sciences Meeting, American Institute of Aeronautics and Astronautics, (2016).
[13] X. Meng, H. Hu, X. Yan, F. Liu, S. Luo, Lift improvements using duty-cycled plasma actuation at low Reynolds numbers, Aerosp. Sci. Technol. 72,123–133, (2018).
[14] A. Ebrahimi, M. Hajipour, Flow separation control over an airfoil using dual excitation of DBD plasma actuators, Aerospace Science and Technology, 79, 658-668, (2018).
[15]S. Lemire, H.D. Vo, M.W. Benner, Performance Improvement of Axial Compressors and Fans with Plasma Actuation, International Journal
of Rotating Machinery, 2009(247613), 1-13, (2009).
[16] W. Shyy, B. Jayarman, A. Anderson, Modeling of Glow Discharge-Induced Fluid Dynamics, Journal of Applied Physics, 92(11), 6434– 6443, (2002).
[17] D.M. Orlov, T.C. Corke, Electric Circuit Model for Aerodynamic Plasma Actuator, 44th Aerospace Sciences Meeting and Exhibit, Reno, NV,U.S.A, (2006)
[18] Y.B. Suzen, P.G. Huang, J.D. Jacob, D.E. Ashpis, Numerical Simulations of Plasma Based Flow Control Applications, 35th Fluid Dynamics Conference and Exhibit, Toronto, Ontario, (2005).
[19] S. Leonov, S.V. Bityurin, N. Avischenko, A. Yuriev, V. Gromov, Influence of Surface Electrical Discharge on Friction of Plate in Subsonic and Transonic Airfoil, 39th Aerospace Sciences Meeting and Exhibit Reno, NV,U.S.A, (2001)
[20] J. Jacob, R. Rivir, C. Campbell, C. Estevedoreal, Boundary Layer Flow Control Using AC Discharge Plasma Actuators, 2nd AIAA Flow Control Conference, Portland, Oregon.USA, (2004).
[21] F.P. Incropera, D.P. Dewitt, T.L. Bergman, A.S. Lavine, Introduction to Heat Transfer, 5th edition., John Wiley & Sons publication, (2002).
[22] C. Clarke, A Local Flow Angle Approach to Centrifugal Compressor Vaneless Diffuser Stability, PhD Thesis, Michigan State University, (2016).