DOI
10.17219/acem/73734
Copyright
© 2018 by Wroclaw Medical University This is an article distributed under the terms of the Creative Commons Attribution Non-Commercial License (http://creativecommons.org/licenses/by-nc-nd/4.0/)
Address for correspondence
Ewelina Grywalska
E-mail: ewelina.grywalska@gmail.com
Funding sources
This study was supported by the National Science Center, Poland (grant Nos.: UMO-2011/01/N/ NZ6/01762 and UMO-2012/05/B/NZ6/00792).
Conflict of interest
None declared
Received on March 11, 2017 Reviewed on April 5, 2017 Accepted on May 15, 2017
Abstract
Background. Splenectomized patients are more prone to bacterial infections due to their immunocompro-mised status. Little is known about the role of T helper 17 (Th17) and T regulatory cells (Treg) in the immune system of patients after the removal of the spleen.
Objectives. The aim of the present study was to analyze possible changes in CD4+ lymphocyte T subsets, especially Treg and Th17, in patients who had undergone splenectomy.
Material and methods. The study included a group of 67 male patients (41.74 ±16.22 years). All patients had undergone splenectomy because of spleen injury. Mean time elapsed from splenectomy to analysis was 9.1 ±4.6 years. Control samples were obtained from 20 male healthy volunteers. The percentages and absolute counts of Th17 and Treg were measured using the flow cytometry method.
Results. The analysis of the antibody titer against 23 serotypes of Streptococcus pneumoniae (S. pneu-moniae) in the splenectomized patients revealed its elevated values compared to controls (p = 0.0016). Higher percentages and absolute counts of Treg cells were found in the splenectomized group vs controls (p < 0.000007). Lower percentages and absolute counts of the Th17 subset were found in the study group vs controls (p < 0.000002 and p < 0.00006, respectively). The Treg cell percentage was positively correlated with the antibody titer against S. pneumoniae (p < 0.02). Th17 cells were reversely correlated with the antibody titer (p < 0.004 and p < 0.001 for absolute counts and percentage values, respectively). The Th17 subset values were significantly lower in the splenectomized patients who reported a higher frequency of upper respiratory tract infections (URTI) (p < 0.0001). No correlations were found between the time elapsed since splenectomy and the Treg or Th17 cell values in the study group.
Conclusions. Splenectomy results in an important deterioration of the Treg/Th17 cell balance with a pre-dominance of immunoregulatory Tregs, which can contribute to insufficient immune response to infection.
Key words: immune response, T helper 17 cells, T regulatory cells, splenectomy
The clinical importance of changes in Treg and Th17
lymphocyte subsets in splenectomized patients after spleen injury
Witold Zgodziński
1,A–F, Ewelina Grywalska
2,A–F, Dorota Siwicka-Gieroba
3,B,F, Agata Surdacka
2,B,F,
Krzysztof Zinkiewicz
1,B,E,F, Dariusz Szczepanek
4,B,F, Grzegorz Wallner
1,E,F, Jacek Roliński
2,E,F1 2nd Department of General, Gastrointestinal Surgery and Surgical Oncology of the Alimentary Tract, Medical University of Lublin, Poland 2 Department of Clinical Immunology and Immunotherapy, Medical University of Lublin, Poland
3 Department of Anesthesiology, Medical University of Lublin, Poland
4 Department of Neurosurgery and Pediatric Neurosurgery, Medical University of Lublin, Poland
A – research concept and design; B – collection and/or assembly of data; C – data analysis and interpretation; D – writing the article; E – critical revision of the article; F – final approval of the article
Introduction
In 1919, Morris and Bullock reported on a preliminary study indicating the importance of the spleen in resis-tance to infection.1 Further studies on animal models have
shown significant relationships between splenectomy and the peripheral leukocyte count.2
After splenectomy, mechanisms that play important roles in bacterial clearance are impaired, which leads to an increased risk of severe infections. The absence of the phagocytic function of the spleen and the long-term im-pairment of humoral response to encapsulated bacteria are the main reasons for the overwhelming postsplenectomy infection (OPSI) syndrome. This severe infection occurs at an estimated incidence of 0.23–0.42% per year, with a lifetime risk of 5%.3,4 The course of OPSI can be
life-threatening, with a mortality rate of 38–69%.3,5,6 Early
diagnosis and aggressive therapy can decrease the number of fatal outcomes to 10–40%.7 The highest risk of infection
occurs during the first 3 years after splenectomy, particu-larly in children younger than 5 years.8,9 OPSI is most
com-monly induced by encapsulated bacteria and Streptococcus
pneumoniae (S. pneumoniae) is responsible for 50–90%
of all cases of OPSI.3,7 This has been attributed to the
ab-sence of marginal zone B cells in these patients.10 Each
patient should be vaccinated for S. pneumoniae both before and after splenectomy to minimize the risk of infection. According to the guidelines from the Centers for Disease Control and Prevention (CDCs), it is recommended to vac-cinate for S. pneumoniae and Haemophilus influenzae
type b (H. influenzae) at least 14 days before surgery, and to vaccinate for S. pneumoniae, H. influenzae and
Neis-seria meningitidis after splenectomy. Vaccination for
in-fluenza is also recommended once a year in this group of patients.11 In cases of urgent splenectomy, vaccination
before surgery is not applicable. In these cases, it is im-portant to follow the guidelines for vaccination after sur-gery. However, post-splenectomy vaccinations, especially in urgent cases, seem to be less effective.8 The lack of the
spleen causes significant disorders in humoral immune response.12 Despite a significant amount of evidence on
B-lymphocyte function impairment, little is known about the distribution of separate populations of T-lymphocytes in splenectomized patients. CD4+ T cells are essential for directing immune responses during host defense and for the pathogenesis of inflammatory diseases. Recently, more attention has been paid to T regulatory cells (Treg cells) and the positive effects they exert by regulating immune response to self-antigens. Treg cells are a subset of pheno-typically and functionally specific T lymphocytes which play an important role in the maintenance of immune tolerance. Foxp3, a member of the forkhead/winged-helix family of the transcription factor, has been identified as the best marker of Treg cells.13 The dysfunction of Treg
cells is observed in a variety of autoimmune diseases such as systemic lupus erythematosus (SLE) and rheumatoid
arthritis.14,15 T helper 17 (Th17) IL-17A+CD3+CD4+ cells
represent a subset of T helper cells that can play an active role in several inflammatory and autoimmune diseases.16
It has been demonstrated that human Th17 cells express IL-17A, IL-17F, IL-22, IL-26, IFN-γ, the chemokine CCL20, the transcription factor ROR-γt, and IL-23R.17 It has been
shown that the balance of Treg/Th17 controls immune response as an important factor in regulating the Th cell function relating to the Th1/Th2 shift in the graft vs host disease.18 The Treg/Th17 imbalance contributes to the
de-velopment of autoimmune diseases, such as SLE,19 primary
nephrotic syndrome20 and idiopathic thrombocytopenic
purpura.21
The aim of the present study was to analyze possible changes in the CD4+ lymphocyte T subsets, especially Treg and Th17, in patients who had undergone splenec-tomy, and to assess the relationships between increased susceptibility to infections and the Treg/Th17 status in this group.
Material and methods
Study and control groups
in accordance with the Code of Ethics of the World Medi-cal Association (Declaration of Helsinki) for experiments involving humans. The Local Ethics Committee approved the research and patients gave their prior written consent.
The isolation of peripheral blood
mononuclear cells and the detection
of Th17 and Treg cells
The isolation of peripheral blood mononuclear cells (PBMCs) and the detection of Th17 and Treg cells were performed as described previously.22
The peripheral blood was diluted 1:1 with a 0.9% phos-phate-buffered saline (PBS) without calcium (Ca2+) or
magnesium (Mg2+) ions (Biochrome AG, Berlin, Germany).
The diluted material was then overlaid on 3 mL of Gradisol L preparation (Aqua Medic, Łódź, Poland) with a specific gravity of 1.077 g/mL and subjected to density gradient centrifugation at 700 × g for 20 min. The obtained fraction of PBMCs was collected with a Pasteur pipette and washed twice in PBS without Ca2+ and Mg2+ ions for 5 min. Next,
the cells were suspended in 1 mL of PBS without Ca2+ and
Mg2+, and counted in the Neubauer chamber, and their
vi-ability was determined by a trypan blue dye exclusion assay (0.4% Trypan Blue Solution; Sigma-Aldrich, St. Louis, USA).
For the detection of Th17 cells, PBMCs were resuspended in RPMI-1640 culture medium (Sigma-Aldrich) containing 10% heat-inactivated fetal calf serum (FCS, Sigma-Aldrich), 2 mM l-glutamine, 100 U/mL penicillin (Sigma-Aldrich), and 100 μg/mL streptomycin (Sigma-Aldrich). Mononu-clear cells were stimulated for 5 h at 37°C in 5% CO2 with
25 ng/mL of phorbol 12-myristate 13-acetate (PMA, Sigma Chemical, St. Louis, USA) and 1 μg/mL of ionomycin (Sig-ma Aldrich) in the presence of 10 μg/mL of brefeldin A (Sig-ma-Aldrich), which blocks the intracellular transport pro-cesses resulting in the accumulation of cytokine proteins on the Golgi complex. Next, PBMCs were collected, washed with PBS solution and prepared at a final concentration of 106 cells/mL. The number of viable leukocytes was de-termined using a 1% trypan blue dye exclusion assay. Later, the mononuclear cells were stained with anti-CD3 Cy-Chrome and anti-CD4 fluorescein-isothiocyanate (FITC) conjugated monoclonal antibodies (Becton Dickinson, San Diego, USA). The permeabilization of cell membranes was achieved with a Cytofix/Cytoperm Kit (BD Pharmingen, San Jose, USA), which was added for 15 min at a tempera-ture of 4°C. Next, the cells were washed twice with PBS. The permeabilized cells were stained with a phycoerythrin (PE)-conjugated anti-human IL-17A monoclonal antibody (eBioscience, San Diego, USA). Then, cells were washed twice with PBS again.
For the detection of Treg CD4+CD25+Foxp3+ cells, the cell surface and intracellular antigens were determined on fresh cells at the time of sample submission by cell staining according to the manufacturer’s protocols. A total of 500 μL of cell suspensions were added to 5 μL
of an appropriate solution of anti-human CD25 PE and an-ti-human CD4 PE-Cy5-conjugated antibodies (BioLegend, San Diego, USA). Next, the mixture of cells and antibodies was incubated for 30 min at 4°C in the dark, centrifuged, washed twice by adding 1 mL of cold PBS to each tube with 1% sodium azide and 1% FCS, and centrifuged again at 400 × g for 10 min. After the standard incubation with antibodies directed against surface markers, the incuba-tion by fixaincuba-tion and permeabilizaincuba-tion with FoxP3 Fix/Perm Buffer and FoxP3 Perm Buffer (BioLegend) was performed. Then, the incubation with antibodies directed against the intracellular protein FoxP3 – anti-human FoxP3 (Pacific Blue) monoclonal antibody (BioLegend) was carried out. Later, the supernatant was separated and, after washing, each sample was suspended in 200 μL of PBS.
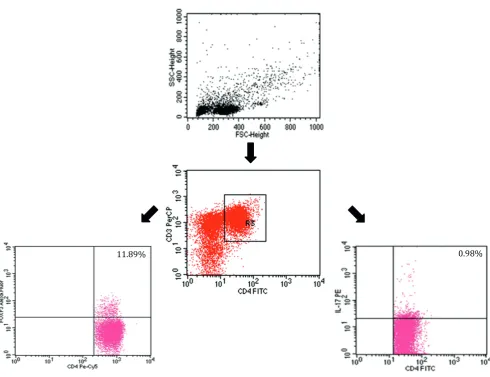
The cells were immediately analyzed with a Becton Dickinson Canto II flow cytometer and analyzed by us-ing FACSDiva™ software (Becton Dickinson). The results were presented as the percentage of CD45+ cells stained with the antibody. The percentage of positive cells was calculated via a comparison with the control. Background fluorescence was determined using isotype-matched, di-rectly conjugated mouse anti IgG1/IgG2α monoclonal an-tibodies. The samples were gated on forward scatter vs side scatter to exclude debris and cell aggregates.22 An example
of a cytometric analysis is presented in Fig. 1.
The assessment of basic
lymphocyte subsets
Three-color immunofluorescence analyzes were per-formed using a FACS Calibur flow cytometer (Becton Dickinson) equipped with a 488 nm argon laser. A mini-mum of 10,000 events were acquired and analyzed using CellQuest software (Becton Dickinson). The percentage of cells expressing surface markers was analyzed. The cells were phenotypically characterized by incubation (20 min in the dark at room temperature) with a combination of rel-evant FITC- PE- and CyChrome-labeled monoclonal anti-bodies. Immunofluorescence studies were performed using a combination of the following mAbs: CD3 FITC/CD19 PE and CD8 FITC/CD4 PE (Becton Dickinson).23
Serum pneumococcal antibody
assessment
of the test. The evaluation procedure was followed accord-ing to the manufacturer’s instructions and an automatic VICTOR3 reader (Perkin Elmer, San Diego, USA) was used for result interpretation.24
Statistical analysis
The normal distribution of continuous variables was veri-fied with the Shapiro-Wilk test. Categorical variables were presented as percentages and were compared using the χ2 test.
Continuous variables were presented as means and standard deviations (SD). The U Mann-Whitney test and the Student’s t-test were applied for intergroup comparisons of the vari-ables, according to the distribution. Pearson’s linear correla-tion coefficient (r) was calculated to disclose relacorrela-tionships between the variables. All calculations were conducted using STATISTICA v. 10 software (StatSoft, Tulsa, USA). A p-value <0.05 was considered statistically significant.
Results
The analysis of the blood samples taken from the sple-nectomized patients revealed elevated antibody titer against S. pneumoniae compared to the healthy control group (833.68 ±535.98 vs 284.6 ±182.02; p = 0.0016) (Fig. 2). In the study group, a lower percentage of CD4+ cells was noted compared to the controls (median 37.89% vs 44.43%; p < 0.00128) and a higher percentage and quantity of CD19+ cells compared to the controls (median 11.6% vs 8.79%, p < 0.00001 and mean 0.328 ±0.156 vs 0.274 ±0.241, p < 0.006, respectively). In the Treg subset, a significantly higher percentage (median 9.85%) and total amount (mean 0.285 × 10³/mm3 ±0.133) were noted in the study group vs
controls (5.22%, p < 0.000001 and 0.128 × 10³/mm3 ±0.057,
p < 0.000007, respectively) (Fig. 3). In the Th17 subset, a significantly lower percentage (median 0.85%) and to-tal amount (mean 0.027 × 10³/mm3 ±0.021) were found
in the study group vs controls (2.64%, p < 0.000002 and
Fig. 1. An example of a 3-color flow cytometry analysis of lymphocytes from a splenectomized patient
The upper dot-plot shows the forward scatter/side scatter (FSC/SSC) distribution and the gate used to select lymphocytes for analysis. The lower left flow cytometry dot-plot shows the analysis of the percentage of Treg cells; the analysis was based on gating a subpopulation of FoxP3-positive Treg cells among T CD4-positive lymphocytes. The lower right flow cytometry dot-plot shows the analysis of the percentage of Th17 cells; the analysis was based on gating a subpopulation of Th17 cells among T CD4-positive lymphocytes. The number in the upper right quadrant in the dot-plots represents the percentage of Treg cells (bottom left dot-plot) and the percentage of Th17 cells (bottom right dot-plot).
omów regulatorowych - D3+CD4+
0.072 × 10³/mm3 ±0.058, p < 0.00006, respectively) (Fig. 4).
Mean percentage values and mean quantity values of lym-phocyte subsets in the study (splenectomized) population and the control group are presented in Table 1.
In the study group, the Treg cell percentage was positively correlated with antibody titer (r = 0.467595, p < 0.02) (Fig. 5 A). Conversely, there was a negative correlation between Th17 cells and antibody titer (r = −0.628008, p < 0.001 and r = −0.580325, p < 0.004 for percentage and total quantity values, respectively) (Fig. 5 B,C).
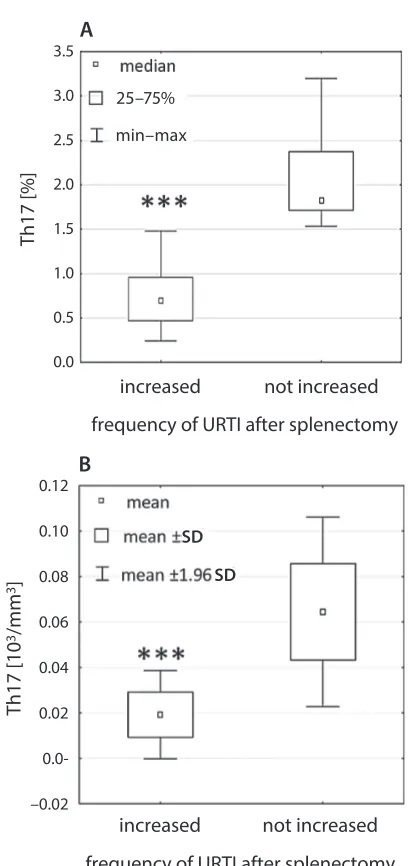
In the study group, among patients who reported a higher incidence of URTI, in the Th17 subset, the quan-tity (mean 0.019 × 10³/mm3 ±0.0099) and percentage
val-ues (median 0.69%) were significantly lower compared to those of the patients who did not report a higher URTI frequency (0.064 × 10³/mm3 ±0.021, p < 0.000001 and
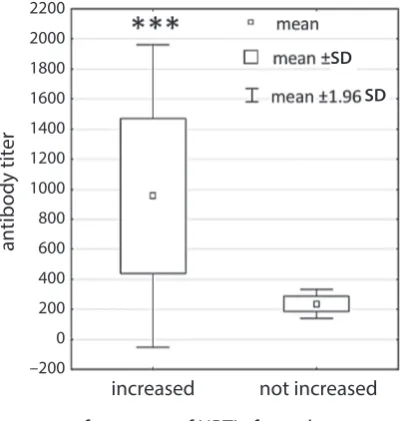
1.81%, p < 0.00005, respectively) (Fig. 6). The patients with a higher incidence of URTI also had a significantly higher
Fig. 4. The differences in the total amount of the Th17 subset between splenectomized patients (study group) and controls. (*** p < 0.00006) (A); the differences in the percentage of the Th17 subset between splenectomized patients (study group) and controls (*** p < 0.000002)
Fig. 2. The difference in antibody titer between splenectomized patients (study group) and controls
*** p = 0.0016.
Fig. 3. The differences in the percentage of the Treg subset between splenectomized patients (study group) and controls (*** p < 0.000001) (A); the differences in the total amount of the Treg subset between splenectomized patients (study group) and controls (*** p < 0.000007) (B)
antibody titer
study group control 2400
2200 2000 1800 1600 1400 1200 1000 800 600 400 200 0 –200 –400
Treg [%]
Treg [10
3/mm 3]
study group control B
A
study group control
18
16
14
12
10
8
6
4
2
0
0.6
0.5
0.4
0.3
0.2
0.1
0.0
–0.1
Th17 [%]
study group control
10 9 8 7 6 5 4 3 2 1 0 –1
Th17 [10
3/mm 3]
study group control
0.20 0.18 0.16 0.14 0.12 0.10 0.08 0.06 0.04 0.02 0.00 –0.02 –0.04 –0.06
B A
SD SD
SD SD
antibody titer (955.94 ±514.13 vs 235.85 ±49.94; p < 0.0007) (Fig. 7). No statistically significant correlation was found between the time elapsed since splenectomy and the Treg or Th17 cell values in the study group.
Discussion
The aim of the present study was to assess the relationship between the lack of the spleen and the quantity of separate subpopulations of T lymphocytes as well as the number of specific antibodies against S. pneumoniae. Our study facilitates an understanding of the mechanisms which are behind weakened immune response in patients after sple-nectomy. The higher levels of specific antibodies against
S. pneumoniae and values of CD19+ cells in the
splenecto-mized patients compared to the control group suggest an in-creased exposure to antigens in bacterial capsules. It can be assumed that these patients reveal a higher exposure to bacterial antigens; thus, they are more susceptible to in-fections induced by this pathogen. This is in accordance with the results of previous studies indicating higher morbidity
Fig. 6. The difference in the Th17 subset values – percentage (*** p < 0.00005) (A) and quantity (*** p < 0.000001) (B) – between splenectomized patients who reported a higher incidence of upper respiratory tract infections (URTI) and those who did not report a higher URTI frequency
Fig. 5. Scatter diagrams presenting the positive correlation between the percentage of Treg cells and antibody titer against S. pneumoniae in splenectomized patients (A); the negative correlation between the percentage of Th17 cells (B), the quantity of Th17 cells (C) and antibody titer against S. pneumoniae in splenectomized patients
2600 2400 2200 2000 1800 1600 1400 1200 1000 800 600 400 200 0 –200 –400 2600 2400 2200 2000 1800 1600 1400 1200 1000 800 600 400 200 0 –200 –400
Th17 [%]
antibody titer
antibody titer
Treg [%]
antibody titer
Th17 [10
3/mm
3]
4.0 3.5 3.0 2.5 2.0 1.5 1.0 0.5 0.0 –0.5 –1.0
–400 0 400 800 1200 1600 2000 2400 0 2 4 6 8 10 12 14 16 18
–0.02 0.00 0.02 0.04 0.06 0.08 0.10 0.12 –200 200 600 1000 1400 1800 2200 2600
Th17 [%] Th17 [10 3/m m 3] B A 0.12 0.10 0.08 0.06 0.04 0.02 0.0-–0.02
increased not increased frequency of URTI after splenectomy
increased not increased frequency of URTI after splenectomy
3.5 3.0 2.5 2.0 1.5 1.0 0.5 0.0 Th17 [%] Th17 [10 3/m m 3] B A 0.12 0.10 0.08 0.06 0.04 0.02 0.0-–0.02
increased not increased frequency of URTI after splenectomy
increased not increased frequency of URTI after splenectomy
3.5 3.0 2.5 2.0 1.5 1.0 0.5 0.0 SD SD min–max 25–75% r = 0.467
p < 0.02
r = –0.628 p < 0.001
in splenectomized patients for S. pneumoniae-related in-fections.7 In unvaccinated patients, the increase in the
per-centage of Treg lymphocytes, which also correlates with high levels of specific antibodies, seems to be distressing. The association with low levels of pro-inflammatory Th17 lymphocytes and higher antibody titer in splenectomized patients suggests that inflammatory response to S.
pneu-moniae capsule antigens is suppressed, and thus ineffective
in this group.25,26 In healthy, immunocompetent patients, the
preservation of an appropriate balance between Th17 and Treg cells is one of the conditions for the best inflammatory
response. There is a search for the reasons of the disrup-tion of this balance to the benefit of Th17 lymphocytes, as this is one of the causes of autoimmune diseases or chronic inflammatory disorders.27 The prevalence of regulatory
T-lymphocytes is associated with immunosuppression, which results from their natural role in the immunotoler-ance of the body.28 Therefore, the balance between
regulato-ry T-lymphocytes and Th17 lymphocytes plays a significant role in the development of an effective inflammatory re-sponse.27 Changes observed in this relation in patients after
splenectomy may suggest that inflammatory response to the antigens contained in the S. pneumoniae capsula is sup-pressed, and thus ineffective. Therefore, despite the evidence of antigen stimulation, there is no effective immunological response from the immune system. These conclusions seem to be confirmed by the results of the quantity and percent-age assessment of Th17 cells in the group of splenectomized patients reporting a higher incidence of URTI. Previous observations have demonstrated a positive correlation be-tween the time elapsed since splenectomy and the percent-age of peripheral blood CD4+ cells in the group of patients splenectomized because of an abdominal trauma.23 Findings
observed in the present study show that CD4+ cells com-prise a smaller subset of lymphocytes compared to controls, but there is a tendency to rebuild this population over time. In the present research, we only enrolled patients splenecto-mized due to spleen injury. Elective splenectomy is generally performed on patients with idiopathic thrombocytopenic purpura; however, these patients are referred to pre-surgery vaccination that may influence the status of lymphocyte subsets. This study group is homogenous and vaccination-naive, and the results are free of any possible impact from the vaccine. Future studies are needed to assess the possible effects of vaccination on CD4+ cell frequency in splenec-tomized patients.
Fig. 7. The difference in antibody titer against S. pneumoniae between splenectomized patients who reported a higher incidence of upper respiratory tract infections (URTI) and those who did not report a higher URTI frequency (***p < 0.0007)
Table 1. Mean percentage and quantity values of lymphocyte subsets in the study population (splenectomized) and healthy control group
Lymphocyte subsets
Study group n = 67
Control group n = 20
p-value
mean standard deviation mean standard deviation
T CD3+ [%] 66.18727 8.482736 65.74850 13.25141 n.s.
T CD3+ [103/mm3] 1.70540 0.610206 1.60591 0.52374 n.s.
B CD19+ [%] 12.74493 3.589680 11.33450 8.94963 0.00001
B CD19+ [103/mm3] 0.32872 0.156565 0.27496 0.24151 0.006
T CD4+ [%] 37.05227 9.676037 44.04050 3.40697 0.00128
T CD4+ [103/mm3] 0.93664 0.360878 1.07664 0.27880 n.s.
Treg [%] 9.817632 3.006509 5.230500 1.692536 0.000001
Treg [103/mm3] 0.285388 0.133895 0.128761 0.057754 0.00026
Th17 [%] 1.018684 0.656494 2.833500 1.836078 0.000001
Th17 [103/mm3] 0.027888 0.021533 0.072838 0.058360 0.00006
T CD8+ [%] 26.08621 9.130860 30.43050 7.18799 n.s.
T CD8+ [103/mm3] 0.68469 0.381220 0.73060 0.21428 n.s.
n.s. – non-significant.
antibody titer
increased not increased frequency of URTI after splenectomy 2200
2000 1800 1600 1400 1200 1000 800 600 400 200 0 –200
Conclusions
This research shows for the first time that substantial changes are occurring in the immunological system after splenectomy. Splenectomy has a significant effect on the quantitative distribution of lymphocyte subsets. Patients who undergo splenectomy reveal a strong reverse balance between Treg and Th17 lymphocytes. Certainly, this is one of the factors leading to a deterioration in the immunity response of the body against bacterial antigens. The high level of specific antibodies in these patients does not cor-relate with effective immunity.
References
1. Morris DH, Bullock FD. The importance of the spleen in resistance to infection. Ann Surg. 1919;70:513–521.
2. Bessler H, Bergman M, Salman H, Beilin B, Djaldetti M. The relation-ship between partial splenectomy and peripheral leukocyte count. J Surg Res. 2004;122:49–53.
3. Davidson RN, Wall RA. Prevention and management of infections in patients without a spleen. Clin Microbiol Infect. 2001;7:657–660. 4. Shatz DV. Vaccination practices among North American trauma
sur-geons in splenectomy for trauma. J Trauma. 2002;53:950–956. 5. Aguilar RB, Keister KJ, Russell AC. Prevention of sepsis after
splenec-tomy. Dimens Crit Care Nurs. 2010;29:65–68.
6. Di Sabatino A, Carsetti R, Corazza GR. Post-splenectomy and hypo-splenic states. Lancet. 2011;378:86–97.
7. Morgan TL, Tomich EB. Overwhelming post-splenectomy infection (OPSI): A case report and review of the literature. J Emerg Med. 2012; 43:758–763.
8. Davies JM, Lewis MP, Wimperis J, Rafi I, Ladhani S, Bolton-Maggs PH. Review of guidelines for the prevention and treatment of infec-tion in patients with an absent or dysfuncof infec-tional spleen, prepared on behalf of the British Committee for Standards in Haematology by a working party of the Haemato-Oncology task force. Br J Hae-matol. 2011;155:308–317.
9. Evans DI. Postsplenectomy sepsis 10 years or more after operation. J Clin Pathol. 1985;38:309–311.
10. Torres A, Bonanni P, Hryniewicz W, Moutschen M, Reinert RR, Welte T. Pneumococcal vaccination: What have we learnt so far and what can we expect in the future? Eur J Clin Microbiol Infect Dis. 2015;34:19–31.
11. Centers for Disease Control and Prevention (CDC). Recommended Adult Immunization Schedule – United States, 2016. www.cdc.gov/ vaccines/schedules/downloads/adult/adult-schedule.pdf. Accessed February 25, 2016.
12. Zandvoort A, Timens W. The dual function of the splenic marginal zone: Essential for initiation of anti-TI-2 responses but also vital in the general first-line defense against blood-borne antigens. Clin Exp Immunol. 2002;130:4–11.
13. Adeegbe D, Matsutani T, Yang J, Altman NH, Malek TR. CD4(+) CD25(+) Foxp3(+) T regulatory cells with limited TCR diversity in control of autoimmunity. J Immunol. 2010;184:56–66.
14. Bonelli M, Savitskaya A, von Dalwigk K, et al. Quantitative and qual-itative deficiencies of regulatory T cells in patients with systemic lupus erythematosus (SLE). Int Immunol. 2008;20:861–868. 15. Sempere-Ortells JM, Perez-Garcia V, Marin-Alberca G, et al.
Quantifica-tion and phenotype of regulatory T cells in rheumatoid arthritis accord-ing to disease activity score-28. Autoimmunity. 2009;42:636–645. 16. Annunziato F, Cosmi L, Santarlasci V, et al. Phenotypic and
function-al features of human Th17 cells. J Exp Med. 2007;204:1849–1861. 17. Wilson NJ, Boniface K, Chan JR, et al. Development, cytokine profile
and function of human interleukin 17-producing helper T cells. Nat Immunol. 2007;8:950–957.
18. Afzali B, Lombardi G, Lechler RI, et al. The role of T helper 17 (Th17) and regulatory T cells (Treg) in human organ transplantation and autoimmune disease. Clin Exp Immunol. 2007;148:32–46.
19. Yang J, Chu Y, Yang X, et al. Th17 and natural Treg cell population dynamics in systemic lupus erythematosus. Arthritis Rheum. 2009;60: 1472–1483.
20. Shao XS, Yang XQ, Zhao XD, et al. The prevalence of Th17 cells and FOXP3 regulate T cells (Treg) in children with primary nephrotic syn-drome. Ped Nephrol. 2009;24:1683–1690.
21. Yu S, Liu C, Li L, et al. Inactivation of Notch signaling reverses the Th17/Treg imbalance in cells from patients with immune thrombo-cytopenia. Lab Invest. 2015;95:157–167.
22. Klatka M, Grywalska E, Partyka M, Charytanowicz M, Kiszczak--Bochynska E, Rolinski J. Th17 and Treg cells in adolescents with Graves’ disease: Impact of treatment with methimazole on these cell subsets. Autoimmunity. 2014;47:201–211.
23. Grywalska E, Surdacka A, Miturski A, et al. Characterisation of lym-phocyte subsets in asplenic patients: Preliminary report. Centr Eur J Immunol. 2010;35:239–244.
24. Pasiarski M, Rolinski J, Grywalska E, et al. Antibody and plasmablast response to 13-valent pneumococcal conjugate vaccine in chronic lymphocytic leukemia patients: Preliminary report. PLoS One. 2014;9: e114966.
25. Josefowicz SZ, Lu LF, Rudensky AY. Regulatory T cells: Mechanisms of differentiation and function. Annu Rev Immunol. 2012;30:531–564. 26. Bettelli E, Carrier Y, Gao W, et al. Reciprocal developmental path-ways for the generation of pathogenic effector TH17 and regulato-ry T cells. Nature. 2006;441:235–238.