C
OST OF
E
QUITY FOR
E
NERGY
U
TILITIES
:
B
EYOND THE
CAPM
STÉPHANE CHRÉTIEN & FRANK COGGINS
ABSTRACT
The Capital Asset Pricing Model (CAPM) is applied in regulatory cases to estimate the required rate of return, or cost of equity, for low-beta, value-style energy utilities, despite the model’s well documented mispricing of investments with similar characteristics. This paper examines CAPM-based estimates for a sample of American and Canadian energy utilities to assess the risk premium error. We find that the CAPM significantly underestimates the risk premium for energy utilities compared to its historical value by an annualized average of more than 4%. Two CAPM extensions, the Fama-French model and an adjusted CAPM, provide econometric estimates of the risk premium that do not present a significant misevaluation.
JEL Classifications: G12, L51, L95, K23
Keywords: Cost of Capital, Rate of Returns, Energy Utilities
Corresponding author: Stéphane Chrétien, Investors Group Chair in Financial Planning Associate Professor of Finance, Finance, Insurance and Real Estate Department Faculty of Business Administration, Laval University, CIRPÉE, GReFA, and LABIFUL
Pavillon Palasis-Prince, 2325, rue de la Terrasse, Quebec City, QC, Canada, G1V 0A6 Voice: 1 418 656-2131, ext. 3380. E-mail: [email protected]
Frank Coggins, Associate Professor of Finance, Department of Finance Faculté d’administration, Université de Sherbrooke, CIRPÉE and GReFA,
1.INTRODUCTION
An important aspect of the regulatory process for energy utilities is the determination of their equity rate of return. This return, also known as the cost of equity capital, represents the expected remuneration of the shareholders of the utilities. It is a crucial component of their total cost of capital, which is central to their investment policy and serves as a basis for setting up the rates to their customers. The purpose of this paper is to highlight the problems of the most commonly used model to determine the equity rate of return for energy utilities and to propose two alternative models that empirically improve on the estimation. By providing new direct and focused evidence for energy utilities, our analysis contributes to the knowledge of energy, regulatory and financial economists, as well as regulators, who are concerned with rate determination.
Regulatory bodies, like the National Energy Board in Canada or the Federal Energy Regulatory Commission in the United States, have the mandate to set the equity rate of return so that it is fair and reasonable. Specifically, according to Bonbright, Danielsen and Kamerschen (1988, Chap. 10), the return should provide the ability to attract and retain capital (the capital-attraction criterion), encourage efficient managerial practice (the management-efficiency criterion), promote consumer rationing (the consumer-rationing criterion), give a reasonably stable and predictable rate level to ratepayers (the rate-level stability and predictability criterion) and ensure fairness to investors (the fairness to investors criterion). While the first four criteria are designed primarily in the interest of the consuming public, the last criterion acts as an equally-important protection for private owners against confiscatory regulation. Its requirement involves determining the return available from the application of the capital to other enterprises of like risk, which demands an understanding of the risk-return relationship in the equity market.
Traditionally, the regulated return has been set through hearings, where arguments on the issue of fairness could be debated. But since the 1990s, numerous boards have adopted an annual mechanism known as a “rate of return formula” or a “rate adjustment formula”. This mechanism determines automatically the allowed rate of return through a calculation that explicitly accounts for the risk-return relationship in the equity market. The use of rate adjustment formulas is particularly prevalent in Canada since the landmark March 1995 decision by the National Energy Board (Decision RH-2-94), which sets the stage for the widespread adoption of closely related formulas by provincial regulators.
Most rate adjustment formulas use a method known as the Equity Risk Premium method.1 This method can be summarized as calculating a utility’s equity rate of
return as the free rate of return plus a premium that reflects its risk. The risk-free rate is usually related to the yield on a long-term government bond. The risk premium is obtained from the Capital Asset Pricing Model (CAPM) of Sharpe (1964) and Lintner (1965), a classic model of capital market equilibrium. It is equal to the utility’s beta, a measure of its systematic risk, multiplied by the market portfolio risk premium. The Equity Risk Premium method has a number of
1 There exist other methods for estimating the rate of return, most notably the Comparable Earnings
advantages. First, it is supported by a solid theoretical foundation in the academic literature, thus providing a sound basis for understanding the risk-return relationship. Second, it can be estimated based on stock returns, thereby making it more objective than other methods, and relating it to current market conditions. Third, it is relatively simple to apply and requires data that can be obtained easily.
The Equity Risk Premium method is not, however, without shortcomings. Arguably its most criticized feature is the use of the CAPM as the basis to determine the risk premium. While the CAPM is one of the most important developments in finance, research over the last forty years has produced a large body of work critical of the model. On the theoretical side, Cochrane (1999) summarizes the current most prevalent academic view: “In retrospect, it is surprising that the CAPM worked so well for so long. The assumptions on which it is built are very stylized and simplified.”2 For example, at least since Merton (1973), it is recognized that
factors, state variables or sources of priced risk beyond the movements in the market portfolio (the only risk factor in the CAPM) might be needed to explain why some risk premiums are higher than others. On the empirical side, the finance literature abounds with CAPM deficiencies (so-called “anomalies”). Fama and French (2004) review this literature to highlight that the CAPM is problematic in the estimation of the risk premium of low-beta firms, small-capitalisation firms and value (or low-growth) firms. While these problems have been well documented in the finance literature, their effects have not yet been fully explored for energy utilities, which may be part of the reasons why the CAPM is still widely used in rate adjustment formulas. In particular, as the CAPM does not empirically provide a valid risk-return relationship for the equity market, it might fall short of the requirement associated with the fairness to investors’ criterion.
Considering the importance of the CAPM in determining the regulated equity rate of return, the objectives of this paper are two-folds. First, we re-examine the use of the model in the context of energy utilities to determine if it is problematic. As utilities are typically low-beta, value-oriented investments, the finance literature suggests that the model will have difficulties in estimating their risk premiums. We analyze the issue empirically by estimating the model and its resulting risk premiums for a sample of Canadian and American energy utilities mostly related to the gas distribution sector, and by testing for the presence of significant differences between the model’s risk premium estimates and the historical ones.
Second, we implement two alternative models that are designed to circumvent some of the empirical problems of the CAPM. The first alternative is a three-factor model proposed by Fama and French (1993) (the Fama-French model hereafter). This model has been used to estimate the cost of equity by Fama and French (1997) for general industrial sectors and by Schink and Bower (1994) for the utilities sector in particular. The second alternative is a modified CAPM that includes the adjustments proposed by Blume (1975) and Litzenberger, Ramaswamy and Sosin (1980) (the Adjusted CAPM hereafter). The Fama-French model and the Adjusted CAPM provide useful comparisons with the CAPM on the estimation of the risk premiums of energy utilities.
Our empirical results can be summarized as follows. First, the CAPM significantly underestimates the risk premiums of energy utilities compared to their
historical values. The underestimations are economically important, with annualized averages of respectively 4.5% and 6.2% for the Canadian and American gas utilities we consider, and are consistent with the finance literature on the mispricing of low-beta, value-oriented stocks. Second, the Fama-French model and the Adjusted CAPM are both able to provide costs of equity that are not significantly different from the historical ones. Our results show that the value premium, in the case of the Fama-French model, and a bias correction, in the case of the Adjusted CAPM, are important in eliminating the CAPM underestimations. Both models suggest average risk premiums between 4% and 8% for gas utilities portfolios, and are relevant at the individual utility level as well as at the utilities sector level.
Overall, we conclude that the CAPM is problematic in estimating econometrically the cost of equity of energy utilities. The Fama-French model and the Adjusted CAPM are well specified for this purpose as they reduce considerably the estimation errors. These models could thus be considered as alternatives to the CAPM in the Equity Risk Premium method employed by regulatory bodies to obtain the risk-return relationship for the fairness to investors’ criterion.
The CAPM dates back to the mid-1960s. While the model is tremendously important, there has been a lot of progress over the last 45 years in the understanding of the cross-section of equity returns. It should be clear that the goals of this paper are not to implement full tests of asset pricing models or examine comprehensively the numerous models in the equity literature. Focusing on energy utilities, this paper is an application of the CAPM and two reasonable and relevant alternatives to the problem of cost of equity estimation, using a standard methodology. Our findings show that it is potentially important to go beyond the CAPM for energy utilities. They represent an invitation to further use the advances in the literature on the cross-section of returns to better understand their equity rate of return.
The rest of the paper is divided as follows. The next section presents our sample of energy utilities and reference portfolios. The third, fourth and fifth sections examine the risk premium estimates with the CAPM, the Fama-French model and the Adjusted CAPM, respectively. Each section provides an overview of the model, presents its empirical estimation and results, and discusses the implications of our findings. The last section concludes.
2.SAMPLE SELECTION AND DESCRIPTIVE STATISTICS
This section examines the sample of firms and portfolios for our estimation of the cost of equity of energy utilities. We focus on the gas distribution sector to present complete sector-level and firm-level results, but we also consider utilities indexes to ensure the robustness to other utilities. We provide Canadian and American results for comparison, as both energy markets are relatively integrated and investors might expect similar returns. We first discuss sample selection issues and then present descriptive statistics.
2.1. Sample Selection
liquidity for numerous securities, non-synchronization of transactions, etc.) in higher frequency data.3 We then annualized our results for convenience. Second, we
emphasize reference portfolios (such as sector indexes) over individual firms. Reference portfolios reduce the potentially large noise (or diversifiable risk) in the stock market returns of individual firms. They allow for an increased statistical accuracy of the estimates, an advantage recognized since (at least) Fama and MacBeth (1973), and alleviate the problem that we do not observe the returns on utilities directly and must rely on utility holding companies.
To represent the gas distribution sector in Canada and the U.S., we use a published index and a constructed portfolio for each market. The independently-calculated published indexes are widely available and consider the entire history of firms having belonged to the gas distribution sector. The constructed portfolios use the most relevant firms at present in the gas distribution or energy utility sector. The data collection also allows an examination of the robustness of our results at the firm level. The resulting four gas distribution reference portfolios are described below:
• DJ_GasDi: A Canadian gas distribution index published by Dow Jones, i.e. the “Dow Jones Canada Gas Distribution Index.” The firms in the index are weighted by their market value. Monthly returns (180) are available from January 1992 to December 2006;
• CAindex: An equally-weighted constructed portfolio formed of 13 Canadian energy utilities, most with activities that are related to the gas distribution sector, i.e. ATCO Ltd., Algonquin Power Income Fund, Canadian Utilities Limited, EPCOR Power, Emera Incorporated, Enbridge Inc., Fort Chicago Energy Partners, Fortis Inc., Gaz Métro Limited Partnership, Northland Power Income Fund, Pacific Northern
Gas, TransAlta Corporation and TransCanada Pipelines.4 Monthly
returns (263) are available from February 1985 to December 2006;
• DJ_GasUS: A U.S. gas distribution index published by Dow Jones, i.e. the “Dow Jones US Gas Distribution Index.” The firms in the index are weighted by their market value. Monthly returns (180) are available from January 1992 to December 2006;
• USindex: An equally-weighted constructed portfolio formed of nine U.S. firms whose activities are heavily concentrated in local gas distribution, i.e. AGL Resources Inc., Atmos Energy Corp., Laclede Group, New Jersey Resources Corp., Northwest Natural Gas Co., Piedmont Natural Gas Co., South Jersey Industries, Southwest Gas Corp. and WGL Holdings Inc. Monthly returns (407) are available from February 1973 to December 2006.
3 See Fowler, Rorke and Jog (1979, 1980) for an analysis of these problems in the Canadian stock
markets.
4 We also considered AltaGas Utility Group, Enbridge Income Fund, Westcoast Energy, Nova Scotia
To confirm the validity of our analysis to other energy utilities, we also consider four utilities reference portfolios, which consist of the utilities sector indexes described below:
• DJ_Util: A Canadian utilities index published by Dow Jones, i.e. the “Dow Jones Canada Utilities Index.” The firms in the index are weighted by their market value. Monthly returns (180) are available from January 1992 to December 2006;
• TSX_Util: A Canadian utilities index published by S&P/TSX, i.e. the “S&P/TSX Utilities Index.” The firms in the index are weighted by their market value. Monthly returns (228) are available from January 1988 to December 2006;
• DJ_UtiUS: A U.S. utilities index published by Dow Jones, i.e. the “Dow Jones US Utilities Index.” The firms in the index are weighted by their market value. Monthly returns (180) are available from January 1992 to December 2006;
• FF_Util: A U.S. utilities index formed by Profs. Fama and French, or the University of Chicago and Dartmouth College, respectively. The firms in the index are weighted by their market value. Monthly returns (407) are available from February 1973 to December 2006.
Depending on their availability, the reference portfolio series have different starting dates. In our econometric estimation, we keep the maximum number of observations for each series. Fama and French (1997) find that such a choice results in costs of equity more precisely estimated and with more predictive ability than costs of equity obtained from rolling five-year estimation windows, a common choice in practice. The data are collected from the Canadian Financial Markets
Research Center (CFMRC), Datastream and the web sites of Prof. French5 and
Dow Jones Indexes6.
2.2. Descriptive Statistics
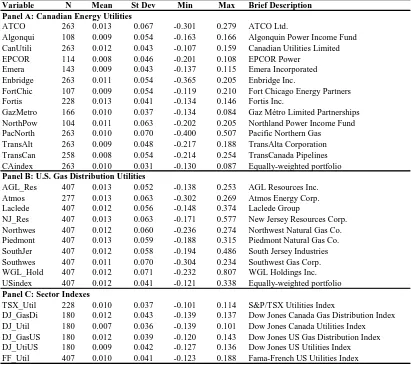
Descriptive statistics for the monthly returns are presented in Table 1. Panel A shows the results for the 13 Canadian energy utilities and their equally-weighted portfolio (CAindex). Panel B shows the results for nine U.S. gas distribution utilities and their equally-weighted portfolio (USindex). Panel C shows the statistics for Canadian and U.S. indexes for the utilities sector (DJ_Util, DJ_UtilUS, TSX_Util and FF_Util) and the gas distribution sub-sector (DJ_GasDi and DJ_GasUS).7
5 http://mba.tuck.dartmouth.edu/pages/faculty/ken.french/data_library.html.
6http://www.djindexes.com/mdsidx/index.cfm?event=showtotalMarketIndexData&perf=Historical%20Values 7 The returns from August to November 2001 of the Dow Jones U.S. indexes are strongly influenced by the
TABLE 1
Descriptive Statistics of Monthly Returns
NOTES: This table presents descriptive statistics on the monthly returns of 13 Canadian utilities and their equally-weighted portfolio (CAindex) in Panel A, of nine U.S. gas distribution utilities and their equally-weighted portfolio (USindex) in Panel B, and on selected utilities sector indexes in Panel C. The columns labelled N, Mean, St Dev, Min and Max correspond respectively to the number of observations, the mean, the standard deviation, the minimum value and the
maximum value. The column labelled Brief Description gives the full name of the utility holding companies or the utilities sector indexes.
For the Canadian energy utilities, the monthly average return of all 13 firms is 1.0% with a standard deviation of 3.1%. The Dow Jones Canada Gas Distribution Index, the Dow Jones Canada Utilities Index and the S&P/TSX Utilities Index have mean returns of 1.2%, 0.7% and 1.0%, respectively. The monthly average return of the nine U.S. gas distribution utilities is 1.2% with a standard deviation of 4.1%. The Dow Jones US Gas Distribution Index, the Dow Jones US Utilities Index and the Fama-French U.S. Utilities Index show mean returns of 1.2%, 0.9% and 1.0%, respectively. Correlations between the four gas distribution reference portfolios (not tabulated) are between 0.29 and 0.80. These correlations indicate that the portfolios
Variable N Mean St Dev Min Max Brief Description Panel A: Canadian Energy Utilities
ATCO 263 0.013 0.067 -0.301 0.279 ATCO Ltd.
Algonqui 108 0.009 0.054 -0.163 0.166 Algonquin Power Income Fund CanUtili 263 0.012 0.043 -0.107 0.159 Canadian Utilities Limited EPCOR 114 0.008 0.046 -0.201 0.108 EPCOR Power
Emera 143 0.009 0.043 -0.137 0.115 Emera Incorporated Enbridge 263 0.011 0.054 -0.365 0.205 Enbridge Inc.
FortChic 107 0.009 0.054 -0.119 0.210 Fort Chicago Energy Partners Fortis 228 0.013 0.041 -0.134 0.146 Fortis Inc.
GazMetro 166 0.010 0.037 -0.134 0.084 Gaz Métro Limited Partnerships NorthPow 104 0.011 0.063 -0.202 0.205 Northland Power Income Fund PacNorth 263 0.010 0.070 -0.400 0.507 Pacific Northern Gas
TransAlt 263 0.009 0.048 -0.217 0.188 TransAlta Corporation TransCan 258 0.008 0.054 -0.214 0.254 TransCanada Pipelines CAindex 263 0.010 0.031 -0.130 0.087 Equally-weighted portfolio
Panel B: U.S. Gas Distribution Utilities
AGL_Res 407 0.013 0.052 -0.138 0.253 AGL Resources Inc. Atmos 277 0.013 0.063 -0.302 0.269 Atmos Energy Corp. Laclede 407 0.012 0.056 -0.148 0.374 Laclede Group
NJ_Res 407 0.013 0.063 -0.171 0.577 New Jersey Resources Corp. Northwes 407 0.012 0.060 -0.236 0.274 Northwest Natural Gas Co. Piedmont 407 0.013 0.059 -0.188 0.315 Piedmont Natural Gas Co. SouthJer 407 0.012 0.058 -0.194 0.486 South Jersey Industries Southwes 407 0.011 0.070 -0.304 0.234 Southwest Gas Corp. WGL_Hold 407 0.012 0.071 -0.232 0.807 WGL Holdings Inc. USindex 407 0.012 0.041 -0.121 0.338 Equally-weighted portfolio
Panel C: Sector Indexes
TSX_Util 228 0.010 0.037 -0.101 0.114 S&P/TSX Utilities Index
show some commonality, but are not perfect substitutes. We next start our analysis of the equity risk premium models.
3.EQUITY RISK PREMIUM WITH THE CAPM
This section examines the use of the Capital Asset Pricing Model (CAPM) for estimating the rate of return for energy utilities. The CAPM is the model the most often associated with the Equity Risk Premium method that is the basis of the rate adjustment formulas of regulatory bodies. We first present the model and its relevant literature. Then we estimate the model for our sample of energy utilities. Finally, we discuss the implications of our findings.
3.1. Model and Literature
The CAPM is a model proposed by Sharpe (1964) and Lintner (1965) in which the expected equity return or cost of equity for a gas utility is given by
(
RGAS)
Rf mE = +β×λ ,
whereRf is the risk-free rate,β is the firm’s beta or sensitivity to the market
returns andλmis the market risk premium. In this model, a higher beta results in a
higher risk premium.
The CAPM is the best known model of expected return. In spite of its undeniable importance in the field of finance, it has long been rejected by numerous empirical tests in the academic literature. The empirical rejections start with the first tests (Black, Jensen and Scholes, 1972, Fama and MacBeth, 1973, and Blume and Friend, 1973) that find that the relation between beta and average return is flatter than predicted by the model. They continue with the discovery of numerous “anomalies” (like the price-to-earnings effect of Basu, 1977, the size effect of Banz, 1981, etc.). Finally, in the 1990s, based on high-impact articles, including Fama and French (1992, 1993, 1996a and 1996b), Jegadeesh and Titman (1993) and Jagannathan and Wang (1996), the academic profession reaches a relative consensus that the CAPM is not valid empirically. In Canada, like elsewhere in the world, the literature reaches similar conclusions (see Morin, 1980, Bartholdy, 1993, Bourgeois and Lussier, 1994, Elfakhani, Lockwood and Zaher, 1998, L’Her, Masmoudi and Suret, 2002, 2004.).
A complete review of the literature on the problems of the CAPM is beyond the scope of this paper. It is nevertheless important to point out the two characteristics of energy utilities that suggest the CAPM might be problematic in estimating their equity return. First, energy utilities have typically low betas, significantly below one. Second, they are known as value investments, in the sense that they have high earnings-to-price, book-to-market, cash flows-to-price or dividend-to-price ratios.
In a summary article requested for a symposium on the 40th anniversary of the
CAPM, Fama and French (2004) highlight the result of using the model to estimate the cost of equity capital for firms with these two characteristics:
high book-to-market ratios) imply high expected returns, CAPM cost of equity estimates for such stocks are too low.”8
As Fama and French (2004) indicate, the low-beta and value characteristics of energy utilities will probably lead the CAPM to estimate a rate of return that is too low. We next examine whether this undervaluation in fact exists in our sample of reference portfolios and utilities.
3.2. Risk Premium Estimates
This section empirically estimates the risk premium with the CAPM using the
previously described Canadian and U.S. monthly data.9 More specifically, we
estimate the model using the time-series regression approach pioneered by Black, Jensen and Scholes (1972) with the following equation:
t GAS t m GAS
t f t
GAS R
R , − , =α +β×λ , +ε , ,
whereλm,t =Rm,t −Rf,tis the return on the market portfolio in excess of the
risk-free return andεGAS,tis the mean-zero regression error, at time t. In this equation,
the CAPM predicts that the alpha (or intercept) is zero (αGAS =0) and the risk
premium is E
(
RGAS,t −Rf,t)
=β×E( )
λm,t . An alpha different from zero can beinterpreted as the risk premium error of the CAPM (see Pastor and Stambaugh, 1999). A positive alpha indicates the CAPM does not prescribe a large enough risk premium compared to its historical value (an underestimation), whereas a negative alpha indicates the CAPM prescribes a risk premium that is too large (an overestimation). It is therefore possible to determine the CAPM risk premium error for energy utilities based on the estimates of the alpha.10
We use Hansen’s (1982) Generalized Method of Moments technique in order to
estimate jointly the parametersαGAS andβof the model and the market risk
premiumE
( )
λm,t . As Cochrane (2001, Section 12.1) shows, this method has thenecessary flexibility to correct the results for possible econometric problems in the
8 Fama and French (2004), p. 43-44.
9 Our focus is on the estimation of the equity risk premium for energy utilities. To obtain their full
cost of equity, we would need to add an appropriate risk-free rate, which could depend on the circumstances. For example, one common choice advocates adding to their equity risk premium the yield on a long-term government bond. But other choices for an appropriate risk-free rate are possible.
10 The time series regression approach is commonly used when the model factors are returns.
data.11 We take the monthly returns on portfolios of all listed securities weighted by
their market value for the market portfolio returns and on the Treasury bills for the risk-free returns.12 The annualized mean market risk premiums are 5.2% for Canada
from February 1985 to December 2006 and 6.0% for the U.S. from February 1973 to December 2006.
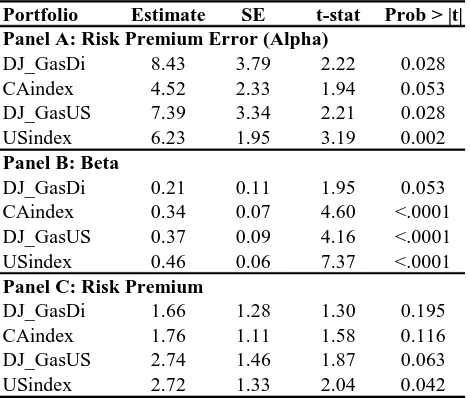
Table 2 shows the results of the regressions using each of the four gas distribution reference portfolios. The estimates of the annualized risk premium error (or annualizedαGAS), the betaβ and the risk premium β×E
( )
λm,t arepresented in Panels A, B and C, respectively. For each estimate, the table also shows its standard error, t-statistic and associated p-value.
TABLE 2
CAPM Risk Premium Estimates for the Gas Distribution Reference Portfolios
NOTES: This table reports the results of the estimation of the CAPM for the gas distribution reference portfolios. Panels A to C look at the annualized risk premium error or alpha (in percent), the market beta and the annualized risk premium (in percent), respectively. The columns labelled Estimate, SE, t-stat and Prob > |t| give respectively the estimates, their standard errors, their t-statistics and their p-values. The four gas distribution reference portfolios and their sample are described in section 2 and table 1. The annualized mean market risk premiums for their corresponding sample period are 8.1% for DJ_GasDi, 5.2% for CAindex, 7.5% for DJ_GasUS and 6.0% for USindex.
The estimates in Panel A of Table 2 indicate that the risk premium errors are positive. Hence, the CAPM underestimates the risk premium for the gas distribution reference portfolios. The underestimation is not small – a minimum of 4.52% (for CAindex) and a maximum of 8.43% (for DJ_GasDi) – and is statistically greater than zero for all portfolios. Also, as expected, the underestimation comes with low
11 All standard errors and statistical tests have been estimated using the Newey and West (1987)
method, which takes account of the potential heteroscedasticity and autocorrelation in the errors of the statistical models.
12 The data sources are CFMRC (until 2004) and Datastream (thereafter) for the Canadian returns
and the web site of Prof. French for U.S. returns.
Portfolio Estimate SE t-stat Prob > |t| Panel A: Risk Premium Error (Alpha)
DJ_GasDi 8.43 3.79 2.22 0.028 CAindex 4.52 2.33 1.94 0.053 DJ_GasUS 7.39 3.34 2.21 0.028 USindex 6.23 1.95 3.19 0.002
Panel B: Beta
DJ_GasDi 0.21 0.11 1.95 0.053 CAindex 0.34 0.07 4.60 <.0001 DJ_GasUS 0.37 0.09 4.16 <.0001 USindex 0.46 0.06 7.37 <.0001
Panel C: Risk Premium
beta estimates, with values between 0.21 and 0.46 in Panel B. For example, for CAindex, the beta is 0.34 and the annualized risk premium predicted by the CAPM is 1.76%, an underestimation of the historical risk premiumαGAS =4.52%.
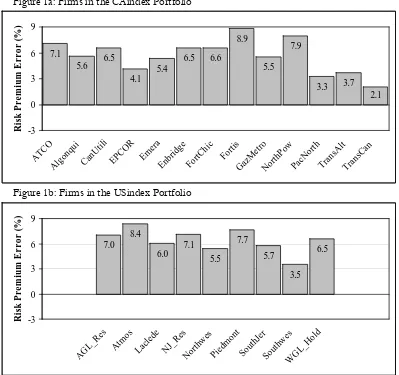
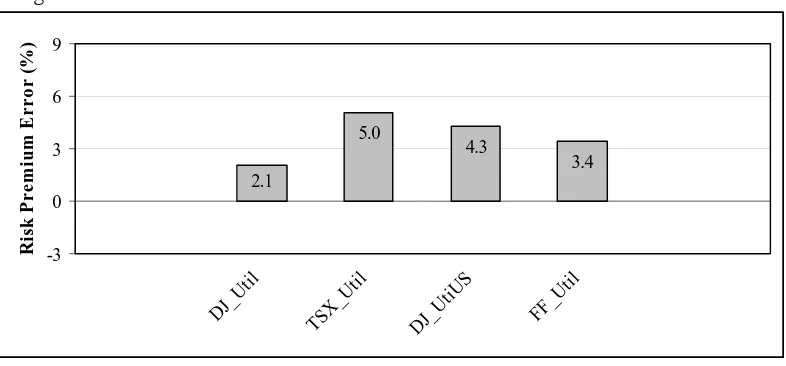
To verify the underestimation is not an artifact of the utilization of the reference portfolios and is robust to other energy utilities, Figure 1 shows the risk premium errors for the utilities that make up the CAindex portfolio (Figure 1a), the gas distributors in the USindex portfolios (Figure 1b) and the four utilities reference portfolios (Figure 1c). Once again, the alphas are always positive, with values between 2.1% and 8.9% for the Canadian utilities, between 3.5% and 8.4% for the U.S. gas distributors, and between 2.1% and 5.0% for the utilities reference portfolios. The constantly positive and often significant errors support the notion that the CAPM might not be appropriate for determining the risk premium in the utilities sector.
FIGURE 1
Risk Premium Errors with the CAPM for Various Utilities
Figure 1a: Firms in the CAindex Portfolio
Figure 1b: Firms in the USindex Portfolio 7.1 5.6 6.5 4.1 5.4 6.5 6.6 8.9 5.5 7.9 3.3 3.7 2.1 -3 0 3 6 9 ATC O Alg onqu i CanU tili EPC OR Em era Enbr idge FortCh ic For tis GazM etro Nor thP ow PacN orth Tran sAlt Tran sCan R is k P rem iu m E rro r (% ) 7.0 8.4 6.0 7.1 5.5 7.7 5.7 3.5 6.5 -3 0 3 6 9 AGL
Figure 1c: Utilities Reference Portfolios
NOTES: This figure shows the annualized risk premium errors (or alphas) with the CAPM for the Canadian utilities in the CAindex portfolio (Figure 1a), the U.S. gas distributors in the USindex portfolio (Figure 1b) and the utilities reference portfolios (Figure 1c).
3.3. Discussion
Our results show that the CAPM underestimates the risk premium for the gas distribution sub-sector in particular and for the utilities sector in general. This finding is consistent with the empirical literature that finds that the CAPM tends to underestimate the risk premium of securities or sectors associated with low-beta, value and small-cap investments. In the terminology of asset pricing, the returns on energy utilities are “anomalous” with respect to the CAPM. As the application of the model would not be sensible in evaluating the performance of value-type mutual funds, given the related anomaly, it could be unwarranted in evaluating the cost of equity for energy utilities.
While the magnitude of the underestimation for the utilities is large, it is not unexpected. Fama and French (2004) review the evidence on the large CAPM literature for the full cross-section of equity returns. Their figures 2 and 3, in particular, illustrate well the findings for portfolios of stocks formed on their beta and their book-to-market ratio value indicator, respectively. In the cross-section of all stock returns, their figure 2 show visually that the CAPM underestimation is about 3% for the lowest beta portfolio (a beta of about 0.6), while its overestimation is about 3% for the highest beta portfolio (a beta of about 1.8). Their figure 3 indicates that the CAPM underestimation is about 5% for the highest book-to-market ratio portfolio, while its overestimation is about 2% for the lowest book-to-market ratio portfolio. As energy utilities are low-beta and value-oriented stocks, our estimates of the CAPM underestimation for this segment are consistent with the evidence from the full cross-section of equity returns.
Our results are related to numerous studies documenting that the CAPM alphas are different from zero. As a consequence of these rejections, finance researchers have considered various models that generalized the CAPM as well as various empirical improvements to the estimates of the CAPM. Based on this literature, we explore two alternative ways of estimating the risk premium of energy utilities in the next two sections.
2.1
5.0
4.3
3.4
-3 0 3 6 9
DJ_ Util
TSX_ Util
DJ_U tiUS
FF_U til
R
is
k
P
rem
iu
m
E
rro
r (
%
4.EQUITY RISK PREMIUM WITH THE FAMA-FRENCH MODEL
The CAPM claims that a single factor, the market portfolio return, can explain expected returns. The most natural extension is to take multiple factors into account. Clearly, if factors other than the market return have positive risk premiums that contribute to explaining expected returns, then the inclusion of those factors should provide a better estimate of the risk premium and potentially eliminate the CAPM errors (see Merton, 1973, and Ross, 1976, for formal theoretical justifications). This section considers one of the most common generalization of the CAPM, a multifactor model by Fama and French (1993). We first describe the model and then use it to estimate the risk premium of energy utilities. We finally discuss the interpretation of our findings.
4.1. Model and Literature
The Fama-French model is a three-factor model developed to capture the anomalous returns associated with small-cap, value and growth portfolios by including risk premiums for size and value. For a gas utility, the expected equity return is given by
(
RGAS)
Rf m SIZE SIZE VALUE VALUEE = +β×λ +β ×λ +β ×λ ,
whereRf is the risk-free rate,β,βSIZEandβVALUE are respectively the firm’s
market, size and value betas, andλm,λSIZEandλVALUE are respectively the market,
size and value risk premiums. The three betas represent sensitivities to the three sources of risk, and the higher are their values, the higher is a firm’s risk premium. In cases when the size and value risk factors are not relevant, then the Fama-French model reduces to the CAPM. Theoretical justifications for the size and value premiums are provided by Berk, Green and Naik (1999), Gomez, Kogan and Zhang (2003), and Carlson, Fisher and Giammarino (2004). Fama and French (1993, 1996a) are the two of the most influential empirical tests of the model.
Like the CAPM, the Fama-French model has been used in applications ranging from performance measurement to abnormal return estimation and asset valuation. For the calculation of the cost of equity capital, the model is studied by, among others, Schink and Bower (1994), Fama and French (1997), and Pastor and Stambaugh (1999). It has also proven to be relevant for explaining stock market returns in most countries where it has been examined. For example, in Canada, the model is validated by Elfakhani, Lockwood and Zaher (1998) and L’Her, Masmoudi and Suret (2002). Given that energy utilities are associated with value investments, the Fama-French model has the potential to improve the estimation of their rates of returns. We next assess this possibility for our sample of reference portfolios and utilities.
4.2. Risk Premium Estimates
t GAS t VALUE VALUE
t SIZE SIZE t
m FF
GAS t
f t
GAS R
R , − , =α +β×λ , +β ×λ , +β ×λ , +υ , ,
whereλm,t =Rm,t −Rf,t is the return on the market portfolio in excess of the
risk-free return, λSIZE,t =RSMALL,t −RLARGE,tis the return on a small-cap portfolio in
excess of the return on a large-cap portfolio,λVALUE,t =RVALUE,t −RGROWTH,tis the
return on a value portfolio in excess of the return on a growth portfolio andυGAS,tis
the mean-zero regression error, at time t. The alpha FF GAS
α is still interpreted as the risk premium error. The three beta parameters give the sensitivities to the market, size and value factors. Finally,β×E
( )
λm,t +βSIZE ×E(
λSIZE,t)
+βVALUE ×E(
λVALUE,t)
represents the risk premium from the Fama-French model.
The data for the market portfolio returns and the risk-free returns are the same used in the CAPM estimation. For the Canadian regressions, the small-cap portfolio returns are from a portfolio of all listed securities weighted equally whereas the large-cap portfolio returns are from a portfolio of all listed securities weighted by
their market value.13 The value and growth portfolios are determined from the
earnings-to-price ratio. Specifically, the value (growth) portfolio contains firms having an earnings/price ratio in the highest (lowest) 30%.14 For U.S. regressions,
the size and value premiums are the Fama and French (1993, 1996a) SMB and HML variables, which are computed from market capitalization (size) and book-to-market ratio (value).15 The annualized mean size and value risk premiums are respectively
8.9% and 6.4% for Canada from February 1985 to December 2006 and 2.7% and 6.0% for the U.S. from February 1973 to December 2006.
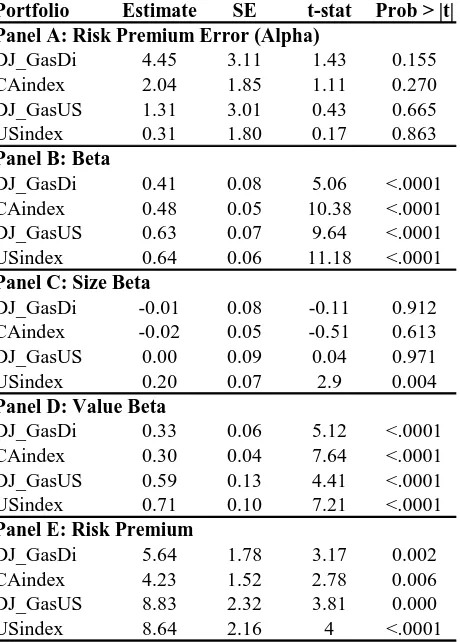
Table 3 presents the results of the estimates of the coefficients and the risk premium with the Fama-French model for the four gas distribution reference portfolios previously described. Panel A shows that the annualized risk premium errors are still positive for the four portfolios, ranging from 0.31% (for USindex) to 4.45% (for DJ_GasDi), but the underestimation is now statistically negligible. Panel D confirms that the inclusion of the value risk premium is instrumental in the reduction of the errors. The value betas are highly significant, with values between 0.30 and 0.71. The size betas (Panel C) are low and often not statistically different from zero, whereas the market betas (Panel B) are 0.54 on average. The estimated risk premiums vary between 4.23% and 8.83%.
13 These indexes are taken from CFMRC for returns up to 2004 and then completed by the returns
of the S&P/TSX Composite Index and the MSCI Barra Smallcap Index, respectively.
14 Data come from the web site of Prof. French, who also provides specific instructions on the
composition of the portfolios. The site gives returns for value and growth portfolios based on four indicators – earnings-to-price, book-to-market, cash flows-to-price and dividend-to-price. Fama and French (1996a) show that these indicators contain the same information about expected returns. Fama and French (1998) confirm the relevance of these indicators in explaining the returns in 12 major international financial markets and emerging financial markets. We chose the earnings-to-price indicator because it is more effective in capturing the premium of value securities compared to growth securities in Canada (see Bartholdy, 1993, and Bourgeois and Lussier, 1994). The indicator book-to-market is less effective in Canada because the value effect is mainly concentrated in more extreme portfolios (highest and lowest 10%) than in those available on the site (see L’Her, Masmoudi and Suret, 2002).
15 Data again come from the web site of Prof. French. Detailed instructions on the composition of
TABLE 3
Fama-French Risk Premium Estimates for the Gas Distribution Reference Portfolios
NOTES: This table reports the results of the estimation of the Fama-French model for the gas distribution reference portfolios. Panels A to E look at the annualized risk premium error or alpha (in percent), the market beta, the size beta, the value beta and the annualized risk premium (in percent), respectively. The columns labelled Estimate, SE, t-stat and Prob > |t| give respectively the estimates, their standard errors, their t-statistics and their p-values. The four gas distribution reference portfolios and their sample are described in section 2 and table 1. The annualized mean market risk premiums for their corresponding sample period are 8.1% for DJ_GasDi, 5.2% for CAindex, 7.5% for DJ_GasUS and 6.0% for USindex. The annualized mean size risk premiums for their corresponding sample period are 12.4% for DJ_GasDi, 8.9% for CAindex, 2.7% for DJ_GasUS and 2.7% for USindex. The annualized mean value risk premiums for their corresponding sample period are 7.4% for DJ_GasDi, 6.4% for CAindex, 6.9% for DJ_GasUS and 6.0% for USindex.
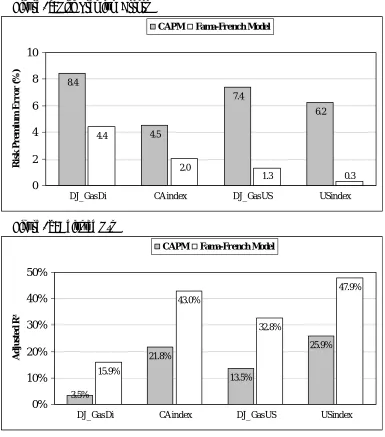
Figure 2 compares the Fama-French and CAPM results. Figure 2a illustrates the risk premium errors of the two models, while Figure 2b shows their explanatory power given by the adjusted R2. The errors have substantially fallen with the
Fama-French model for all reference portfolios. Furthermore, the Fama-Fama-French model explains a much larger proportion of the variation in the reference portfolio returns.
Portfolio Estimate SE t-stat Prob > |t| Panel A: Risk Premium Error (Alpha)
DJ_GasDi 4.45 3.11 1.43 0.155 CAindex 2.04 1.85 1.11 0.270 DJ_GasUS 1.31 3.01 0.43 0.665 USindex 0.31 1.80 0.17 0.863
Panel B: Beta
DJ_GasDi 0.41 0.08 5.06 <.0001 CAindex 0.48 0.05 10.38 <.0001 DJ_GasUS 0.63 0.07 9.64 <.0001 USindex 0.64 0.06 11.18 <.0001
Panel C: Size Beta
DJ_GasDi -0.01 0.08 -0.11 0.912 CAindex -0.02 0.05 -0.51 0.613 DJ_GasUS 0.00 0.09 0.04 0.971 USindex 0.20 0.07 2.9 0.004
Panel D: Value Beta
DJ_GasDi 0.33 0.06 5.12 <.0001 CAindex 0.30 0.04 7.64 <.0001 DJ_GasUS 0.59 0.13 4.41 <.0001 USindex 0.71 0.10 7.21 <.0001
Panel E: Risk Premium
FIGURE 2
Comparison of the Fama-French and CAPM Results Figure 2a: Risk Premium Errors
Figure 2b: Adjusted R²s
NOTES: This figure compares the results of the CAPM (gray bars) and the Fama-French model (white bars) in terms of annualized risk premium errors (or alphas) (Figure 2a) and adjusted R² (Figure 2b) for the gas distribution reference portfolios.
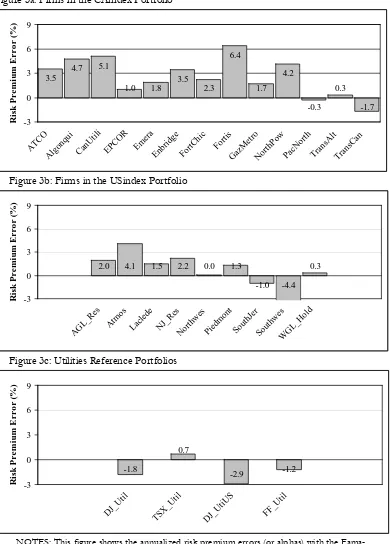
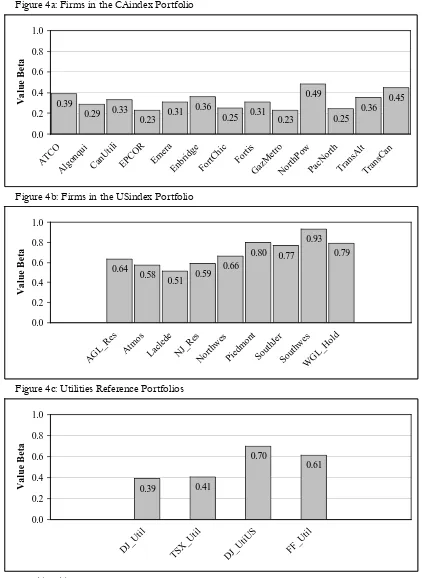
Figures 3 and 4 present the risk premium errors and the value betas, respectively, for the utilities that make up the CAindex portfolios (Figures 3a and 4a), the gas distributors in the USindex portfolios (Figures 3b and 4b) and the four utilities reference portfolios (Figures 3c and 4c). A comparison of Figure 3 with Figure 1 shows that the risk premium errors have decreased in all cases. None of the errors are now significantly different from zero. Figure 4 confirms that the reductions in the risk premium errors are caused by the inclusion of the value risk premium. All value betas are greater than 0.23 and statistically significant. For example, the TSX_Util portfolio has a value beta of 0.41 that contributes to reduce its risk premium error from 5.0% with the CAPM to 0.7% with the Fama-French model.
8.4
4.5
7.4
6.2 4.4
2.0
1.3 0.3
0 2 4 6 8 10
DJ_GasDi CAindex DJ_GasUS USindex
R
is
k
P
remi
u
m
Er
ro
r (
%
)
CAPM Fama-French Model
3.5%
21.8%
13.5%
25.9%
15.9%
43.0%
32.8%
47.9%
0% 10% 20% 30% 40% 50%
DJ_GasDi CAindex DJ_GasUS USindex
Ad
ju
st
e
d
R
²
FIGURE 3
Risk Premium Errors with the Fama-French Model for Various Utilities Figure 3a: Firms in the CAindex Portfolio
Figure 3b: Firms in the USindex Portfolio
Figure 3c: Utilities Reference Portfolios
NOTES: This figure shows the annualized risk premium errors (or alphas) with the Fama-French model for the Canadian utilities in the CAindex portfolio (Figure 3a), the U.S. gas distributors in the USindex portfolio (Figure 3b) and the utilities reference portfolios (Figure 3c). 3.5 4.7 5.1 1.0 1.8 3.5 2.3 6.4 1.7 4.2 -0.3 0.3 -1.7 -3 0 3 6 9 AT CO Algo nqu i Can Util i EPCO R Em era Enbr idg e FortC hic For tis GazM etro North Pow PacN orth Tran sAl t Tra nsCan R is k P r e m iu m E r ro r ( % )
2.0 4.1 1.5 2.2 0.0 1.3
-1.0 -4.4 0.3 -3 0 3 6 9 AG L_R es Atm os Lacle de NJ_Re s Northw es Pied mo nt Sout hJer Sout hwes WG L_H old R is k P r e m iu m E r ro r ( % ) -1.8 0.7 -2.9 -1.2 -3 0 3 6 9 DJ_U til TSX _Util DJ_
FIGURE 4
Value Betas for Various Utilities Figure 4a: Firms in the CAindex Portfolio
Figure 4b: Firms in the USindex Portfolio
Figure 4c: Utilities Reference Portfolios
NOTES: This figure shows the value betas in the Fama-French model for the Canadian utilities in the CAindex portfolio (Figure 4a), the U.S. gas distributors in the USindex portfolio (Figure 4b) and the utilities reference portfolios (Figure 4c).
0.39
0.29 0.33
0.23 0.31 0.36
4.3. Discussion
Our results support the notion that the Fama-French model is well suited to estimate the risk premium for energy utilities, consistent with the findings of Schink and Bower (1994). We obtain lower risk premium errors with the Fama-French model than with the CAPM and significant value betas, similar to the results reported by Schink and Bower (1994), Fama and French (1997) and Pastor and Stambaugh (1999).
While the model is being increasingly considered in practice, an often mentioned limitation is that the economic interpretation of the size and value premiums is still under debate. On one side, starting with Fama and French (1993), the size and value factors are presented as part of a rational asset pricing model, where they reflect either state variables that predict investment opportunities following the theory of Merton (1973), or statistically useful variables to explain the returns following the theory of Ross (1976). On the other side, as first advocated by Lakonishok, Shleifer and Vishny (1994), the size and value factors are thought to be related to investors’ irrationality in the sense that large-cap and growth stocks tend to be glamorized whereas small-cap and value stocks tend to be neglected. There is a vast literature on both sides of this debate.16
While the debate is important to improve our understanding of capital markets, Stein (1996) demonstrates that the theoretical interpretation of the model is not relevant to its application to determine the cost of capital. On one side, if the Fama-French model is rational, then the size and value factors capture true risks and should be accounted for in the risk premiums of energy utilities. On the other side, if the size and value factors are irrational, then the significant value betas of energy utilities indicate that they are neglected or undervalued firms. In this case, Stein (1996) shows that rational firms should not undertake a project that provides an expected return lower than the return estimated by the potentially irrational Fama-French model. They are better off in rejecting the project and simply buying back their own shares for which they expect an inflated future return because of the undervaluation. Thus, the potentially irrational Fama-French estimates serve as the appropriate hurdle rate for project investments. Hence, for both interpretations, the equity cost of capital of energy utilities generated by the Fama-French model is a useful guideline of a fair rate of return for regulators.
Arguably, the Fama-French model is one of the most widely used models of expected returns in the academic finance literature (Davis, 2006). Nevertheless, the literature on the cross-section of equity returns has identified numerous other factors that could be relevant in the multifactor approach. For examples, other influential factors include the labor income factor of Jagannathan and Wang (1996), the momentum factor of Jegadeesh and Titman (1993) and Carhart (1997), the liquidity factor of Pastor and Stambaugh (2003) and the idiosyncratic volatility factor of Ang et al. (2006, 2009). These advances in the literature on the cross-section of returns could eventually lead to a better understanding of the equity risk premium
16 A third interpretation, following Lo and MacKinlay (1990) and Kothari, Shanken and Sloan (1995),
for energy utilities.17 The next section looks at a second approach that goes beyond
the CAPM to estimate the equity risk premium.
5.EQUITY RISK PREMIUM WITH THE ADJUSTED CAPM
This section considers two empirical adjustments to the CAPM estimates proposed in the academic literature to account for their deficiencies. We call the CAPM with the addition of the two modifications the “Adjusted CAPM”. Unlike the CAPM and the Fama-French model, the Adjusted CAPM is not an equilibrium model of expected returns. It contains adjustments to the CAPM that are empirically justified in a context where the known difficulties of a theoretical model need to be lessened for improved estimation. We first introduce the Adjusted CAPM. Then we implement it to estimate the risk premium of energy utilities. We finally offer a brief discussion of our findings.
5.1. Model and Literature
The Adjusted CAPM is based on the CAPM but provides more realistic estimates of the rate of return by considering the empirical problems of the CAPM. More specifically, the Adjusted CAPM is a model in which the expected equity return of a gas utility is arrived at by
(
)
(
)
mAdj Adj
GAS f
GAS R
R
E = +α × 1−β +β ×λ .
Compared to the CAPM, this equation incorporates a modification to take into account that estimated betas can be adjusted for better predictive power and a modification to take account of the fact the alpha (risk premium error) is high for low-beta value-oriented firms in the CAPM.
The first modification originates from the works of Blume (1971, 1975). Blume (1971) examines historical portfolio betas over two consecutive periods and finds that the historical betas, from one period to another, regress towards one, the average of the market. He also shows that the historical betas adjusted towards one predict future betas better than unadjusted betas. Blume (1975) builds a historical beta adjustment model to capture the tendency to regress towards one. He discovers
that the best adjustment is to use a beta equal to + ×βHis
677 . 0 343 .
0 , a finding that
led to the concept of “adjusted beta”. Merrill Lynch, which popularized the use of adjusted betas based on Blume (1975)’s results, advocates the adjustment
His
Adj β
β =0.333+0.667× . Merrill Lynch’s adjusted beta, now widely used in
practice, represents a weighted-average between the beta of the market and the historical beta, with a two-thirds weighting on the historical beta.
The second adjustment is initially proposed by Litzenberger, Ramaswamy and Sosin (1980), who consider solutions to the problem that the CAPM gives a cost of equity capital with a downward bias for low beta firms, as discussed in section 3.1. They note that one way of remedying the problem is to add a bias correction to the CAPM risk premium. To be effective, the correction must take account of the
17 Some of the documented effects, like momentum, are short-lived. Hence, their related factor might
importance of the risk premium error and the level of the firm’s beta because these two elements influence the magnitude of the problem. To do this for low beta securities, Litzenberger, Ramaswamy and Sosin (1980) propose the bias correction
(
β)
αGAS × 1− . As desired, the correction increases with the risk premium error of
the CAPM, and decreases with the beta. The correction is nil for a firm for which the CAPM already works well (whenαGAS =0) or for a firm having a beta of one,
two cases where the CAPM produces a fair rate of return on average. Morin (2006, Section 6.3) presents an application of this adjustment in regulatory finance through a model he calls the empirical CAPM.
In summary, the two modifications incorporated in the Adjusted CAPM involve first using the adjusted beta instead of the historical beta and second including the bias correction in the risk premium calculation. Considering the documented usefulness of the two adjustments, the Adjusted CAPM has the potential to estimate a reasonable risk premium for the energy utilities.
5.2. Risk Premium Estimates
To compute the Adjusted CAPM estimates for our utilities, the starting point is the estimates of the CAPM of Section 3.2, given in Table 2. The beta estimates are now understood as the unadjusted historical betasβHis
. The gas utility risk premium with the Adjusted CAPM can then be expressed as
(
)
( )
mtAdj Adj
GAS 1 β β E λ ,
α × − + × ,
where βAdj = + ×βHis
667 . 0 333 .
0 . The Adjusted CAPM risk premium error is
arrived at by
(
)
[
(
)
( )
mt]
Adj Adj
GAS t
f t GAS Adj
GAS E R , R , α 1 β β E λ ,
α = − − × − + × .
Table 4 shows the Adjusted CAPM estimates using the four gas distribution reference portfolios. The estimates of the risk premium error Adj
GAS
α , the adjusted beta
Adj
β , the bias correction
(
Adj)
GAS β
α ×1− and the risk premium are shown in Panels
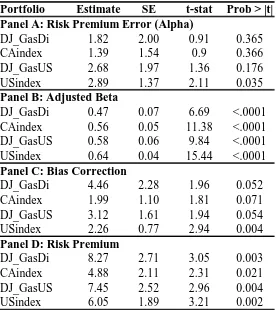
TABLE 4
Adjusted CAPM Risk Premium Estimates for the Gas Distribution Reference Portfolios
NOTES: This table reports the results of the estimation of the Adjusted CAPM for the gas distribution reference portfolios. Panels A to D look at the annualized risk premium error or alpha (in percent), the adjusted market beta, the bias correction and the annualized risk premium (in percent), respectively. The columns labelled Estimate, SE, t-stat and Prob > |t| give respectively the estimates, their standard errors, their t-statistics and their p-values. The four gas distribution reference portfolios and their sample are described in section 2 and table 1. The annualized mean market risk premiums for their corresponding sample period are 8.1% for DJ_GasDi, 5.2% for CAindex, 7.5% for DJ_GasUS and 6.0% for USindex.
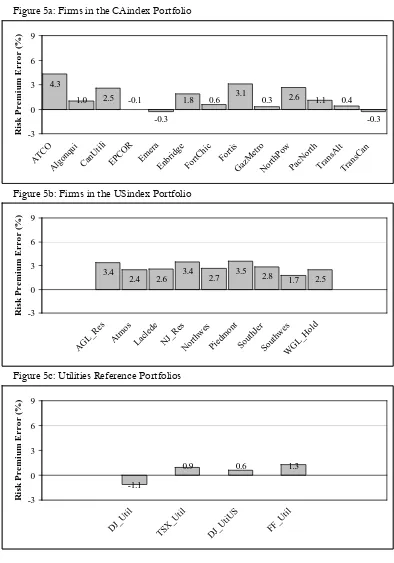
Figure 5 shows the risk premium errors for the utilities that make up the CAindex portfolios (Figure 5a), the gas distributors in the USindex portfolios (Figure 5b) and the four utilities reference portfolios (Figure 5c). The errors are generally insignificant and a comparison with Figure 1 indicates that they have decreased considerably for all portfolios. For example, for the TSX_Util portfolio, the error is down from 5.0% with the CAPM to 0.9% with the Adjusted CAPM.
Portfolio Estimate SE t-stat Prob > |t|
Panel A: Risk Premium Error (Alpha)
DJ_GasDi 1.82 2.00 0.91 0.365 CAindex 1.39 1.54 0.9 0.366 DJ_GasUS 2.68 1.97 1.36 0.176 USindex 2.89 1.37 2.11 0.035
Panel B: Adjusted Beta
DJ_GasDi 0.47 0.07 6.69 <.0001 CAindex 0.56 0.05 11.38 <.0001 DJ_GasUS 0.58 0.06 9.84 <.0001 USindex 0.64 0.04 15.44 <.0001
Panel C: Bias Correction
DJ_GasDi 4.46 2.28 1.96 0.052 CAindex 1.99 1.10 1.81 0.071 DJ_GasUS 3.12 1.61 1.94 0.054 USindex 2.26 0.77 2.94 0.004
Panel D: Risk Premium
FIGURE 5
Risk Premium Errors with the Adjusted CAPM for Various Utilities Figure 5a: Firms in the CAindex Portfolio
Figure 5b: Firms in the USindex Portfolio
Figure 5c: Utilities Reference Portfolios
NOTES: This figure shows the annualized risk premium errors (or alphas) with the Adjusted CAPM for the Canadian utilities in the CAindex portfolio (Figure 5a), the U.S. gas distributors in the USindex portfolio (Figure 5b) and the utilities reference portfolios (Figure 5c).
4.3
1.0 2.5 -0.1
-0.3
1.8 0.6 3.1 0.3 2.6 1.1 0.4
-0.3 -3 0 3 6 9 ATC O Algo nqui CanU tili EPCO R Em era Enbr idge FortC hic Fortis Gaz Met ro Nor thPo w PacN orth Tran sAlt Tran sCan R is k P rem iu m E rro r ( % ) 3.4
2.4 2.6 3.4 2.7 3.5 2.8 1.7 2.5
-3 0 3 6 9 AG L_R es Atm os Lacl ede NJ_R es North wes Piedm ont South Jer Sout hwes WG L_H old R is k P rem iu m Erro r (% ) -1.1
0.9 0.6 1.3
-3 0 3 6 9 DJ_ Util TSX _Util DJ_
5.3. Discussion
Our results support the validity of the Adjusted CAPM for determining the rate of return on energy utilities. While its risk premium estimates are in the same range as the Fama-French estimates, it arrives at its results from a different perspective. The Fama-French model advocates the use of additional risk factors to reduce the CAPM risk premium errors. The Adjusted CAPM, through its bias correction, effectively estimates the risk premium as a weighted-average of the CAPM risk premium and the realized historical risk premium, with a weighting of beta on the former.
The Adjusted CAPM thus recognizes that the CAPM is an imperfect model that can be improved with the information contained in the historical returns. Pastor and Stambaugh (1999) propose a similar strategy by demonstrating how to estimate the cost of equity by using Bayesian econometrics to incorporate the CAPM risk premium error (or alpha) in an optimal manner based on the priors of the evaluator. Consistent with our results, they also show evidence of higher costs of equity for energy utilities using their technique than using the CAPM alone.18 As the Adjusted
CAPM does not require additional risk factors like size and value, the model might be easier to interpret for regulators already familiar with the standard CAPM in their decisions.
6.CONCLUSION
It is difficult to overstate the importance of the evaluation of the expected rate of return in finance. For a firm’s management group, the expected rate of return on equity (or the equity cost of capital) is central to its overall cost of capital, i.e. the rate used to determine which projects will be undertaken. For portfolio managers, the expected rate of return on equity is an essential ingredient in portfolio decisions. For regulatory bodies, the expected return on equity is the basis for determining the fair and reasonable rate of return of a regulated enterprise. This paper is interested in evaluating the rate of return in the context of regulated energy utilities.
The academic literature contains numerous theories for determining the expected rate of return on equity. As those theories are based on simplified assumptions of the complex world in which we live, they cannot be perfect. Even if the theoretical merit of the different models can be debated, the determination of the most valid approach to explain the financial markets really becomes an empirical question – it is necessary to answer the question “which theory best explains the information about actual returns?” This paper empirically examines the validity of the model the most often used in the rate adjustment formula of regulatory bodies, the CAPM, one of the most prominent academic alternatives, the Fama-French model, and a version of the CAPM modified to account for some of its empirical deficiencies, the Adjusted CAPM.
Our empirical results show that the risk premiums for energy utilities estimated with the CAPM are rejected as too low compared to the historical risk premiums.
18 Pastor and Stambaugh (1999) obtain risk premiums that vary between the CAPM estimates, when
The rejections are related to the well-documented CAPM underestimation of the average returns of low-beta firms and value firms. The Fama-French model and the Adjusted CAPM appear statistically better specified, as we cannot reject the hypothesis that their risk premium errors are equal to zero. They suggest equity risk premiums for gas distribution utilities between 4% and 8%. Overall, our findings demonstrate that models that go beyond the CAPM have the potential to improve the estimation of the cost of equity capital of energy utilities. They are thus interesting avenues for regulators looking to set fair and reasonable equity rates of return.
ACKNOWLEDGEMENTS
We would like to thank Mark Lowenstein and Jacques St-Pierre for helpful discussions. We gratefully acknowledge financial support from the Institut de Finance Mathématique de Montréal, the Investors Group Chair in Financial Planning (Chrétien), the Faculty of Business Administration at Laval University (Chrétien) and the Faculté d’administration, Université de Sherbrooke (Coggins). Stéphane Chrétien is also grateful to Kalok Chan (Department Head) and the Department of Finance at the Hong Kong University of Science and Technology, where part of this research was conducted while he was a Visiting Associate Professor of Finance.
REFERENCES
Ang, A., R.J. Hodrick, Y. Xing and X. Zhang (2006) ‘The Cross-Section of Volatility and Expected Returns,’ Journal of Finance 51:259-299.
Ang, A., R.J. Hodrick, Y. Xing and X. Zhang (2009) ‘High Idiosyncratic Volatility and Low Returns: International Evidence and Further U.S. Evidence,’ Journal of Financial Economics 91:1-23.
Banz, R. (1981) ‘The Relation between Return and Market Value of Common Stocks,’ Journal of Financial Economics 9:3–18.
Bartholdy, J. (1993) ‘Testing for a Price-Earnings Effect on the Toronto Stock Exchange,’ Canadian Journal of Administrative Sciences 10:60–67.
Basu, S. (1977) ‘The Investment Performance of Common Stocks in Relation to Their Price to Earnings Ratios: A Test of the Efficient Market Hypothesis,’ Journal of Finance 32:663–682.
Berk, J., R.C. Green and V. Naik (1999) ‘Optimal Investment, Growth Options, and Security Returns,’ Journal of Finance 54:1553–1607.
Black, F., M.C. Jensen and M. Scholes (1972) ‘The Capital Asset Pricing Model: Some Empirical Tests’ in M.C. Jensen (ed.) Studies in the Theory of Capital Markets (New York:Praeger Press) pp.79–121.
Blume, M. (1971) ‘On the Assessment of Risk,’ Journal of Finance 26:1–10.
Blume, M. (1975) ‘Betas and their Regression Tendencies,’ Journal of Finance 30:785–895. Blume, M. and I. Friend (1973) ‘A New Look at the Capital Asset Pricing Model,’
Bonbright, J.C., A.L. Danielsen and D.R. Kamerschen (1988) Principles of Public Utility Rates. (Arlington:Public Utilities Reports Inc.)
Bourgeois, J. and J. Lussier (1994) ‘P/Es and Performance in the Canadian Market,’ Canadian Investment Review Spring:33–39.
Carhart, M.M. (1997) ‘On Persistence in Mutual Fund Performance,’ Journal of Finance 52:57–82.
Carlson, M., A. Fisher and R. Giammarino (2004) ‘Corporate Investment and Asset Price Dynamics: Implications for the Cross-Section of Returns,’ Journal of Finance 59:2577–2603.
Cochrane, J.H. (1999) ‘New Facts in Finance,’ Economic Perspectives Federal Reserve Bank of Chicago 23:36–58.
Cochrane, J.H. (2001) Asset Pricing (Princeton:Princeton University Press) Davis, J. (2006) ‘Reviewing the CAPM,’ Canadian Investment Review Winter:21. Elfakhani, S., L.J. Lockwood and T.S. Zaher (1998) ‘Small Firm and Value Effects in
the Canadian Stock Market,’ Journal of Financial Research 21:277–291.
Fama, E.F. and K.R. French (1992) ‘The Cross-Section of Expected Stock Returns,’ Journal of Finance 47:427–465.
Fama, E.F. and K.R. French (1993) ‘Common Risk Factors in the Returns on Stocks and Bonds,’ Journal of Financial Economics 33:3–56.
Fama, E.F. and K.R. French (1996a) ‘Multifactor Explanations of Asset Pricing Anomalies,’ Journal of Finance 51:55–84.
Fama, E.F. and K.R. French (1996b) ‘The CAPM is Wanted, Dead or Alive,’ Journal of Finance 51:1947–1958.
Fama, E.F. and K.R. French (1997) ‘Industry Cost of Equity,’ Journal of Financial Economics 43:153–193.
Fama, E.F. and K.R. French (1998) ‘Value Versus Growth: The International Evidence,’ Journal of Finance 53:1975–1999.
Fama, E.F. and K.R. French (2004) ‘The Capital Asset Pricing Model: Theory and Evidence,’ The Journal of Economic Perspectives 18:3:25–46.
Fama, E.F. and J. MacBeth (1973) ‘Risk, Return, and Equilibrium: Empirical Tests,’ Journal of Political Economy 71:607–636.
Fowler, D.J., C.H. Rorke and V. Jog (1979) ‘Heteroscedasticity, R2 and Thin Trading on
the Toronto Stock Exchange,’ Journal of Finance 34:5:1201–1210.
Fowler, D.J., C.H. Rorke and V. Jog (1980) ‘Thin Trading and Beta Estimation Problems on the Toronto Stock Exchange,’ Journal of Business Administration Fall:77– 90.
Friend, I. and M. Blume (1970) ‘Measurement of Portfolio Performance under Uncertainty,’ American Economic Review 60:607–636.
Gomez, J., L. Kogan and L. Zhang (2003) ‘Equilibrium Cross-Section of Returns,’ Journal of Political Economy 111:693–732.
Jagannathan, R. and Z. Wang (1996) ‘The Conditional CAPM and the Cross-Section of Expected Returns,’ Journal of Finance 51:3–53.
Jegadeesh, N. and S. Titman (1993) ‘Returns to Buying Winners and Selling Losers: Implications for Stock Market Efficiency,’ Journal of Finance 48:65–91.
Kothari, S.P., J. Shanken and R.G. Sloan (1995) ‘Another Look at the Cross-Section of Expected Stock Returns,’ Journal of Finance 50:185–224.
L’Her, J.-F., T. Masmoudi and J.-M. Suret (2002) ‘Effets taille et book-to-market au Canada,’ Canadian Investment Review Summer:6–10.
L’Her, J.-F., T. Masmoudi and J.-M. Suret (2004) ‘Evidence to Support the Four-Factor Pricing Model from the Canadian Stock Market,’ Journal of International Financial Markets, Institutions & Money 14:313–328.
Lakonishok, J., A. Shleifer and R. Vishny (1994) ‘Contrarian Investment, Extrapolation, and Risk,’ Journal of Finance 49:1541–1578.
Lintner, J. (1965) ‘The Valuation of Risky Assets and the Selection of Risky
Investments in Stock Portfolios and Capital Budgets,’ Review of Economics and Statistics 47:13–37.
Litzenberger, R., K. Ramaswamy and H. Sosin (1980) ‘On the CAPM Approach to the Estimation of A Public Utility’s Cost of Equity Capital,’ Journal of Finance 35:369– 383.
Lo, A. and A.C. MacKinlay (1990) ‘Data-Snooping Biases in Tests of Financial Asset Pricing Models,’ Review of Financial Studies 3:431–468.
Merton, R. (1973) ‘An Intertemporal Capital Asset Pricing Model,’ Econometrica 41:867– 887.
Morin, R.A. (1980) ‘Market Line Theory and the Canadian Equity Market,’ Journal of Business Administration Fall:57–76.
Morin, R.A. (2006) New Regulatory Finance (Vienna:Public Utilities Reports Inc.) Newey, W. and K. West (1987) ‘A Simple, Positive Semi-Definite, Heteroscedasticity
and Autocorrelation Consistent Covariance Matrix,’ Econometrica 55:703–708. Pastor, L. and R.F. Stambaugh (1999) ‘Costs of Equity Capital and Model Mispricing,’
Journal of Finance 54:67–121.
Pastor, L. and R.F. Stambaugh (2003) ‘Liquidity Risk and Expected Stock Returns,’ Journal of Political Economy 111:642–685.
Ross, S.A. (1976) ‘The Arbitrage Theory of Capital Asset Pricing,’ Journal of Economic Theory 13:341–360.
Schink, G.R. and R.S. Bower (1994) ‘Application of the Fama-French Model to Utility Stocks,’ Financial Markets, Institutions and Instruments 3:74–96.
Sharpe, W.F. (1964) ‘Capital Asset Prices: A Theory of Market Equilibrium under Conditions of Risk,’ Journal of Finance 19:425–442.