Shiraz University
Thin Layer Drying and Equilibrium Moisture Content
Equations for Canola (
Brassica napus L.
)
D. ZARE
1**, M. RANJBARAN
1*, M. NIAKOUSARI
2*and M.
JAVIDI
1*1Department of Agricultural Machinery, College of Agriculture, Shiraz University, Shiraz, I. R. Iran 2Department of Food Science and Technology, College of Agriculture, Shiraz University, Shiraz,
I. R. Iran
ABSTRACT- A fully instrumented air conditioning laboratory unit capable of controlling drying air temperature and humidity integrated with an instantaneous weighing thin layer drying system was used to investigate the thin layer drying behavior and desorption equilibrium moisture content of canola (Brassica napus L.). To this aim, freshly harvested canola samples with moisture content of about 12±0.5% (d.b.) were dried at temperature levels of 40, 45, 50, 55°C and absolute air
humidity levels of 0.005, 0.01, 0.015, and 0.02 kg/kg. The instantaneous grain moisture content was measured by weighing the sample periodically. Drying was continued until canola kernels reached a constant weight to obtain the hygroscopic equilibrium moisture for different combinations of drying air temperature and absolute humidity. To select a suitable model for describing the thin layer drying of canola, experimental drying data were fitted with three thin layer drying models, namely, Page, Modified Page and Two-Term Exponential models. Furthermore, four widely used desorption isotherm models including Chung-Pfost, Modified Chung–Pfost, Modified Oswin, and Modified Smith were used to fit the experimental data of equilibrium moisture content. Finally, non-linear regression analyses were run and based on the highest value for R2and the lowest value for2,
mean bias error (MBE) and root mean square error (RMSE), the most suitable models for thin layer drying and equilibrium moisture content were determined to be Two-Term Exponential and Modified Smith, respectively.
Keywords: Canola, Drying, Equilibrium moisture content, Thin layer
Nomenclature
M moisture content of grain, decimal d.b., kg/kg Min initial moisture content of grain, decimal d.b., kg/kg
Me equilibrium moisture content, decimal d.b., kg/kg
MR dimensionless moisture ratio t drying time, min
T drying air temperature,°C
H absolute air humidity, kg/kg k, n, a, b, k1, k2 drying model constants
N number of observations
Z number of model constants
Subscripts
exp experimental data pre predicted data
INTRODUCTION
Canola seeds are used to produce edible oil that is suitable for human consumption. Canola oil is the world’s third largest source of vegetable oil accounting for 13% of the world's vegetable oils, followed by soybean oil 32%, and palm oil 28% (6). Canola is harvested at moisture content of 12-13% (w.b.) approximately, but for oil extraction or storage of this product, the moisture content has to be decreased to 6-7% (w.b.). Drying is a post-harvest process that not only consumes a considerable amount of energy but also affects product quality. One of the cheapest and most efficient methods to design a new dryer or improve current dryers is the simulation of the drying process. In this way, the designer can look inside the dryer prior to manufacturing it and access information about the drying process.
MATERIALS AND METHODS Experimental apparatus and procedure
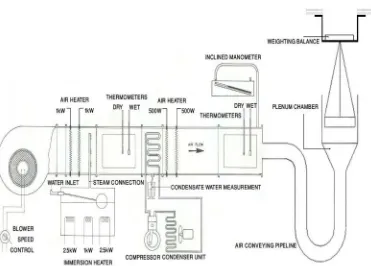
A fully instrumented Hilton Air Conditioning Laboratory Unit capable of controlling drying air temperature and humidity was used. The apparatus has two main sections including an air conditioning and a drying section, shown in Fig. 1.
Fig. 1. Schematic layout of the Hilton Air Conditioning Laboratory Unit integrated with a thin layer dryer system
The air conditioning section of the experimental apparatus consisted of a fan with variable speed control, two air pre-heaters of 1 kW, three immersion heaters (2.5, 1, 2.5 kW) with a steam connection inserted into the air duct which forms a steam injection section, a cooling coil and two air after-heaters of 0.5 kW. Power input of all heaters could be controlled separately. Voltage supply to one of the air pre-heaters and one of the air after-heaters was regulated by manually controlled dimmer states in order to keep drying temperatures constant. The drying section of the apparatus had a circular drying tray, 20cm in diameter with a capacity of 200g, on which canola were fully exposed to the air stream in thin-layer form. The tray holding the sample was suspended under the weighing balance (GF-600, ±0.001g) during the tests. The air stream was uniform in temperature and humidity. Moreover, to ensure the uniformity of air velocity distribution at the bed section, air was passed through a distributor prior to approaching the bed. For measuring and controlling air temperature and humidity a digital temperature and humidity meter -Testo 625- with an accuracy of ±0.5oC and range of -10 to 60oC and ±2.5% RH ranging from 0 to
For each treatment about 100 g canola with initial moisture content of about 12% w.b., was kept in plastic bags and stored in a cold chamber at a temperature of approximately 5°C. Samples were taken out of the chamber about 4 hours prior to
each drying test, so that they reached thermal equilibrium with ambient conditions. Drying experiments were performed at 40, 45, 50, and 55 °C air temperatures. At
each temperature level the air absolute humidity was set at 0.005, 0.01, 0.015, 0.02 kg/kg. The weight reduction of samples was measured regularly during the drying process in less than 30 s. To eliminate measuring fluctuations, the air direction was changed using a lid to avoid reaching the hanging sample holder during weighing. The drying continued until the samples reached a constant weight to obtain the hygroscopic equilibrium moisture for different combinations of drying air temperature and absolute humidity. Three measurements were done for each drying condition.
Drying models
The moisture ratio of samples during drying can be expressed by the following equation (11 and 15):
e in
e
M M
M M MR
(1)
To select a suitable model for describing the drying process of canola, drying curves were fitted with three thin layer drying equations (Table 1).
Table 1. Mathematical models applied to the moisture ratio values
Equation No Model name Model Ref.
1 Page MR=exp(Ktn) (11)
2 Modified Page MR=exp(Kt)n (19 and 27)
3 Two-Term Exponential MR=aexp(-K1t)+ bexp(-K2t) (21)
Furthermore, four widely used desorption isotherm models, namely, Chung-Pfost, Modified Chung–Chung-Pfost, Modified Oswin, and Modified Smith were used to fit the measured values of the equilibrium moisture content during drying process (Table 2.).
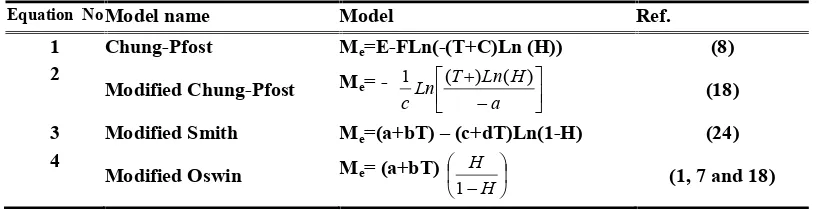
Table 2. Mathematical models applied to the equilibrium moisture content
Equation NoModel name Model Ref.
1 Chung-Pfost Me=E-FLn(-(T+C)Ln (H)) (8)
2
Modified Chung-Pfost Me= - LnTLna H c
) ( ) ( 1
(18) 3 Modified Smith Me=(a+bT) – (c+dT)Ln(1-H) (24) 4
Modified Oswin Me= (a+bT)
HH
1 (1, 7 and 18)
The constants in the models were determined and correlated to drying air temperature and absolute humidity by non-linear regression using SPSS 16 software. The coefficient of determination (R2) was one of the main criteria for selecting the
square error (RMSE). In acceptable fitness, the value of R2should be higher and2 ,
MBE and RMSE values should be lower (10, 12, 13 and 25). The parameters were calculated by the following equations:
Z N MR MR N i pre
12 exp 2 (2)
N i pre MR MR N MBE 1 exp 1 (3)
21 1 2 exp 1
N i pre MR MR N RMSE (4)RESULTS AND DISCUSSION
The moisture ratio of canola dried at different air temperatures and absolute humidity were fitted into the thin layer drying models (Table 1). Furthermore, the experimental equilibrium moisture content data were fitted with the stated desorption isotherm models (Table 2). The corresponding constants in the thin layer and desorption models, the coefficient of determination and results of statistical analyses are given in Tables 3 and 4. In all cases, R2values for the mathematical models were
greater than 0.95, indicating a good fit. Based on the highest R2 and lowest2, mean bias error (MBE) and root mean square error (RMSE), the most suitable models for thin layer drying and equilibrium moisture were found to be Two-Term Exponential and Modified Smith, respectively. Gazor (13) showed that the Modified Oswin and Modified Chung-Pfost models had good fitting with experimental data of equilibrium moisture content of canola at 30, 40, 50 and 60 °C. However, the best model might be selected based on its simplicity.
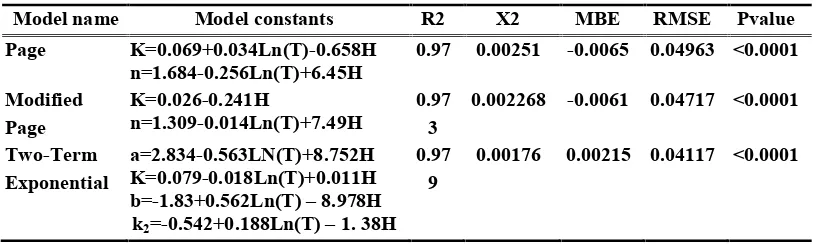
Table 3. Statistical results of mathematical modeling of desorption equations
Model name Model constants R2 X2 MBE RMSE Pvalue
Page K=0.069+0.034Ln(T)-0.658H
n=1.684-0.256Ln(T)+6.45H 0.97 0.00251 -0.0065 0.04963 <0.0001 Modified
Page
K=0.026-0.241H
n=1.309-0.014Ln(T)+7.49H 0.973 0.002268 -0.0061 0.04717 <0.0001 Two-Term
Exponential a=2.834-0.563LN(T)+8.752HK=0.079-0.018Ln(T)+0.011H b=-1.83+0.562Ln(T) – 8.978H
k2=-0.542+0.188Ln(T) – 1. 38H 0.97
9 0.00176 0.00215 0.04117 <0.0001
To determine the effect of the drying air temperature on the drying behavior of canola seeds the drying curves are plotted for different levels of drying air temperature at constant drying air absolute humidity of 0.01kg/kg (Fig 3). The same trends were obtained for other treatments. It can be seen that higher levels of drying air temperature lead in less drying time. This is due to higher rate of moisture migration inside canola seeds. Similar results are reported by other studies (2, 5, 17, and 19).
Table 4. Statistical results of mathematical modeling of equilibrium moisture content
Model name Model constants R2 X2 MBE RMSE Pvalue
Chung-Pfost E=0.218, F=0.032,C=-29.6 0.947 8.8×10⁻⁶ 2.6×10⁻¹² 0.0027 <0.0001 Modified
Chung-Pfost a=6.0, b=18.36, c=44.29 0.947 8.7×10⁻⁶ 6.7×10⁻¹¹ 0.0027
<0.0001
Modified Smith
a=0.134, b=-0.001,
c=2.967, d=-0.049 0.972
5.06×10
-6 -2.41×10⁻⁹ 0.002 <0.0001 Modified
Oswin a=0.249, b=-0.003,c=0.083 0.951 8×10⁻⁶ 6.9×10⁻⁶ 0.0025 <0.0001
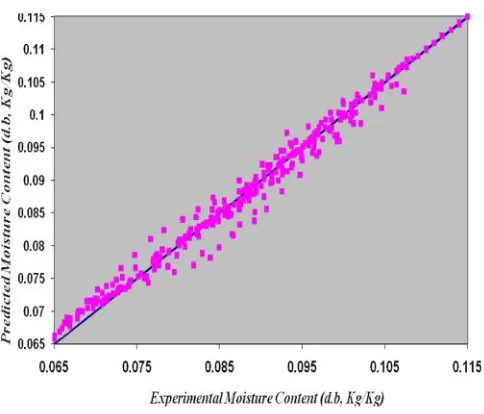
Fig. 2. The experimental data versus predicted data for Two-Term Exponential model
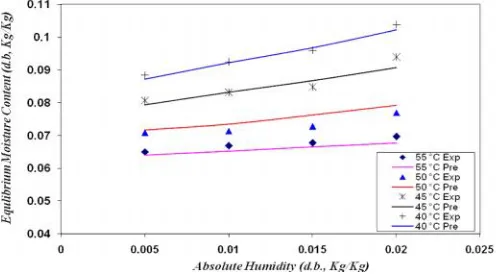
The variations of moisture content of canola during drying at a constant level of drying air temperature are shown in Fig 4. The drying time decreases when the absolute humidity of the drying air reduces, due to the increase in the difference between water vapor pressure of the air stream and canola seeds. The same trends were obtained for other treatments.
decreases. An increase in drying air humidity at a constant air temperature leads in an upward trend in the value of the equilibrium moisture content. Such results have been previously reported by other researchers (4, 7, 13 and 14).
Fig. 3. The drying trend for different drying air temperatures at constant absolute humidity of 0.01Kg/Kg
Fig. 4. The drying trend of canola for different drying air humidity levels at constant air temperature of 45°C
CONCLUSIONS
Thin layer drying of canola was modeled based on temperature and absolute humidity of drying air, both independent drying parameters. Such method of modeling can help the designers of dryers to find the exact effect of each parameter on the drying behavior of grains. The most suitable model for thin layer drying and equilibrium moisture were Two-Term Exponential and Modified Smith models, respectively. Moreover, it was found that increasing the drying temperature or decreasing the drying humidity resulted in a reduction of the drying time.
REFERENCES
1. Akanbi, C. T., R. S. Adeyemi and A. Ojo. 2005. Drying characteristics and sorption isotherm of tomato slices. J. Food Eng. 73: 157–163.
2. Agrawal, Y. C., and R. D. Singh. 1977. Thin layer drying studies for short grain rice. ASAE, St. Joseph (MI), Paper NO: 77-3531.
3. Aviara, N. A., O. O. Ajibola., O. A. Aregbesola and M. A. Adedeji. 2006. Moisture sorption isotherms of sorghum malt at 40 and 50°C. J. Stored Products Res. 42: 290–301.
4. Basunia, M. A. and T. Abe. 2001. Thin layer solar characteristic of rough rice under natural convection. J. Food Eng. 47: 295-301.
5. Bruce, D. M. 1985. Exposed-layer barley drying, three models fitted to new data up to 150°C. J. Agri. Eng Res. 32: 337–348.
6. CRB Fundamentals (Commodity Research Bureau). 2007. URL:
http://www.crbtrader.com/fund/articles asp, Accessed at 12 April 2008.
7. Chowdhury, M. M. I., M. D. Huda., M. A. Hossain and M. S. Hassan. 2005. Moisture sorption isotherms for mungbean (Vigna radiata L). J. Food Eng. 74: 462–467.
8. Chung, D. S. and H. B. Pfost. 1967. Adsorption and desorption of water vapor by cereal grains and their products. Part II. Development of the general isotherm equation. Trans. ASAE. 10: 552–555.
9. Correa, P. C., J. H. Martins and D. Christ. 1999. Thin layer Drying Rate and Loss of Viability Modeling for rapeseed (canola). J. Agri. Engi. Res.74:33-39. 10. Demir, V., T. A. K. Yagcioglu and A. Degirmencioglu. 2004. Mathematical
modelling and the determination of some quality parameters of air-dried bay leaves. Biosys. Engi. 88(3): 325–335.
11. Doymaz, I. and M. Pala. 2002. Hot air drying characteristics of red pepper. J. Food Engi. 55: 331–335.
12. Erenturk, S., M. S. Gulaboglu and S. Gultekin. 2004. The thin layer drying characteristics of rosehip. Biosys. Engi. 89(2): 159–166.
14. Ghodake, H. M., T. K. Goswami and A. Chakraverty. 2007. Moisture sorption isotherms, heat of sorption and vaporization of withered leaves, black and green tea. J. Food Eng. 78: 827-835.
15. Goyal, R. K., A. R. P. Kingsly, M. R. Manikantan and S. M. Ilyas. 2006. Mathematical drying of thin layer drying kinetics of plum in a tunnel dryer. J. Food Eng. 79: 176–180.
16. Kulasiri, D. G., D. H. Vaughn, J. S. Cundiff and W. F. Wilcke. 1989. Thin layer drying rates of Virginia type peanuts. ASAE paper No. 89-6600.
17. Mohapatra, D. and P. Srinivasa Rao. 2005. A thin layer drying model of parboiled wheat. J. Food Eng. 66(4): 513-518.
18. Oyeladea, O. J., T. Y. Tunde-Akintundeb, J. C. Igbekac., M. O. Oke and O. Y. Raji. 2007. Modelling moisture sorption isotherms for maize flour. J. Stored Products Res. 44(2): 179-185.
19. Overhults, D. D., G. M. White, M. E. Hamilton and I. J. Ross. 1973. Drying soybeans with heated air. Trans. ASAE. 16:195–200.
20. Samapundo, S., F. Devlieghere, B. Meulenaer, A. Atukwase, Y. Lamboni and J. M. Debevere. 2007. Sorption isotherms and isosteric heats of sorption of whole yellow dent corn. J. Food Eng. 79: 168–175.
21. Sharaf-Eldeen, Y. I., M. Y. Hamdy and J. L. Blaisdell. 1979. Mathematical description of drying fully exposed grains. ASAE, Paper No: 79-3034. St Joseph, MI: ASAE.
22. Sokhansanj, S., D. Singh and J. D. Wasserman. 1984. Drying characteristics of several grains subjected to repetitive wetting and drying cycles. Trans. ASAE. 27(3): 903-906.
23. Sokhansanj, S., W. Zhijie, D. Jayas and T. Kameoka. 1986. Equilibrium relative humidity and moisture content of rapeseed (canola) from 5oC to 25oC. Trans.
ASAE.28: 837-839.
24. Togrul H. and N. Arslan. 2006. Moisture sorption isotherms and thermodynamic properties of walnut kernels. J. Stored Products Res. 43:252–264.
25. Togrul, I. T. and D. Pehlivan. 2002. Mathematical modelling of solar drying of apricots in thin layers. J. Food Engi. 55: 209–216.
26. Viswanathan, R., D. S. Jayas and R. B. Hulasare. 2003. Sorption isotherms of tomato slices and onion shreds. Biosys. Engi. 86: 465–472.
27. White, G. M., I. J. Ross and R. Ponelert. 1981. Fully exposed drying of popcorn. Trans. ASAE. 24:466–468.